Original papers
HYDROTHERMAL REHYDROXYLATION OF KAOLINITE
STUDIED BY THERMAL ANALYSIS
#ALEXANDRA KLOUŽKOVÁ*, PETRA ZEMENOVÁ*, MARTINA KOHOUTKOVÁ**, JAROSLAV KLOUŽEK*** *Department of Glass and Ceramics, Institute of Chemical Technology Prague, Technická 5, 166 28 Prague, Czech Republic,
**Central Laboratories, Institute of Chemical Technology Prague, Technická 5, Prague, 166 28, Czech Republic *** Laboratory of Inorganic Materials, Joint Workplace of the Institute of Chemical Technology Prague and the Institute of Rock Structure and Mechanics ASCR, v.v.i., V Holešovičkách 41, 182 09 Prague 8, Czech Republic
#E-mail: alexandra.klouzkova@vscht.cz Submitted July 8, 2013; accepted December 2, 2013
Keywords: Kaolinite, Thermal analysis, Dehydroxylation, Rehydroxylation, Archaeological ceramics
The effect of hydrothermal conditions on process of kaolinite rehydroxylation at 180°C and 230°C and for soaking times from 1 to 200 hour was studied by thermal analysis (DTA, DSC, TG). It is shown that the kaolinite dehydroxylation of rehydroxylated samples shifts to lower temperatures compared to the original kaolinite. Amounts of kaolinite in rehydroxylated samples were calculated from TG curves. The curve of the kaolinite mass gain (Δm) plotted against the time of hydrothermal treatment indicates a two stage process with a different mass gain rate representing short and long-time measurements. Multiple dehydroxylation was studied by repeated calcinations (2 h at 600°C) and hydrothermal treatments (10 h at 230°C). It was proved that values of activation energy (Ea) of multiple dehydroxylations decreased with the increasing number of repeated treatments. Conclusions of the study were applied for the investigation of kaolinite origin in archaeological samples from Roztoky near Prague.
INTRODUCTION
Kaolinite (Al2Si2O5(OH)4) is a clay mineral which is used as one of the main components of raw materials mixtures in ceramics fabrication from its very beginnings. Kaolinite is a dioctahedral 1:1 phyllosilicate, which is formed by layers of tetrahedral SiO4 and octahedral AlO6 which alternate periodically. Each unit cell includes four hydroxyl groups. The inner hydroxyl group lies between the tetrahedral and octahedral sheet, while the three inner-surface hydroxyl groups lie between adjacent kaolinite layers [1].
When kaolinite is heated, it loses any physically absorbed water between 100°C and 200°C, i.e. dehyd-ration occurs. Kaolinite transforms to an unstable non-crystalline product, metakaolinite (Al2Si2O7), after cal-cination at 450 - 600°C, by loss of chemically bound water [2, 3]. This product can partially rehydroxylate to structures close to the original kaolinite, recovering most of structural hydroxyl groups, by the inluence of atmospheric or soil moisture [4, 5]. The irst reaction of moisture with ired clay is called irst rehydroxylation. The second dehydroxylation and subsequent rehydroxy-lations can occur when kaolinite is heated repeatedly and then exposed to atmospheric moisture.
In case of conventional ceramic materials, the pro-cess of rehydroxylation is called “ageing” and is related
to a moisture expansion of a ceramic body [5]. The process of natural rehydroxylation occurs in ceramic materials containing residua of clay minerals due to a long-time inluence of soil or atmospheric moisture. This process can be accelerated by a hydrothermal treat-ment in autoclaves in laboratory conditions.
13.96 wt. % H2O) [14]. This value is used as the standard value for the determination of kaolinite content in the studied materials from TG curves.
The process of kaolinite rehydroxylation has been studied in our laboratory for a long time. The research was irstly related to a problem of brick hourdises [15, 16, 17, 18], later extended to the ield of archaeological ceramics [19, 20, 21]. In connection with archaeological ceramics, conditions of a hydrothermal treatment, which could simulate long time storage of ceramic materials under the ground and help to identify the origin of clay minerals in a ceramic body, are being studied.
The aim of this work was to determine the effect of temperature and time of hydrothermal treatment on the ability of kaolinite rehydroxylation, to deine differences in thermal behaviour between original and rehydroxylated kaolinite and to quantify the amount of rehydroxylated kaolinite.
EXPERIMENTAL
Kaolin Sedlec Imperial (K), from Sedlecký kaolin a.s. (Czech Republic), was used in this study as a raw material. Powder samples were prepared from a dried granulate in an agate mortar in the form of ine powder. Samples were subsequently ired in a Pt crucible in a laboratory furnace with the heating rate 10°C∙min-1. The choice of calcining conditions – 2 hours at 600°C was based on previous research [21]. Products of calci-nations were subsequently hydrothermally treated (HT) in laboratory autoclaves at 230°C (2.77 MPa) and 180°C (1 MPa) with soaking times from 1 to 200 hours. Multiple dehydroxylation (with the maximum of four rehydroxylation processes) was studied by repeated experiments of calcinations (2 h at 600°C) and hydro-thermal treatments (10 h at 230°C). A solid/solution ratio of 1 g sample/ 20 ml water was used in the hydrothermal experiments. All samples were dried to constant weight (2 hours at 105°C) before thermal analysis.
The raw material was characterised by its particle size distribution, and further by X-ray luorescence (XRF), X-ray diffraction (XRD), infrared spectroscopy (IR) and thermal analysis (TA). Processes of dehydro-xylation and rehydrodehydro-xylation were studied by thermal analyses. The particle size distribution was evaluated by laser diffraction (Fritsch Analysette 22 NanoTec). The chemical composition was determined by XRF (Sequential WD-XRF spectrometer ARL 9400 XP+). XRD (Diffractometer PANalytical X´pert Pro) was used to identify accessory minerals in the raw kaolin sample. The structural ordering of kaolinite was characterised by IR spectroscopy in the range 400 - 4000 cm-1 (spectrometer Nicolet IS 10, Thermo Scientiic). Measured data were evaluated using programs Omnic and Origin. Thermal analyses were performed with a Setaram Setsys Evo-lution 16 system in DTA - TG or DSC - TG mode using 25 ± 0.02 mg of a sample and heating rate 10°C∙min-1 in the temperature range of 20 - 1200°C in nitrogen low.
The amount of kaolinite in the original sample of kaolin and in rehydroxylated samples (Δm) was de-termined from TG curves with end conditions from dTG. The activation energy Ea (kJ∙mol-1) of the dehydroxylation was calculated by Kissinger-Akahira-Sunose method from DSC data [9] according to Equation 1:
(1)
where β is the heating rate (K∙min-1), R is the gas con-stant (8.314 J∙K-1mol-1), Tα is the temperature (K) for a constant degree of conversion α (calculated by integ-ration of peak area) and C is the constant.
RESULTS AND DISCUSSION
The process of kaolinite rehydroxylation was stu-died in samples prepared from the technical raw material kaolin Sedlec Imperial. The granulated raw material was grinded to the form of ine powder with the particle
, 2
)
(
ln
α α
α β
RT E C T
a − =
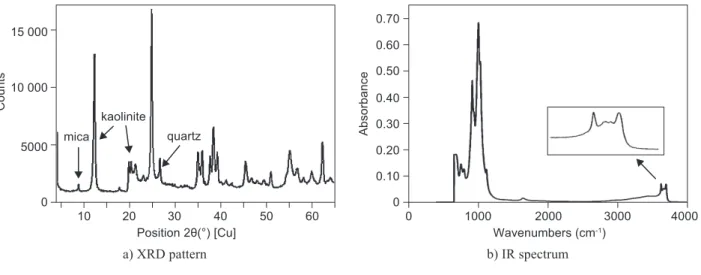
Figure 1. Raw material - kaolin Sedlec Imperial.
20 30
Position 2θ(°) [Cu]
40 50 60
kaolinite
10
mica quartz
C
o
u
n
ts
0 5000 10 000 15 000
1000 2000
Wavenumbers (cm-1)
3000 4000 0
A
b
s
o
rb
a
n
c
e
0 0.20 0.40 0.60 0.70
0.10 0.30 0.50
median size of 3.2 µm. The chemical composition of the raw kaolin was 50 wt. % SiO2, 47 wt. % Al2O3, 1.1 wt. % Fe2O3, 0.3 wt. % TiO2, 0.4 wt. % CaO, 0.3 wt. % MgO and 1.1 wt. % K2O. Figure 1a shows XRD pattern of the raw material. It contains kaolinite as the main crystalline phase accompanied by a small amount of quartz and mica. Figure 1b shows the structural ordering of kaolinite in the raw material characterised by IR bands at 3654, 3668 and 3691 cm-1, belonging to three inner-surface OH bonds, and a peak at 3620 cm-1 which belongs to the inner OH bond. The kaolinite behaviour during temperature increase is presented by curves from thermal analysis (Figure 2). The dehydroxylation of kaolinite to metakaolinite proceeds in the temperature interval from 420 to 665°C with the maximum at 542°C. In the course of dehydroxylation the loss of 12.1 wt. % H2O was monitored. Owing to the high amount of kaolinite, the peaks related to quartz transformation and mica dehydroxylation could not be seen in the DSC curve. The release of water was conirmed by the curve related to the release of water vapour detected by the mass
spectrometer. DSC curve also showed an exothermic peak at 987°C, which is related to the crystallisation of a defective spinel structure.
Rehydroxylation of kaolinite was studied in samp-les ired for 2 h at 600°C, in which any kaolinite was identiied by XRD and IR spectroscopy. The content of kaolinite in rehydroxylated samples (Δm) was determined from dTG curves.
Figure 3a shows dehydroxylation DSC curves of the raw material (irst dehydroxylation) and rexylated samples (second dehydroxylation) for the hydro-thermal treatment at 230°C. The curves of the second dehydroxylation show higher asymmetry compared to the irst dehydroxylation which is due to decreasing degree of structural ordering of the rehydroxylated kaolinite. The shape of endothermic peak and the temperature interval of dehydroxylation relect the effect of hydrothermal conditions on the process of kaolinite rehydroxylation. The dehydroxylation process in rehydroxylated samples starts in the very narrow temperature range 340 - 350°C. The temperature of the dehydroxylation end shifts to higher temperatures with increasing time of the hydrothermal treatment. Figure 3b shows mass differences in form of TG curves of the samples, which were used for the determination of the kaolinite amount (Δm) in the samples.
Figure 4 shows the maximum of peak Tp and mass gain (Δm) plotted against the time of hydrothermal treatment. Both curves exhibit the same two stage process. The irst stage represents early-time measurements, approximately irst 10 hours, with relatively high mass gain rate. The second stage representing long-time measurement proceeds with a much lower rate. Comparing values of the peak maximum temperatures (i.e. the temperature of the highest reaction rate), the most profound effect of the time of hydrothermal treatment on the rehydroxylation is visible in the course of the irst few hours. Only a slight effect was registered for treatments of 50 hours and longer.
Figure 2. Thermal analysis of the raw material: DTA-TG, release of CO2 and H2O.
200 400
Temperature (°C)
TG H2O
DTA CO2
600 800 1000 1200
0
D
T
A
(
µ
V
)
-60 -40 -20 0 10 20 30
-50 -30 -10
6×10-11
8×10-11
1×10⁻¹⁰
1×10⁻¹⁰
1.5×10⁻¹¹
2.5×10⁻¹¹
2×10-11
T
G
(
%
)
H2
O
e
x
o
C
O2
14 10 6 2 0 2
12 8 4 1.2×10⁻¹⁰
a) DSC curves b) TG curves
Figure 3. Dehydroxylation of the raw kaolin and rehydroxylated samples at HT 230°C.
350 400
Temperature (°C)
450 500 550 600 650 700
300
D
S
C
(
µ
V
m
g
-1)
-0.30 -0.20 -0.10
-0.25 -0.15 -0.05 0
original
1 h 2 h 3 h 4 h 5 h 6 h 7 h 25 h 100 h 200 h
200 300
Temperature (°C)
1 h
2 h
3 h 4 h
5 h
6 h 7 h
25 h 100 h 200 h original
400 500 600 700
100
T
G
(
w
t.
%
)
-12 -8 -4
The effect of the conditions of hydrothermal treatment (time and temperature) on the process of rehydroxylation is presented in Figure 5, where DSC curves of samples treated at 180 and 230°C and different
soaking times are compared. Lower temperatures and times of hydrothermal treatment shift the kaolinite dehydroxylation to lower temperatures. For example, the temperature of the peak maximum was 520°C for 200 hours at 230°C and 491°C for 200 hours at 180°C.
Figure 6 shows Δm values plotted against the time of hydrothermal treatment at 180°C and 230°C. Both curves exhibit two stage processes. The kaolinite mass gain proceeds at an apparently higher rate in case of 230°C in the irst stage. On the contrary, approximately the same trend at both temperatures was found in the second stage. The amount of rehydroxylated kaolinite is increasing with increasing temperature of the hydro-thermal treatment. The biggest differences were found for short soaking times, e.g. for 10 h at 180°C the mass gain was 9 wt. %, compared to 51 wt. % at 10 h at 230°C.
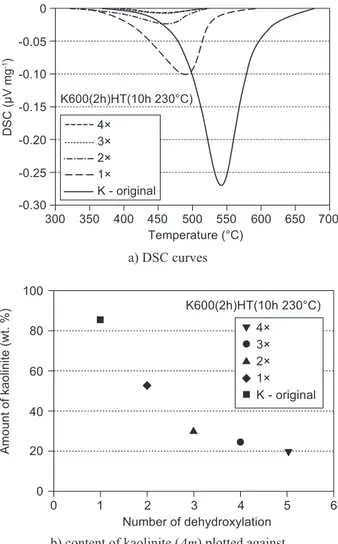
Results of a multiple dehydroxylation of kaolinite are presented in Figure 7. The igure shows that the ability of metakaolinite to rehydroxylate to kaolinite decreases with an increasing number of repeated calcinations and hydrothermal treatments, which is characterised by a decreasing amount of rehydroxylated kaolinite and a shift of Tp values to lower temperatures. The most pronounced Figure 4. The effect of hydrothermal treatment at 230°C on
Tp and Δm.
Figure 5. DSC curves of rehydroxylated samples at 180 and 230°C and soaking times of 10, 25, 100 and 200 hours.
Figure 6. Amount of kaolinite (Δm) plotted against the time of hydrothermal treatment at 180 and 230°C.
50
TG DSC
100
Time of hydrothermal treatment at 230°C (hour)
150 200 0 T e m p e ra tu re o f th e p e a k m a x im u m ( °C ) 440 460 480 500 520 540 T G ( w t. % ) 10 6 2 0 12 8 4 350 400 Temperature (°C)
450 500 550 600 650 700
300 D S C ( µ V m g -1) -0.12 -0.08 -0.04 -0.10 -0.06 -0.14 -0.16 -0.02 0
HT 180°C
HT 230°C
50 100
Time of hydrothermal treatment at 230°C (hour)
150 200 250
0 A m o u n t o f k a o lin it e ( w t. % ) 0 20 40 60 80 100 HT 180°C HT 230°C K - original
a) DSC curves
b) content of kaolinite (Δm) plotted against the number of dehydroxylation Figure 7. Multiple dehydroxylation of kaolinite.
350 400
4×
3× 2× 1× K - original
Temperature (°C)
450 500 550 600 650 700
300 D S C ( µ V m g -1) -0.20 -0.10 -0.15 -0.05 -0.25 -0.30 0 K600(2h)HT(10h 230°C) 1 2 4× 3× 2× 1× K - original
Number of dehydroxylation
3 4 5 6
decrease of the amount of rehydroxylated kaolinite is between the irst and second dehydroxylation, where it is about 28 wt. %. Comparing DSC curves, the sample shows approximately same dehydroxylation peak during the third and fourth treatment. Values of activation ener-gy (Ea) of multiple dehydroxylations decreased with an increasing number of repeated treatments. The Ea value was 157 kJ∙mol-1 for the irst dehydroxylation, 133 kJ∙mol-1 for the second dehydroxylation and 102 kJ∙mol-1 for the third dehydroxylation.
Aplication of the study for archaeological ceramics
Kaolinite rehydroxylation and the use of hydro-thermal treatment were studied already during researches of several archeological objects such as a moon-shaped idol from the Bronze age [21], a Gothic ceramic tile pavement from Břevnov Monastery (NPÚ), a Romanic ceramic tile pavement from Dolní Chabry (NPÚ) and Medieval vessels from Roztoky near Prague (ARU) [22]. Archaeological indings from the 6th – 7th century from Roztoky near Prague, comprising besides ired potsherds of ceramic vessels also unired ceramic material (Figure 8a), were found as a very suitable material for kaolinite rehydroxylation studies. This unired material could serve as a raw material for the fabrication of ceramic vessels. The material contained kaolinite from a primary source (thermally untreated) and was chosen as a comparative material to kaolinite, which was identiied in the archaeological vessel 8714 (Figure 8b).
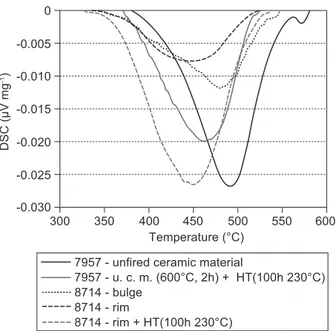
Figure 9 shows DSC curves of original and rehy-droxylated samples from untreated ceramic material and two different parts of the archaeological vessel (Figure 8b). The dehydroxylation process of the unired material starts in the temperature range 370 - 570°C with
the peak maximum at 491°C. Fired (2 h at 600°C) and hydrothermally treated (100 h at 230°C) material shows similar curves as in the case of the natural raw material - kaolin (Figure 3a). The dehydroxylation range of the rehydroxylated material shifts to lower temperature (355 - 525°C) and the peak maximum is at 460°C. In case of the archaeological vessel the dehydroxylation of the sample from bulge occurs in the temperature range 325 - 555°C with the maximum at 480°C and of the sample from rim in the range 325 - 530°C with the maximum at 450°C. Comparing the curves it was concluded that the kaolinite identiied in the rim was a product of rehydroxylation. On the contrary, kaolinite in the sample from the bulge was from a primary source. This information proved that the iring process in early
a) unired ceramic material 7957 b) ceramic vessel 8714
Figure 8. Pictures of archaeological indings unired ceramic material 7957 (a) and ceramic vessel 8714 (b) (ARU AV ČR, Praha, v. v. i.).
rim
bulge
Figure 9. DSC curves of unired ceramic material 7957 and vessel 8714.
350 400
7957 - unfired ceramic material
7957 - u. c. m. (600°C, 2h) + HT(100h 230°C) 8714 - bulge
8714 - rim
8714 - rim + HT(100h 230°C) Temperature (°C)
450 500 550 600
300
D
S
C
(
µ
V
m
g
-1)
-0.020 -0.010
-0.015 -0.005
-0.025
medieval times was very irregular and parts of a same vessel could be ired at different temperatures depending on the distance from a ireplace.
CONCLUSION
The effect of hydrothermal conditions on the pro-cess of kaolinite rehydroxylation at 180°C and 230°C and for soaking times from 1 to 200 hour was studied by use of thermal analysis. The results proved that meta- kaolinite cannot rehydroxylate to kaolinite having original structure and quantity even after 200 h at 230°C of the hydrothermal treatment. The process of kaoli-nite dehydroxylation of rehydroxylated samples shifts to lower temperatures compared to the original kaoli-nite in the raw material. The curves of the second dehydroxylation show higher asymmetry compared to the irst dehydroxylation which is due to the decreasing degree of structural ordering of the rehydroxylated kao-linite. Higher temperatures and times of hydrothermal treatment shift the kaolinite dehydroxylation to higher temperatures. The curve of the kaolinite mass gain (Δm) plotted against the time of hydrothermal treatment reveals a two stage process. The irst stage represents early-time measurements, approximately the irst 10 hours, with a relatively high rate. The second stage, representing long-time measurement, proceeds with a much lower rate. The maximum kaolinite mass gain was 65 wt. %, which was achieved for hydrothermal conditions 200 h at 230°C. Concerning multiple rehydroxylation, the ability of meta- kaolinite to rehydroxylate to kaolinite decreases with an increasing number of repeated calcinations and hydro-thermal treatments. Values of activation energy (Ea) were 157 kJ mol-1 for the irst dehydroxylation, 133 kJ mol-1 for the second dehydroxylation and 102 kJ mol-1 for the third dehydroxylation.
In the last part it was shown how the principal result of this study can be applied to the interpretation of analyses on historical or archaeological materials.
Acknowledgements
Financial support from speciic university research (MSMT No.20/2013).
The authors are grateful to the Institute of Archaeo-logy of Academy of Sciences of the Czech Republic (ARU AV ČR, Praha, v. v. i.) and the National Heritage Institute, Regional Ofice in Prague (NPÚ in Prague) for
providing archaeological samples for analysis and the Institute of Physics AS CR for the permission to perform thermal analyses using their equipment.
REFERENCES
1. Madejová J.: Vib. Spectrosc. 31, 1 (2003).
2. Hanykýř V., Kutzendörfer J.: Technologie keramiky. Sili-kátový svaz, Praha 2008.
3. Ilić B.R., Mitrović A.A., Miličić L.R.: Hem. ind. 64, 351 (2010).
4. Shoval S, Yarin S, Michaelian K.H, Lapides I, Boudeuille M, Panczer G.: J. Coll. Inter. Sci. 212, 523 (1999). 5. Wilson M.A., Carter M.A., Hall C, Hoff W.D., Ince C,
Savage S.D., Mckay B., Betts I.M.: Proc. R. Soc. A 465, 2407 (2009).
6. Rocha J., Adams J.M., Klinowski J.: J. Solid State Chem.
89, 260 (1990).
7. Jesús J.G., Huertas F.J., Linares J., Ruiz Cruz M.D.: Appl. Clay Sci. 17, 245 (2000).
8. Muller F., Pons C.H., Papin A.: J. Phys. IV France. 12, 6 (2002).
9. Sahnoune F., Saheb N., Khamel B., Takkouk Z.: J. Therm. Anal. Calorim. 107, 1067 (2012).
10. Vaculíková L., Plevová E., Vallová S., Koutník I.: Acta Geodyn. Geomater. 8, 59 (2011).
11. Castelein O., Soulestin B., Bonnet J.P., Blanchart P.: Ceram. Interern. 27, 517 (2001).
12. Redfern S.A.T.: Clay miner. 22, 447 (1987).
13. Kristóf J., Frost R., Kloprogge J., Horváth E., Makó É.: J. Therm. Anal. Calorim. 69, 77 (2002).
14. Drzal L.T., Rynd J.P., Fort T.: J. Colloid Interface Sci. 93, 126 (1983).
15. Bouška, P., Hanykýř, V., Pume, D.: Stavební listy. 8, 6 (2000).
16. Bouška P., Vokáč M., Hanykýř V., Kloužková A. in:
Objemové změny pórovité keramiky. p. 5-15, ed. Bouška P., Kloužková A., Silikátový svaz, Prague 2009.
17. Bouška, P., Hanykýř, V., Maryška M., Pume D, Vokáč M:
Stropní konstrukce s deskami HURDIS. Praha: SEKURON, 2004.
18. Bouška P., Hanykýř V., Vokáč M., Pume D. in: Construction Materials. p. 1711-1720, University of British Columbia, Vancouver 2005.
19. Kloužková A., Hanykýř V., Vokáč M., Bouška P. in:
Objemové změny pórovité keramiky. p. 56-68, ed. Bouška P., Kloužková A., Silikátový svaz, Prague 2009.
20. Hanykýř V., Kloužková A., Bouška P., Vokáč M.: Acta Geodyn. Geomater. 6, 59 (2009).
21. Zemenová P., Kloužková A., Kohoutková M.: J. Process. Appl. Ceram. 6, 59 (2012).