PRINT ISSN 2284-7995, E-ISSN 2285-3952
305
ECONOMIC GROWTH OF THE AGRICULTURAL SECTOR OF
MOLDOVA COMPARED TO CENTRAL AND EASTERN COUNTRIES
OF EUROPE
Aliona ARGO
Financial Banking College, Chisinau, Republic of Moldova, 26/2 M.Costin Street, 2068, phone: (+373)069232743; e-mail: [email protected]
Corresponding author: [email protected]
Abstract
The main opportunities for the development of the national economy of the Republic of Moldova are closely related to the development of the agricultural sector. The agricultural sector remains a priority for Moldova because 30% out of the population are employed in this area, 75% of the country surface is agricultural land, and agriculture holds 13% of GDP. With these indicators, the agricultural sector can not be neglected. Undoubtedly our main effort should be directed towards the recovery of agriculture and increase the living standards of people from rural areas. It is necessary to review the huge opportunities for agricultural growth and rural areas by using both adequate investments and updating rural development strategies. Agriculture remains one of the most important
sectors with huge possibilities and an unjustly neglected sectors.
Key words: agricultural sector, economic growth, economic development,GDP growth
INTRODUCTION
Any economic change, moreover in the agricultural sector, has as a purpose the development of the national economy, in other words the economic growth. Market economy gives priority to business enterprises, regardless of the branch of the economy it belongs to. The results obtained show positive or negative sides of the national economy, the national economy is viable if it can stimulate the organization and development of profitable business.
Economic growth, living standards increase, new investments, export promotion have become subjects of primary interest for the agricultural sector of Moldova, due to the country's agrarian character.
MATERIALS AND METHODS
As informative sources in the present process of investigation some information from Ministry of Agriculture and Food Industry, Intervention Agency and Payments of Agriculture, Financial Ministry, financial reports of National Bank and other economical- financial structures from the country and abroad were used. The basic methods of research used are analysis and synthesis, economical
comparison and statistic method.
RESULTS AND DISCUSSIONS
Reorganization implemented last decade in the agricultural sector is tough and progresses heavily. The results received are positive and negative, meanwhile the tasks are huge, taking into consideration challenges caused by European Union adherence.
Moldova is rich in natural resources necessary for agriculture, with fertile soils in most districts of the country. Although being a small country, Moldova is an agricultural giant compared to many European countries.
Fig.1.The area of agricultural land out of the total area of the state
Source: Data provided by http://data.worldbank.org and http://en.worldstat.info
PRINT ISSN 2284-7995, E-ISSN 2285-3952
306
Cencus in 2011, Moldova with over 2,2 million hectares of agricultural lands just 1,9 mln. ha (87%), are used as agricultural land. Reporting the utilized agricultural area to the total area of the state we can say that Moldova has significant agricultural resources in Central and Eastern Europe with strong agricultural neighbours such as Romania and the Ukraine. Utilised agricultural area of Romania decreased by 4.5% between 2003 and 2010 and is 13.3 million hectares (61.8%). Italy with 12.88 million hectares is behind Romania. France is farther than Romania (27 mln.), Spain (23.7 mln.), Germany (16.7 mln.) and Poland (14.38 million.).
The number of farms in Moldova is 32% higher than in Germany (299,100 farms) 56% more than in France (514,800), while in Bulgaria the number of farms is 371.000 and and 577.000 in Hungary. Romania, the country with the highest number of farms in the European Union (EU) in 2010 had 3.86 million agricultural holdings, which represented one third of the total at Community level. The number of farms in Romania decreased by 14% between 2003 and 2010, while in EU the decline was about 20% or around 12.05 million, according to Eurostat. The average area of one farm in the Republic of Moldova is 2.2 ha, including individual farms - 247.9 ha, and those without- 0.8 ha. This average is well below the average of farms in EU-25, which is about 16.0 ha.
Although agriculture is still important the number of employees in this sector states a decline. Since 2009, the number of people employed in agriculture has remained the same approximately 320-350.000 people and the main reason that caused people to remain in the sector was increasing the prices to agruculrural products and recently improved trades conditions.
The labour employment rate in agriculture shows a down tendency in Central and Eastern Europe. According to the survey conducted by Eurostat in agricultural sector of EU 11.3 million employed people are over 15 years old which constitutes 5.2% of the total number of employees. Although employment in the Romanian agriculture is still one of the largest in Europe, the number of labour people in
agriculture area is decreasing slowly from 42% in 2000 to 28% in 2012(2,42 million people). Other European countries with the greatest agricultural working potential are Poland (19.1% out of total EU-28) decreased by 7% between 2000-2012, Latvia (7%), Bulgaria (7%) Slovakia (-4%).
Dinamica ponderii angajaților (%) din sectorul agrar
51 5 19 5 2 13 42
6 4 7 15
7 7 30,5
4 13
3 1 6 28
5 4 5 8 3 5 0 10 20 30 40 50 60 R e p u b li c a M o ld o v a It a li a P o lo n ia C e h ia B e lg ia B u lg a ri a R o m a n ia A u s tr ia O la n d a U n g a ri a L e to n ia S lo v a c ia E s to n ia 2000 2012
Fig. 2. Share of employees agricultural sector,% of the population (2012)
Source: Prepared by author based on data from the World Bank http://data.worldbank.org/indicator/
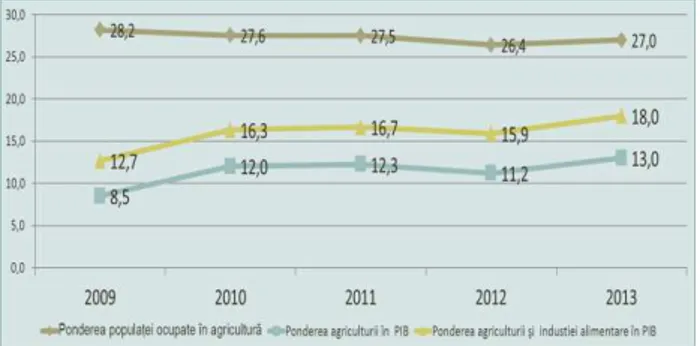
The agricultural sector has been and continues to be the cornerstone of the national economy representing over 50% of the national economy. The contribution of agriculture in GDP creation in the last five years is about 12% and overall industry processing agricultural raw materials, contributes over 25% to GDP and creates approximately 40% of total exports. The period between 2000 and 2011 has shown an average annual growth of 5% of GDP. The most significant influence on GDP growth had the value added in goods -4.5 %in agriculture out of total 5.5 %
Fig. 3. Share of agriculture in GDP
SourcОμ It’s ОlaboratОd bв tСО author on the basis of information from National Bureau of Statistics
PRINT ISSN 2284-7995, E-ISSN 2285-3952
307
agricultural businesses in the Republic of Moldova is much higher than the share of agriculture in the global economy, which is somewhere in the 3 to 3.5% of world GDP. In spite of considerable weight,the agriculture Moldova offered a limited support to economical growth in the last five years. The influence of the weather conditions severely limited the contribution of GDP in Moldova. The role of agriculture in GDP declined in all Eastern European countries with an average of 10% in the last decade.This is not caused by the abridgment of business in agriculture, but it was caused by a slower growth than in other economical domains.
In the European Union (EU), according to the data provided by World Bank in 2012, the best in GDP was Bulgaria (6.4%), followed by Romania (6%), Croatia (5%), Latvia (4,4%). Moldovan agriculture demonstrates unstable growth which is much slower than in other sectors of the economy. One of the main reasons is the dependence of agriculture on natural conditions - drought has recently become a common destructive factor. Crop production is highly vulnerable to climate conditions: drought years 2007, 2009 and 2012, had a fatal effect on most crops.
Agricultural production incertitude is due to high risks in agriculture and underdeveloped tools for limiting them, dependence on climate conditions, irrigation systempoor developed, low application of modern agricultural technologies and lack of new inventions in agriculture, such as index-based insurance programs for weather risks. Another reason that leads to agricultural production lagging is linked to the economic crisis, high prices of fertilizers, fuels, technologies and agricultural machines. This created difficult conditions for farmers and the development of agriculture as a whole.
Netherveless in 2013 agriculture achieved an economical growth of 8%, in tis way providing more than half of the total rise. The influence agriculture on economic growth in 2013 was 38%. The agricultural sector is the main area in Moldova, for the role it has in the national economy and the social role of it. Agriculture contributes significantly to the GDP
respectively, reduces gross value added in agriculture is critical for GDP growth.
Between 2008 and 2011 a slight increase in GVA was kept created by agriculture. In 2012 the gross value added in the goods sector declined by 10.7% compared with 2011, due to significant reduction in gross value added in agriculture and fishing, 23.3%, which is 10.9% of GDP. In 2013 a significant increase in agriculture was recorded, hunting and forestry; fishing to 41.0% compared to 2012. Gross value added in agriculture, hunting, forestry which was over 52,2% achieved in 2012 and GDP encreased with 12,9%.
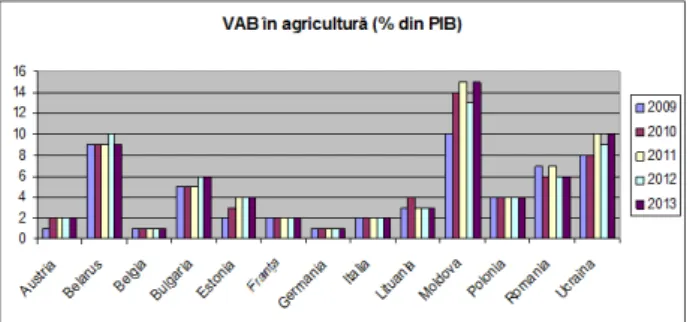
Fig. 4. Gross value added in agriculture
Source: Data provided by http://data.worldbank.org
We can see that the Moldovan agriculture has the largest share of national GVA compared to the countries of Central and Eastern Europe, despite the low level of productivity in the field. This is due to the high share of agriculture in the national GDP and high employment share in this sector.
The agricultural sector continues to have a
substantial growth potential, yet
underestimated, agricultural restructuring and revitalization of the rural economy represen major trends of economic development of the country.
According to a study of INSEE the French agriculture although highly developed lost about 5.4 of GVA growth and decreased from 7.9% in 1970 to 1.8% in 2013.
PRINT ISSN 2284-7995, E-ISSN 2285-3952
308
2013.
Value added in Romanian agriculture is half of EU -15, which leads to total agricultural production of about 1400-1500 euro / ha in Romania, comparing with 2400 to 2600 euro / ha in the EU-15.
Official statistics shows that Belgium is the country with the highest rate of added valur per farm worker, $ 10,904/farm worker in 2013 compared to 2009, followed by France with $ 7,982, Italy with $ 5,869 and Austria with $ 5,130. In Moldova, the GVA is $ 1,031 / farm worker for the same period.
According to the analyzed data the contribution of agricultural sector to GVA in accounted 15.52% in 2013, recording an increase of 2.32 times compared to 2008, or 232.68%.
This contribution is due to the steady increase in the value of agricultural production, besides 2012 which was highly unfavorable for agriculture.
Table 1. Changes in the value of agricultural output in GDP
Indicators 2009 2010 2011 2012 2013 Average
annual growth GDP, mln. lei 60430 71885 82349 88228 100311 7976,2 % from the
previous
94,0 107 106,8 99,3 108 2,8
The value of industrial production,mln . Lei
22643 28140 34194 36362 38066 2402,9
% from the previous
78,9 109,3 109,5 98,1 106,8 5,58
The value of agricultural production, mln. Lei
13300 19873 22619 19922 24472 2234,4
% from the previous
90,4 107,9 105 77,7 138,3 9,58
SourcОμ It’s ОlaboratОd bв autСor on tСО basТs oП
information of National Bureau of Statistics
Value of agricultural production rise in GDP between 2009 and 2013 was averaged 9.58% annually. In 2013 it increased by 47.9%.
In 2013 the share of crop production in total agricultural production increased by 10% compared to 2012 which is 72% out of of the grain and vegetables - 29.0% (11.0% more than in 2012), technical culture - 17.6% (14.5% in 2012), potatoes, vegetables and melons - 8.0% (0.7% decrease from 2012), fruit, nuts and berries - 5.4% (6 7% in 2012), grapes - 9.1% (1,3% less than in 2012).
Analyzis of the global crop evolution in all
household categories in Moldova,
anagricultural production decrease is seen in 2012 comparin with the previous year with 2,356 million lei, and in 2006 the increase amounted 6520 million lei.
Table 2. Evolutionary aspects of global crop production
in all categories of households of Moldova
Indicators Years
2007 2008 2009 2010 2011 2012
Agricultural production mil. lei
12825 16503 1330 19873 22619 20263
Including: Plant production mil. lei
7941 10600 7861 13616 15751 11346
Livestock production mil. lei
4509 5519 4987 5786 6347 8417
Absolute deviation of crop production, mii lei
-1138 2659 452 471 521 500
Index (+,-) plant production, %
87 133 74 173 116 72
% of crop production in agricultural production
61,92 64,23 59,11 68,52 69,64 55,99
% of livestock production in crop production
35,16 33,44 37,5 29,11 28,06 41,54
Source: It’s ОlaboratОd bв autСor on tСО basТs oП
information of National Bureau of Statistics
As a result the crop production was reduced with 4405 milllion lei in 2012 compared to 2011, but there is an increase in 2006 with 2267 million lei (24,97%) and animal raising decreased in 2012 compared with 2011 with 32.61%, whilst being doubled with 4139 million lei (2006).
PRINT ISSN 2284-7995, E-ISSN 2285-3952
309
the actual volume change because it does not take into account the inflation.
Crop production in 2013 over the previous year was due to the increase of the average crops. Thus, the average products per hectare of maize increased by 2.5 times, soy - 1.9 times, sunflower and sugar beet - 1.8 times of each, wheat - 1.7 times, barley - 1.6 times, potatoes - 1.3 times.
So, in 2013 the share of production of agricultural enterprises was 44% (in 2012-35% in 2011 to 32%). Agriculture in Central and Eastern European countries is primarily a family activity (approximately 77.8% of workers). For example, in Poland, family farming is 97.02% out of the work done in agriculture, in France (51.58%), Hungary (90.45%) and Romania (97.04%). In Germany, individual and proper farms have 94.3% out of the total number of farms and covers 68.9% of the agricultural area. Approximately 4.0% of the farms are organized as partnerships.
Sales analysis of agricultural products is essential for assessing the role of the agriculture in the national economy and its market position. The table below reflects the progress achieved in sales between 2005-2013
Table 3. The evolution of sales revenue in the agricultural sector (mln. lei)
2006 2007 2008 2009 2010 2011 2012 2013 a.2013ă înă % / a.2006
Total sales 117 149 175 146 178 190 212 232 +197,3
Agricultur e sales
4,1 4,2 5,6 4,8 7,0 7,4 7,2 8,9 +215,46
%, of total sales
3,53 2,81 3,22 3,28 3,95 3,93 3,42 3,85 +0,32 p. p
SourcОμ It’s ОlaboratОd bв tСО autСor on tСО basТs oП
information of National Bureau of Statistics
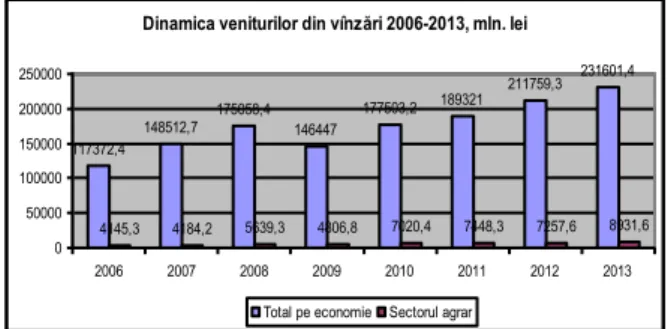
According to the data presented in Table 3 we can conclude that the growth rate of sales revenue in the agricultural sector is almost always twice lower than the average in our country. As a result, the share of these overall total national income remains virtually unchanged, showing slight growth + 0,32 pp during the last 8 years. Also, in this period, for example, the revenue from sales of commercial enterprises (both wholesale and retail) increased from 42.5% in 2,007 representing 63,045.1 million to 82101.3 million lei or 46.3% in 2013. Annual growth rate of sales
revenue as the national economy in general and the agricultural sector in particular, is reflected in the figure below.
Dinamica veniturilor din vînzări 2006-2013, mln. lei
117372,4 148512,7
175058,4 146447
177503,2 189321
211759,3 231601,4
4145,3 4184,2 5639,3 4806,8 7020,4 7448,3 7257,6 8931,6 0
50000 100000 150000 200000 250000
2006 2007 2008 2009 2010 2011 2012 2013 Total pe economie Sectorul agrar
Fig. 5. Dynamics of income from selling agricultural products, 2006-2013
Source: Prepared by the author based on NBS
About 40 percent of these sales is sales revenue for their agricultural products. The largest increases in income have registered SMEs specializing in agriculture - 6.1 million lei in 2013, up from 1.2 million the previous year.
Table 4. Dynamics profit from sale of plant and animal agricultural enterprises in Moldova during 2005-2013
No. agric. enterprise
No. profitable agric. firm
% profit agric. firm
Profit of sale of agricult. products, thd lei
The growth rate of profit to one firm total for 1
enterprise a fixed base
a mobile base
2005 1524 785 51,6 464178 304 100 -
2006 1522 765 50,1 436355 286,7 94,3 94
2007 1528 894 58,5 455741 298,3 98,1 104
2008 1527 1021 66,8 864025 565,8 186,1 189 2009 1575 736 46,7 270137 171,5 56,4 30,3 2010 1580 1149 72,7 985088 623,47 205 363 2011 1536 1110 72,3 132394 861,94 283,5 138 2012 1486 692 46,6 - 57832 - 38,91 - 12,8 - 4,5
SourcОμ It’s ОlaboratОd bв tСО autСor on tСО basТs oП
information of Statistical Yearbook
PRINT ISSN 2284-7995, E-ISSN 2285-3952
310
and Food, which performs the administration and management of the funds for farmers. Agricultural income in Central and Eastern Europe experienced recently both positive and negative changes. The latest changes between 2011 and 2012 show that the index of agricultural income per unit of output rose by more than a quarter (27.8%) in Belgium, but decreased a lot in Romania (-27.1%), Croatia, Slovenia and Poland (from -10% to - 14%). Agriculture's contribution to value creation and GDP respectively, a function of two important factors: the number of workers and labor productivity.
As lowers employment in agriculture, productivity increases. In our view, given that the potential for land expansion will soon be exhausted, continuing agricultural growth will have to come from increased productivity. In most cases, the differences between the national average and productivity in agriculture are based on structural causes.
In general, however, the contribution of agriculture to total gross value added in the economy is apparently lower due subsistence and employment and consumption patterns in the various countries. The background to
reduce the number of employees, the main sources of growth remain productive capital and total factor productivity, both improved slightly in recent years.
CONCLUSIONS
Undoubtedly our main effort must be directed to the recovery of agriculture and raising the living standards of people living in the rural areas. It is necessary that all opportunities for agriculture growth and rural areas to be reviewed and used both by adequate investments and the development or updating of integrated rural development strategies. Moldovan agriculture remains one of the sectors with the most significant growth potential and one of the unjustly neglected sectors. Thus, knowledge of the mechanisms of intervention in the agricultural sector policy development and effective use of agricultural practices of the developed countries is a necessary prerequisite to build a proper market economy.
REFERENCES
[1]Statistical Yearbook, 2005-2013
[2]National Bureau of Statistics, www.statistica.md [3]http://data.worldbank.org
[4]http://en.worldstat.info
[5]http://data.worldbank.org/indicator/ [6]www.aipa.md