Developmentally Regulated Epigenetic Profile of the
Human Beta-Globin Locus
Joanne Miles1, Jennifer A. Mitchell1, Lyubomira Chakalova1, Beatriz Goyenechea1, Cameron S. Osborne1, Laura O’Neill2, Keiji Tanimoto3, James Douglas Engel3, Peter Fraser1*
1Laboratory of Chromatin and Gene Expression, The Babraham Institute, Babraham Research Campus, Cambridge, United Kingdom,2Institute of Biomedical Research, The Medical School, University of Birmingham, Birmingham, United Kingdom,3Department of Cell and Developmental Biology, University of Michigan Medical School, Ann Arbor, Michigan, United States of America
Several lines of evidence have established strong links between transcriptional activity and specific post-translation modifications of histones. Here we show using RNA FISH that in erythroid cells, intergenic transcription in the humanb-globin locus occurs over a region of greater than 250 kb including several genes in the nearby olfactory receptor gene cluster. This entire region is transcribed during S phase of the cell cycle. However, within this region there are,20 kb sub-domains of high
intergenic transcription that occurs outside of S phase. These sub-domains are developmentally regulated and enriched with high levels of active modifications primarily to histone H3. The sub-domains correspond to theb-globin locus control region, which is active at all developmental stages in erythroid cells, and the region flanking the developmentally regulated, active globin genes. These results correlate high levels of non-S phase intergenic transcription with domain-wide active histone modifications to histone H3.
Citation: Miles J, Mitchell JA, Chakalova L, Goyenechea B, Osborne CS, et al (2007) Intergenic Transcription, Cell-Cycle and the Developmentally Regulated Epigenetic Profile of the Human Beta-Globin Locus. PLoS ONE 2(7): e630. doi:10.1371/journal.pone.0000630
INTRODUCTION
Far more transcription takes place in the cell nucleus than can be accounted for by protein-coding gene transcription alone[1–5]. Transcriptome studies have revealed a plethora of non-coding RNAs, some of which have been implicated in diverse regulatory processes such as dosage compensation, genomic imprinting and RNAi. However, most non-genic transcripts seem to fall into a category characterized by several studies investigating intergenic transcription[6]. Intergenic transcripts are often produced from regions flanking active genes and their long-range regulatory elements. Their occurrence in correlation with gene activity and chromatin structural alterations, suggests a role in the regulation of gene expression. Such intergenic transcription has been most extensively studied in theDrosophilabithorax complex and human
b-globin loci. In the bithorax complex it has been suggested that intergenic transcription plays a role in initiating activation of the locus[7] and in regulating cellular memory[8]. Intergenic transcription has also been proposed to be involved in regulation of the major histocompatibility complex locus[9], the human growth hormone locus[10] the IL4 locus[11], the IL10 gene cluster[12], regulating chromatin accessibility during VDJ re-combination[13], and in regulating probability of choice of X chromosome inactivation[14]. Thus intergenic transcription is common and may be a part of varied mechanisms for the regulation of gene expression in eukaryotes.
In the humanb-globin locus intergenic transcripts can be found throughout the locus in erythroid cells[15,16] at very low abundance relative to gene transcripts. RNA FISH (fluorescent
in situ hybridisation) showed that intergenic transcripts are only detected in a proportion of cells in an unsynchronized population. They appear to be generated in a cell-cycle-dependent manner; detectable predominantly during G1 phase with a small percent-age of loci showing RNA FISH signals in early S-phase[16]. The highest percentage of loci with positive signals are detected with probes homologous to the DNase I sensitive sub-domains containing the locus control region (LCR) and active adult b
-globin genes (HBD, haemoglobin delta; HBB, hemoglobin beta). Deletion of a 2.5 kb region containing the putative adult sub-domain intergenic promoter results in a sub-sub-domain-wide failure to adopt the characteristic DNase I sensitive chromatin confor-mation during development, and an abnormally low and variegated expression of the adultHBBgene[16,17]. These results suggest that intergenic transcription could play a role in decondensation of chromatin domains and gene activation.
Genome scale studies have revealed that histone H3 di- and tri-methylation on lysine 4 (H3K4me2, H3K4me3) as well as H3 and H4 hyperacetylation (H3ac and H4ac, respectively) are enriched in the regions surrounding active genes[18–20]. Tri-methylation on H3K4 correlates most strongly with the promoter regions of expressed genes, often residing within 1 kb of the transcription start site. Hyperacetylation of both H3 and H4 also correlate with promoter regions while di-methylation on H3K4 occurs across wider regions in the vicinity of active genes. In contrast to the punctate patterns of H3K4 methylation detected in most active regions, several of theHoxclusters contain large domains of enriched H3K4 methylation encompassing multiple genes and their flanking sequences. Hox H3K4 methylated domains appear to be tissue-specific and correlate significantly with intergenic transcription[19].
Academic Editor:Edith Heard, Institut Curie, France
ReceivedApril 23, 2007;AcceptedJune 16, 2007;PublishedJuly 18, 2007
Copyright:ß2007 Miles et al. This is an open-access article distributed under the terms of the Creative Commons Attribution License, which permits unrestricted use, distribution, and reproduction in any medium, provided the original author and source are credited.
Funding:This work was supported by the Medical Research Council and the Biotechnology and Biological Sciences Research Council UK.
Competing Interests:The authors have declared that no competing interests exist.
A complex pattern of histone modifications has been detected in the human and mouse b-globin loci[21–26]. Collectively, these experiments have suggested a correlation between H3 and H4 acetylation and H3K4 methylation modifications associated with active genes, and DNase I hypersensitivity sites in the LCR as well as areas of high general DNase I sensitivity. Here we present a high-resolution, locus-wide analysis of intergenic transcripts and histone modifications across the humanb-globin locus during development in yeast artificial chromosome (YAC) transgenic mice and in primary human erythroid cells. We show that the intergenic transcription pattern is complex and extensive and that active histone modifica-tions strongly correlate with areas of non-S phase intergenic transcription linking the cell-cycle-specific timing of intergenic transcription with large chromatin domains of modified histones.
RESULTS
Intergenic transcription throughout the human
b
-globin locus
We previously identified regions of intergenic transcription in the human b-globin locus in transgenic mice via RNA FISH[16]. Though rather crudely mapped, regions of increased intergenic transcription corresponded to domains of increased general DNase I sensitivity. To verify our FISH data and obtain higher resolution
we used quantitative real-time reverse transcription PCR (RT-PCR) with several primer pairs encompassing nearly all of the non-repetitive, non-genic sequences across the entire b-globin locus. Total RNA was prepared for analysis from embryonic day E11.5 red cells and adult anemic spleen from transgenic 264W which contains a single copy humanb-globin locus YAC[27].
The results show that at both stages of development the LCR is transcribed (Figure 1), consistent with our previous RNA FISH findings in which a relatively large percentage of loci were positive for transcript signals in this region. The abundance of LCR transcripts appears to be greater in embryonic blood cells compared to adult anemic spleen cells, which may reflect the fact that embryonic blood is composed of nearly 100% erythroid cells, whereas adult anemic spleen is 80–90% erythroid. However, we cannot rule out the possibility, and in fact the data suggest, that the intergenic transcription pattern in the LCR region may change during development. This is consistent with the LCR’s role as a complex regulatory region[28,29] with many intergenic promoters[30–33]. In embryonic cells intergenic transcript levels are high throughout the majority of theecdomain whilst relatively low in the db domain. The region of low transcript levels immediately upstream of the GBE (hemoglobin epsilon) gene suggests that the majority of LCR transcripts are not contiguous withecdomain transcripts.
Figure 1. Distinct domains of intergenic transcription in the humanb-globin locus are developmentally regulated.Intergenic transcription in the human b-globin locus in 264W transgenic mice measured by quantitative RT-PCR. Total RNA was prepared from erythroid tissues at two developmental stages – E11.5 embryonic blood (Embryonic) and adult anemic spleen (Adult). cDNA was produced and quantified by real-time PCR using primer pairs across the humanb-globin locus. Bar plots represent relative transcript quantities normalised to the most 59primer pair in the olfactory receptor gene region, which shows low levels of transcription at both developmental stages. Primer pair positions are relative to theHBE
gene transcription start site at position 1; they are aligned with a map of the locus shown below the graphs. Shaded regions of the graphs correspond to the locus control region (LTR promoter to downstream of LCR HS1) and thedbdomain (dbintergenic promoter to 39HS1). Map features: red arrowheads, globin genes; pink rectangle, b-like pseudogene; white arrowheads, olfactory receptor genes (HOR, human olfactory
receptor); vertical blue lines, hypersensitive sites; blue arrows, intergenic transcription start sites; LTR, long terminal repeat;db, dbintergenic promoter.
doi:10.1371/journal.pone.0000630.g001
In adult cells transcript levels in theecdomain are reduced whilst the LCR and db domains are relatively highly transcribed. The exceptions to this pattern are the regions immediately upstream and downstream of thedbpromoter where similar levels are seen at both stages of development. In addition to sense transcription in this region, strand-specific RT-PCR detects significant levels of antisense transcription, which appears to initiate somewhere downstream of thedbpromoter and terminate somewhere in the vicinity of theb -like pseudogene (unpublished observations). These data showing high levels of intergenic transcription in the LCR and thedbdomain in adult cells are consistent with our RNA FISH data in which a larger percentage of cells displayed RNA FISH signals in these regions, compared to theecdomain[16].
Developmentally regulated histone modifications in
the
b
-globin YAC transgene locus
To compare histone modifications within the human b-globin locus to levels of intergenic transcription we assessed the pattern of histone modifications across the human b-globin locus in the 264W line using native chromatin immunoprecipitation (ChIP) on erythroid cells from E11.5 embryonic blood and adult anemic spleen. We sought to generate a high-resolution map of active histone modifications in the humanb-globin locus in transgenic mice. In E11.5 embryonic blood, the LCR and theecdomain are highly enriched for histone H3K4 tri-methylation and histone H3 hyperacetylation (Figure 2, top and middle panel). Conversely, the dbdomain is relatively devoid of these histone modifications. The 59and 39boundaries of enrichment for these active modifications occur near the long terminal repeat (LTR) promoter upstream of hypersensitive site 5 of the LCR (HS5) and the region upstream of the db intergenic promoter. This H3K4me3 and H3ac domain correlates well with the domain of increased intergenic transcrip-tion at E11.5 (Figure 1, top panel). In contrast to H3K4me3 and H3 hyperacetylation, H4 acetylation appears to be moderately enriched across the entire locus and does not appear to follow the same domain structure (Figure 2, bottom panel).
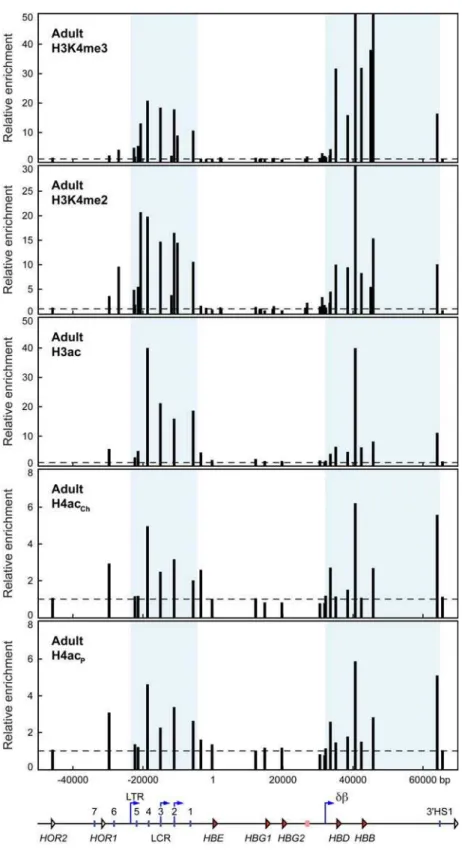
In adult anemic spleen we took advantage of the hugely increased numbers of available erythroid cells and used additional antibodies against di-methylated H3K4 and penta-acetylated H4 (H4acp) in addition to those above. The results show that the histone modification profile in adult erythroid cells is dramatically different compared to E11.5 cells. The LCR and thedbdomain are highly enriched for H3K4me3, H3K4me2 and H3ac (Figure 3), while theecdomain lacks these histone modifications. The presence of these histone modifications in the LCR and db domains correlates with increased intergenic transcription in these regions in adult cells (Figure 1, bottom panel) and increased general sensitivity to DNase I [16]. A sub-domain pattern of H4 acetylation is discernable with both H4 antibodies (Figure 3) but appears to be less well defined compared to H3 modifications, as in embryonic cells. The LCR and db sub-domains do appear enriched for H4 acetylated chromatin over the inactiveecdomain and the upstream olfactory receptor gene (ORG) region.
Histone modification profile of the endogenous
b
-globin locus in primary erythroid precursor cells
The human b-globin locus has been studied extensively in transgenic mice. Despite the fact that theb-globin genes are fully expressed and the locus is developmentally regulated in transgenic mice there have been noticeable differences in the way the human locus is regulated in mice. We were therefore interested in characterising the epigenetic profile in the endogenous humanb -globin locus at high resolution. Studying the locus in its endogenouschromosomal location provided the additional advantage of extending our analyses further into the 59ORGregion. We obtained nucleated, buffy coat cells from human peripheral blood from a local blood bank and used the two-step liquid culture system [34,35] to generate large quantities of adult erythroid precursor cells. We previously showed by RNA FISH that upon maturation, these cells transcribe primarilyHBBwith a small percentage of loci (approxi-mately 10%) positive forHBG(hemoglobin gamma) transcription[6]. We used the same antibodies as in the adult anemic spleen transgenic studies above (Figure 4).
As in the transgenic mice, there are clearly detectable domains of active histone modifications in the LCR and db domains indicating that in general the adultb-globin transgene locus has a domain structure similar to the endogenous b-globin locus. However, notable exceptions are the increase in active histone modifications in the region upstream of thedbpromoter to theb -like pseudogene region. This is apparent for both H3K4me2 and H3K4me3 as well as H3ac and H4ac. This corresponds roughly to the areas of antisense intergenic transcription seen in transgenic mice (unpublished observations). Antisense transcription in this region has also been detected in primary erythroid precursor cells[25]. Also noteworthy is the fact that theecdomain and region upstream of theb-globin locus containing the olfactory receptor gene cluster have low levels of acetylated histones.
Intergenic transcription through the olfactory
receptor gene cluster in erythroid cells
Analysis of ESTs and mRNAs in the vicinity of theb-globin locus has shown a number of spliced non-coding transcripts with 59 exons far upstream of theb-globin locus and extending into theb -globin locus[36]. Many of these transcripts initiate within a 50 bp region within an LTR-like element located just downstream of the
UBQLN3 gene, located approximately 236 kb upstream of the
HBE gene (Figure 5A and B). We decided to investigate transcription across this region in greater detail using RNA FISH. We performed double-label RNA FISH in human primary cultured erythroid cells obtained from the two-step liquid culture system described above. We used single-stranded HBB intron probes and single-stranded probes to various regions in theORG
cluster andb-globin locus (Figure 5C).HBBintron probes detect gene transcription signals at 90–95% ofb-globin loci in erythroid cells, and therefore serve as an excellent internal control to identify
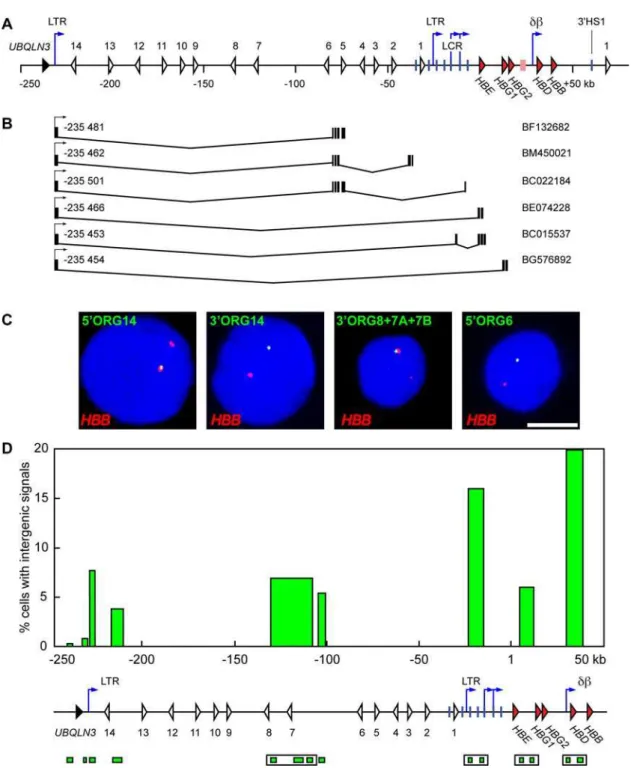
HBBexpressing erythroid cells and to mark the position of theb -globin locus in the nucleus. RNA FISH with probes immediately 59or 39of theUBQULN3gene, upstream of the -236 LTR, detect little or no transcription signals (Figure 5D). In contrast, probes to the region immediately downstream of the -236 LTR detects significant sense transcripts (7% of loci; p,0.05) (Figure 5D). Similar percentages of positive loci are detected with other probes in the ORG region. These results show that the most 59 tran-scription start site of sense trantran-scription in the ORG cluster is located in the vicinity of the -236 LTR element in primary erythroid cells in agreement with the results of Xianget al.[36] and EST databases. Probes in the LCR and db sub-domains detect intergenic transcript signals in three- to five-fold more loci (16– 20% versus 4–8%) than theORGprobes (Figure 5D), consistent with our previous data in transgenic mice[16] and the RT-PCR data above showing higher levels of RNA transcripts in these regions. Probes in theecdomain detect signals at approximately 6% of loci in adult erythroid cells, consistent with our earlier observations in transgenic mice. These results show that the percentage of loci in which transcription is occurring in theORG
(LCR anddb) detect transcription at significantly more loci. Thus, domains of high or frequent intergenic transcription in the human
b-globin locus correlate strongly with chromatin domains of highly modified chromatin.
Cell cycle specificity of transcribed domains in the
human
b
-globin locus
We previously observed that intergenic transcription is cell-cycle regulated occurring predominantly in G1 phase, but also with a minority of cells showing signals in S phase of the cell cycle[16].
We had previously noted transcription in the ORG cluster in erythroid cells derived from human cord blood using RNA FISH probes homologous to a region upstream of the LCR (Gribnau and Fraser, unpublished). However, the transcription signals in this region were unusual. Only a small fraction of cells had signals and many of them appeared as doublets suggesting that the region had been duplicated, indicating that transcription in this area occurs preferentially in S-phase cells[16]. Therefore, we consid-ered the possibility that not only intergenic transcription occurs during restricted stages of the cell cycle, but that different regions are transcribed at different stages. We were interested to determine Figure 2. Histone modifications throughout the humanb-globin locus in embryonic cells reflect intergenic transcription patterns.Histone modifications in the humanb-globin locus in embryonic blood cells from 264W transgenic embryos assayed by ChIP. Chromatin from E11.5 embryonic blood cells was immunoprecipitated with antibodies specific for trimethylated lysine 4 of histone H3 (H3K4me3), acetylated histone H3 (K9/14,H3ac), and acetylated histone H4 (ChIP grade antibody, K5/18/12/16,H4acCh). The fold-enrichment of antibody-bound sequences over input
was analysed by real-time PCR using primer pairs across theb-globin locus. Bar plots represent enrichment normalised to the most 59primer pair in the olfactory receptor gene region, which shows low enrichment for all antibodies; horizontal dashed lines mark the level of the normalisation data point (value 1). Primer pair positions are relative to theHBEgene transcription start site at position 1; they are aligned with a map of the locus shown below the graphs. Shaded regions of the graphs correspond to the locus control region (LTR promoter to downstream of LCR HS1) and thedb domain (dbintergenic promoter to 39HS1). Map features: red arrowheads, globin genes; pink rectangle, b-like pseudogene; white arrowheads, olfactory receptor genes (HOR, human olfactory receptor); vertical blue lines, hypersensitive sites; blue arrows, intergenic transcription start sites; LTR, long terminal repeat;db,dbintergenic promoter.
doi:10.1371/journal.pone.0000630.g002
Figure 3. Histone modifications throughout the human b-globin locus in adult cells reflect intergenic transcription patterns. Histone modifications in the human b-globin locus in 264W transgenic adult erythroid cells assayed by ChIP. Chromatin from anemic spleen was immunoprecipitated with antibodies specific for trimethylated lysine 4 of histone H3 (H3K4me3), dimethylated lysine 4 of histone H3 (H3K4me2), acetylated histone H3 (K9/14,H3ac), and acetylated histone H4 (two different antibodies: ChIP grade antibody, K5/18/12/16,H4acCh; penta lysine, H4acP). The fold-enrichment of antibody-bound sequences over input was analysed by real-time PCR using primer pairs across theb-globin locus. Bar
plots represent enrichment normalised to the most 59primer pair in the olfactory receptor gene region, which shows low enrichment for all antibodies; horizontal dashed lines mark the level of the normalisation data point (value 1). Primer pair positions are relative to theHBEgene transcription start site at position 1; they are aligned with a map of the locus shown below the graphs. Shaded regions of the graphs correspond to the locus control region (LTR promoter to downstream of LCR HS1) and thedbdomain (dbintergenic promoter to 39HS1). Map features: red arrowheads, globin genes; pink rectangle,b-like pseudogene; white arrowheads, olfactory receptor genes (HOR, human olfactory receptor); vertical blue lines, hypersensitive sites; blue arrows, intergenic transcription start sites; LTR, long terminal repeat;db,dbintergenic promoter.
Figure 4. Histone modifications throughout the humanb-globin locus in primary erythroid precursor cells.Histone modifications in the humanb -globin locus in human primary erythroid precursor cells assayed by ChIP. Chromatin from erythroid precursor cells was immunoprecipitated with antibodies specific for trimethylated lysine 4 of histone H3 (H3K4me3), dimethylated lysine 4 of histone H3 (H3K4me2), acetylated histone H3 (K9/14, H3ac), and acetylated histone H4 (two different antibodies: ChIP grade antibody, K5/18/12/16,H4acCh; penta lysine,H4acP). The fold-enrichment of
antibody-bound sequences over input was analysed by real-time PCR using primer pairs across theb-globin locus. Bar plots represent enrichment normalised to the same primer pair in the olfactory receptor gene region as in previous figures (second from left to right; an additional primer pair upstream of the normalisation point is included in this experiment). Horizontal dashed lines mark the level of the normalisation data point (value 1). Primer pair positions are relative to theHBEgene transcription start site at position 1; they are aligned with a map of the locus shown below the graphs. Shaded regions of the graphs correspond to the locus control region (LTR promoter to downstream of LCR HS1) and thedbdomain (db intergenic promoter to 39HS1). Map features: red arrowheads, globin genes; pink rectangle,b-like pseudogene; white arrowheads, olfactory receptor genes (HOR, human olfactory receptor); vertical blue lines, hypersensitive sites; blue arrows, intergenic transcription start sites; LTR, long terminal repeat;db,dbintergenic promoter.
doi:10.1371/journal.pone.0000630.g004
Figure 5. Non-coding transcripts originate 230 kb upstream of theb-globin locus.(A) A schematic representation of the humanb-globin locus. Red arrowheads, globin genes; pink rectangle,b-like pseudogene; white arrowheads, olfactory receptor genes; black arrowhead,UBQLN3 gene;
vertical blue lines, hypersensitive sites; blue arrows, intergenic transcription start sites; LTR, long terminal repeats; db, dbintergenic promoter; coordinates in kilobases (kb) are relative to theHBEgene transcription start site at position 1. (B) ESTs originating from the LTR promoter 235 kb upstream of theegene. Intervening spliced regions are depicted along with the location of exons. Coordinates (in base pairs) of the start sites (arrows) are indicated; NCBI Nucleotide database accession numbers are shown on the right. (C) RNA FISH analysis of intergenic transcription in the 59 olfactory receptor gene cluster region in human primary erythroid precursor cells. Intergenic transcription signals are detected in green,HBBsignals are detected in red, DAPI staining of nuclear DNA is in blue. Examples for 3 individual intergenic probes and one probe cocktail are shown, as indicated; for probe labels and positions see (D) and Materials and Methods; scale bar, 5mm. Each intergenic probe detects signals only in a proportion of allb-globin loci in the cell population. The percentage of cells with intergenic signals was scored for individual probes or cocktail; results from the quantitative analysis are presented in (D). (D) Bar plot representing percentages of cells with intergenic signals. Bar positions on the x axis correspond to probe positions and are aligned with the map below the graph; coordinates in kilobases (kb) are relative to theHBEgene transcription start site at position 1. Probes are depicted as green boxes below the map. Probe cocktails are indicated by open boxes. Probes from 59 to 39: 59UBQLN3, 39UBQLN3, 59ORG14, 39ORG14, 39ORG8, 39ORG7A, 39ORG7B, 59ORG6, HS5, HS3, 39e, 59c, 59d, and 59b. Map features as in (A). Relatively high levels of intergenic transcription are detected in theb-globin LCR and the activedbdomain.
the cell-cycle timing of transcripts in the upstream ORGregion compared to the sub-domains of the b-globin locus. We used PCNA immuno-staining to mark cells in S phase in conjunction with RNA FISH[16] with intergenic probes in primary cultured human erythroid cells to determine whether these transcripts occur predominantly in S phase or in non-S-phase cells (Figure 6A). The data show that transcription throughout the
ORGregion occurs predominantly in PCNA positive, S-phase cells
(Figure 6B). The percentage of signals occurring in S-phase ranges from 64 to 72 in theORGregion upstream of theb-globin locus. The timing of intergenic transcription in the LCR anddb sub-domains is markedly different. The majority of signals in these active domains occur in non-S-phase cells. There are still a small percentage of cell nuclei with signals in S-phase nuclei in the active domains and these levels are comparable to the percentage of nuclei with S-phase signals in theORGregion. Signals in theec Figure 6. Upstream transcripts occur predominantly in S phase.(A) Cell cycle analysis of intergenic transcription in the 59olfactory receptor gene cluster region in human primary erythroid precursor cells by RNA immuno-FISH. Intergenic transcription signals are detected in green,HBBtranscript signals are red, PCNA is pseudocoloured in blue; scale bar, 2mm. Shown are single focal planes from several representative PCNA-positive cells and one PCNA-negative cell with various probe combinations. For all probe positions, see Materials and Methods. PCNA-negative cell (bottom right): the brightness of the blue channel is enhanced to demonstrate the absence of PCNA staining. (B) Percentage of PCNA-positive intergenic signal-containing cells was scored for individual probes or the indicated probe cocktails. Bar plot representing percentages of cells with intergenic signals (as in Figure 5D) with the proportion of PCNA-positive cells (S phase) shown in blue. The percentage of intergenic signal-containing S-phase cells is relatively uniform throughout the 59ORGandb-globin loci (average 3.3% marked by dashed line). Bar positions on the x axis correspond to probe positions and are aligned with the map below the graph; coordinates in kilobases (kb) are relative to theHBEgene transcription start site at position 1. Probes are depicted as green boxes below the map. Probe cocktails are indicated by open boxes. Probes from 59to 39: 39ORG14, 39ORG8, 39ORG7A, 39ORG7B, 59ORG6, HS5, HS3, 39e, 59c, 59d, and 59b. Map features: red arrowheads, globin genes; pink rectangle,b-like pseudogene; white arrowheads, olfactory receptor genes; black arrowhead,UBQLN3gene; vertical blue lines, hypersensitive sites; blue arrows, intergenic transcription start sites; LTR, long terminal repeats;db,dbintergenic promoter. The high level of intergenic transcription in theb-globin LCR and the activedbdomain is accounted for by higher percentages of non-S-phase cells with intergenic signals.
doi:10.1371/journal.pone.0000630.g006
sub-domain occur at nearly equal frequencies in S- and non-S-phase nuclei (Figure 6B). These results suggest the possibility that a large transcript that initiates at the -236 LTR element continues through the entireORGregion and into theb-globin locus in S-phase cells. The existence of these types of transcripts is supported by and consistent with EST data. The increased transcription of the LCR anddbsub-domains in non-S-phase nuclei shows that the majority of transcription in these regions is controlled independently of transcription in theORG region andecsub-domain. Furthermore these results show that the majority of LCR anddb sub-domain transcripts are not contiguous with each other or theORGandec sub-domain transcripts. We noted that the ratio of G1 to S phase intergenic transcription is slightly higher in theecdomain compared to theORGcluster. We previously showed that a small percentage of cells in the human cell cultures are not fully differentiated, still transcribe theHBGgenes and would be expected to have an activeec domain [6]. This may account for the slightly increased ratio of G1/S intergenic transcription in this region.
PCNA localization patterns change as S phase progresses permitting the discrimination of early, middle and late S-phase stages[16,37]. We noted that with probes to the most 59region of the transcribedORGdomain we observed a higher proportion of cells in early S phase compared to cells with middle or late PCNA patterns. Probes located more 39 of the -236 LTR in the ORG
region detected signals in progressively later S-phase cells indicating an S phase-specific wave of transcription through the upstream ORG cluster, consistent with a large continuous transcript into theb-globin locus. Combined with the EST data, these results suggest that large transcripts initiate from the LTR promoter early in S phase, immediately after the locus has replicated and process through the entireORGcluster, LCR and into theb-globin locus. These transcripts are distinct from the bulk of transcription that occurs in the active LCR anddbsub-domains that occurs predominantly in G1 phase. These results link high levels of non-S-phase intergenic transcription with chromatin domains that are highly enriched in active histone modifications.
DISCUSSION
We have shown that the human b-globin locus is composed of multiple chromatin sub-domains that are developmentally regu-lated. The individual sub-domains can be distinguished by differential general sensitivity to DNase I, intergenic transcription and active histone modifications primarily to H3. Our data show that H3K4 di- and tri-methylation and H3 hyperacetylation clearly mark domains with high levels of G1 phase intergenic transcription. H4 hyperacetylation also marks the active domains but appears at moderate levels in the inactive sub-domains in embryonic and adult erythroid cells in transgenic mice. We show that a very large transcript that initiates approximately 236 kb upstream of the human b-globin locus and extends through the locus is produced primarily in S phase. Transcription of the active sub-domains, containing the LCR and the active genes at each developmental stage, occurs primarily in G1 phase. These results correlate high levels of G1 phase-specific intergenic transcription with high levels of active histone modifications, namely, H3K4 di-and tri-methylation, di-and H3 acetylation, across the transcribed sub-domains, suggesting that the timing of intergenic transcription and/or the level of transcription may play a role in propagating these marks. There are clear indications that the elongating form of RNA polymerase II (RNAPII) is associated with histone modifying and chromatin remodelling activities[38], which could account for the modified domains we observe in areas of high intergenic transcription. Additional possibilities are suggested by recent studies indicating that transcription by RNAPII outside of S
phase could promote replication independent histone exchange leading to the deposition of variant histones such as H3.3[39]. Although non-genic transcription is widespread in vertebrate genomes it is unlikely that all of this transcription leads to deposition of variant histones and active histone modifications. Controlling the timing of intergenic transcription may be a strategy adopted to modify specified domains.
In adult erythroid cells the LCR and the adultb-globin genes engage in long-range interactions, essentially forming a chromatin loop[40,41]. The mechanism by which these distal sequences find each other has been the subject of intense speculation and debate. Although a loop is formed, a ‘‘looping mechanism’’ implies that the two sequences find each other via diffusion-mediated random collisions. The discovery of intergenic transcripts initiating in the LCR and proceeding in the direction of the globin genes have suggested a tracking mechanism of enhancer-gene contact in which the LCR and associated factors including RNAPII track through the locus in search of an activatable gene promoter. Our data indicate that the majority of LCR transcripts are not contiguous withdbdomain transcripts, implying that a continuous scanning mechanism is unlikely. However, a low level of tran-scription through theecdomain may be contiguous with LCR and db domain transcripts. If the chromatin loop was established through a scanning mechanism one might expect that minimally it would need to operate at least two times per cell cycle. First, when cells exit mitosis, long-range contacts may need to be re-established after decondensation of the inactive mitotic chromo-some structure prior to gene transcription. Second, after DNA replication, which is known to temporarily disrupt transcription, long-range contacts may need to be re-established on individual daughter alleles in early S-phase. Although we do not know the precise timing of G1-specific intergenic transcripts in the ec domain (i.e. early or late G1) intergenic transcripts are clearly present there in early S-phase just after replication of the locus, suggesting that a limited tracking mechanism of LCR-gene interaction would be compatible with our data. However, a diffusion-mediated looping mechanism of LCR-gene contact is not ruled out by our results.
What could be the role of the very long transcripts that initiate at2236 kb upstream of the locus? The null hypothesis is that it has no role at all and is merely the result of transcriptional noise. However, the transcript appears to be very tightly regulated occurring predominantly in S phase, strand-specific and appar-ently initiating from a single discrete site. It is possible that histones in theORGandecdomain regions are modified by passage of the RNAPII complex as part of decondensation of the globin locus, but that active marks in these regions are rapidly or more thoroughly turned over due to the rarity and very low level at which these transcripts occur. We estimate that there may be as little as a single RNAPII complex transcribing these regions in loci with a positive RNA FISH signal. ChIP analysis on a sorted or synchronized population of early S-phase erythroid cells could address the question of whether this low level transcription is linked to transient histone modifications.
In summary, our data strengthen the link between intergenic transcription and modification of histones over wide chromatin domains, and suggest that developmental regulation of expression the human b-globin genes occurs in part through epigenetic changes to chromatin structural domains.
MATERIALS AND METHODS
Animals and Human primary cell culture
Experimental procedures were conducted in compliance with an animal protocol approved by the home office and local ethical review committee. Transgenic mice homozygous for a wild type 150 kb humanb-globin locus YAC were previously described by Tanimoto
et al.[27]. Adult mice were made anemic as previously described[46]. Human peripheral blood from healthy individuals was obtained from a local blood bank, prepared and cultured as described in Chakalovaet al.[6], and harvested on day 2 post-hemoglobinization.
RNA-FISH
RNA FISH was performed as previously described[16]. The following probes were used to visualise intergenic transcription signals (coordinates relative to theegene transcription start site at position +1 are given in brackets): 59UBQLN3 (-243679 to
-241290), 39UBQLN3 (-236996 to -236060), 59ORG14 (-235344 to -232998), 39ORG14 (-219479 to -221543), 39ORG8 (-131754 to -130106), 39ORG7A (-113405 to -111608), 39ORG7B (-100614 to -99051), 59ORG6 (-94181 to -92378), 59ORG3 (-57154 to -55376), 39ORG1 (-27315 to -25831), HS5 (-22844 to -19501), HS3 (-16236 to -14330), 39e(3126 to 5919), 59c(10881 to 12866), 59d(32851 to 35239), 59b(38504 to 42384). Digoxigenin-labeled single-stranded DNA probes were generated from the cloned sequences as described[47] and detected with FITC-labeled antibodies. Intergenic probes were used in combination with a probe to theGBB gene intron 2; in double-label RNA FISH experiments, a cocktail of four dinitrophenol-labeledGBBintron 2 30-mer oligonucleotides were used (described in [6]), and detected with Texas Red-labeled antibodies; for three-colour cell cycle analysis, a longer biotin-labeled single-stranded DNA probe (coordinates 43126 to 44043) was applied and detected with Alexa Fluor 350-labeled Streptavidin (Molecular Probes Invitrogen). In all cases, slides were examined on an Olympus BX41 epifluores-cence microscope. To determine the percentage of loci associated with intergenic transcription signals, a minimum of 100 loci were counted for each data point. PCNA was visualised with a primary mouse monoclonal anti-PCNA antibody (Santa Cruz) followed by Texas Red-conjugated goat anti-mouse secondary antibody (Jackson ImmunoResearch). To determine the percentage of PCNA-positive intergenic transcription signal-containing cells, cells with intergenic signals were identified, and digital images were captured for each of the three colour channels to record gene and intergenic FISH signals as well as PCNA patterns. 40 cells were analysed for each data point.
Quantitative RT-PCR
Total RNA was extracted from adult anemic spleen and day 11 embryonic blood of homozygous transgenic mice. RNA was isolated according to the manufacturer’s instructions from frozen cell pellets using 4 ml of RNA-Bee (AMS Biotechnology) per 107cells. 1mg of total RNA was mixed with Random hexanucleotide mix (5 ng/ml final concentration, Promega) and RNase-free water in a final volume of 20ml. Reverse transcription was carried out with Superscript II reverse transcriptase (Invitrogen) following the protocol provided by the manufacturer in the presence of 2 u/ml RNasin. RT negative controls in which the reverse transcriptase
enzyme omitted were set up in parallel. Real-time PCR was performed with an ABI PRISM 7000 Sequence Detection System using SYBR green PCR Master Mix (Applied Biosystems). 2ml of cDNA were used in real-time PCR, in duplicate, with the following thermal cycling conditions: 50uC for 2 minutes and 95uC for 5 minutes, followed by 40 cycles of 95uC for 30 seconds and 62uC for 2 minutes. For primer sequences, see Table S1 in Supporting Information. The relative amount of cDNA amplification for each primer pair was calculated by comparing to transgenic genomic DNA standards. Data were normalised to the most 59data point in the olfactory receptor region, which shows low level of transcription.
Chromatin immunoprecipitation
Histone modification profiles across the human b-globin locus were assessed by native chromatin immunoprecipitation (NChIP)[48]. Single-cell suspensions of erythroid or mouse embryo fibroblast cells were resuspended to 26107 cells/ml in ice cold 16RSB (10 mM Tris-HCl, pH7.5, 10 mM NaCl, 3 mM MgCl2), 0.1% Triton X-100, 0.5 mM DTT, 0.1 M sucrose, 0.1 mM PMSF (Sigma), 5 mM Na butyrate and 1/50th volume protease inhibitor cocktail (Sigma). The cells were dounced in a cold glass homogeniser and diluted with an equal volume of the same buffer with 0.25 M sucrose. The suspension was layered onto a sucrose cushion consisting of a half volume of 0.33 M sucrose, 5 mM MgCl2, 10 mM Tris pH8, 0.5 mM DTT, 0.1 mM PMSF, 5 mM Na butyrate. This was then centrifuged at 800 x g for 5 min at 4oC to obtain the nuclear pellet.
After preparing nuclei, chromatin was digested with micrococcal nuclease generating DNA predominantly mononucleosomal in length. NChIP was carried out using the following rabbit polyclonal antibodies: anti-trimethyl-histone H3 (K4) (Abcam), anti-dimethyl-histone H3 (K4), anti-dimethyl-histone H3 (K9/K14), anti-acetyl-histone H4 (K5/18/12/16), ChIP-grade anti-hyperacetylated his-tone H4, penta lysine (all from Upstate Biotechnology)
DNA from the Input chromatin fractions was quantified by standard spectrophotometry. DNA concentrations in the anti-body-bound fractions were determined by PicoGreen (Invitrogen) fluorescence quantification, using Input DNA for standards. Real-time PCR was performed in an ABI PRISM 7000 Sequence Detection System using SYBR green PCR Master Mix (Applied Biosystems). All PCR reactions were carried out in duplicate on 3 ng DNA at 50uC for 2 minutes and 95uC for 5 minutes, followed by 40 cycles of 95uC for 30 seconds and 62uC for 2 minutes. For primer sequences, see Table S1 in Supporting Information. The ratio of Bound to Input DNA was calculated using the comparative CT method, Bound/Input = 2(Input Ct – Bound Ct)[49]. Data were normalised to the most 59 data point in the olfactory receptor region, which shows low enrichment for all antibodies. The promoter of the ubiquitously expressed mouseActb(b-actin) gene was used as an internal positive control (Supporting Information Figure S1). The ChIP experiments were repeated several times with similar results and domain patterns. Shown are the results of a single representative ChIP experiment.
SUPPORTING INFORMATION
acetylated histone H3 (K9/14, H3ac), and acetylated histone H4 (two different antibodies: ChIP grade antibody, K5/18/12/16, H4acCh; penta lysine, H4acP). The fold-enrichment of antibody-bound sequences was analysed by real-time PCR (Bound/Input) using a primer pair in the mouse Actb promoter.
Found at: doi:10.1371/journal.pone.0000630.s001 (0.19 MB TIF)
Table S1 Primer pairs used for real-time PCR. Primer pairs used to amplify sequences in the human HBB gene cluster and flanking regions; primer names reflect the position of the amplicon relative to the HBE gene transcription start site at position+1 or known genomic elements. Actb Pr is the mouseb-actin promoter region amplicon. For, forward primer; Rev, reverse primer.
Found at: doi:10.1371/journal.pone.0000630.s002 (0.04 MB DOC)
ACKNOWLEDGMENTS
We thank Drs. E. Debrand and A. Horton for helpful advice and assistance.
Author Contributions
Conceived and designed the experiments: PF LC JM JM. Performed the experiments: LC JM JM. Analyzed the data: LC JM JM. Contributed reagents/materials/analysis tools: DE KT CO LO BG TK. Wrote the paper: PF LC JM JM.
REFERENCES
1. Carninci P, Kasukawa T, Katayama S, Gough J, Frith MC, et al. (2005) The transcriptional landscape of the mammalian genome. Science 309: 1559–1563.
2. Cheng J, Kapranov P, Drenkow J, Dike S, Brubaker S, et al. (2005) Transcriptional maps of 10 human chromosomes at 5-nucleotide resolution. Science 308: 1149–1154.
3. Kampa D, Cheng J, Kapranov P, Yamanaka M, Brubaker S, et al. (2004) Novel RNAs identified from an in-depth analysis of the transcriptome of human chromosomes 21 and 22. Genome Res 14: 331–342.
4. Kapranov P, Cawley SE, Drenkow J, Bekiranov S, Strausberg RL, et al. (2002) Large-scale transcriptional activity in chromosomes 21 and 22. Science 296: 916–919.
5. Rinn JL, Euskirchen G, Bertone P, Martone R, Luscombe NM, et al. (2003) The transcriptional activity of human Chromosome 22. Genes Dev 17: 529–540. 6. Chakalova L, Osborne CS, Dai YF, Goyenechea B, Metaxotou-Mavromati A, et
al. (2005) The Corfu deltabeta thalassemia deletion disrupts gamma-globin gene silencing and reveals post-transcriptional regulation of HbF expression. Blood 105: 2154–2160.
7. Drewell RA, Bae E, Burr J, Lewis EB (2002) Transcription defines the embryonic domains of cis-regulatory activity at the Drosophila bithorax complex. Proceedings of the National Academy of Sciences of the United States of America 99: 16853–16858.
8. Schmitt S, Prestel M, Paro R (2005) Intergenic transcription through a polycomb group response element counteracts silencing. Genes Dev 19: 697–708. 9. Masternak K, Peyraud N, Krawczyk M, Barras E, Reith W (2003) Chromatin
remodeling and extragenic transcription at the MHC class II locus control region. Nature Immunology 4: 132–137.
10. Ho Y, Elefant F, Liebhaber SA, Cooke NE (2006) Locus control region transcription plays an active role in long-range gene activation. Mol Cell 23: 365–375.
11. Rogan DF, Cousins DJ, Santangelo S, Ioannou PA, Antoniou M, et al. (2004) Analysis of intergenic transcription in the human IL-4/IL-13 gene cluster. Proc Natl Acad Sci U S A 101: 2446–2451.
12. Jones EA, Flavell RA (2005) Distal enhancer elements transcribe intergenic RNA in the IL-10 family gene cluster. J Immunol 175: 7437–7446. 13. Bolland DJ, Wood AL, Johnston CM, Bunting SF, Morgan G, et al. (2004)
Antisense intergenic transcription in V(D)J recombination. Nat Immunol 5: 630–637.
14. Ogawa Y, Lee JT (2003) Xite, X-inactivation Intergenic transcription elements that regulate the probability of choice. Molecular Cell 11: 731–743. 15. Ashe HL, Monks J, Wijgerde M, Fraser P, Proudfoot NJ (1997) Intergenic
transcription and transinduction of the human beta-globin locus. Genes & Development 11: 2494–2509.
16. Gribnau J, Diderich K, Pruzina S, Calzolari R, Fraser P (2000) Intergenic transcription and developmental remodeling of chromatin subdomains in the human beta-globin locus. Mol Cell 5: 377–386.
17. Calzolari R, McMorrow T, Yannoutsos N, Langeveld A, Grosveld F (1999) Deletion of a region that is a candidate for the difference between the deletion forms of hereditary persistence of fetal hemoglobin and deltabeta-thalassemia affects beta- but not gamma-globin gene expression. Embo J 18: 949–958. 18. Bernstein BE, Humphrey EL, Erlich RL, Schneider R, Bouman P, et al. (2002)
Methylation of histone H3 Lys 4 in coding regions of active genes. Proc Natl Acad Sci U S A 99: 8695–8700.
19. Bernstein BE, Kamal M, Lindblad-Toh K, Bekiranov S, Bailey DK, et al. (2005) Genomic maps and comparative analysis of histone modifications in human and mouse. Cell 120: 169–181.
20. Schubeler D, MacAlpine DM, Scalzo D, Wirbelauer C, Kooperberg C, et al. (2004) The histone modification pattern of active genes revealed through genome-wide chromatin analysis of a higher eukaryote. Genes & Development 18: 1263–1271.
21. Forsberg EC, Downs KM, Christensen HM, Im H, Nuzzi PA, et al. (2000) Developmentally dynamic histone acetylation pattern of a tissue-specific chromatin domain. Proc Natl Acad Sci U S A 97: 14494–14499.
22. Kim A, Dean A (2004) Developmental stage differences in chromatin subdomains of the beta-globin locus. Proceedings of the National Academy of Sciences of the United States of America 101: 7028–7033.
23. Schubeler D, Francastel C, Cimbora DM, Reik A, Martin DI, et al. (2000) Nuclear localization and histone acetylation: a pathway for chromatin opening and transcriptional activation of the human beta-globin locus. Genes Dev 14: 940–950.
24. Schubeler D, Groudine M, Bender MA (2001) The murine beta-globin locus control region regulates the rate of transcription but not the hyperacetylation of histones at the active genes. Proceedings of the National Academy of Sciences of the United States of America 98: 11432–11437.
25. Haussecker D, Proudfoot NJ (2005) Dicer-dependent turnover of intergenic transcripts from the human beta-globin gene cluster. Mol Cell Biol 25: 9724–9733.
26. Bulger M, Schubeler D, Bender MA, Hamilton J, Farrell CM, et al. (2003) A complex chromatin landscape revealed by patterns of nuclease sensitivity and histone modification within the mouse beta-globin locus. Mol Cell Biol 23: 5234–5244.
27. Tanimoto K, Liu Q, Bungert J, Engel JD (1999) Effects of altered gene order or orientation of the locus control region on human beta-globin gene expression in mice. Nature 398: 344–348.
28. Fraser P, Pruzina S, Antoniou M, Grosveld F (1993) Each hypersensitive site of the human beta-globin locus control region confers a different developmental pattern of expression on the globin genes. Genes Dev 7: 106–113.
29. Peterson KR, Clegg CH, Navas PA, Norton EJ, Kimbrough TG, et al. (1996) Effect of deletion of 59HS3 or 59HS2 of the human beta-globin locus control region on the developmental regulation of globin gene expression in beta-globin locus yeast artificial chromosome transgenic mice. Proceedings of the National Academy of Sciences of the United States of America 93: 6605–6609. 30. Leach KM, Nightingale K, Igarashi K, Levings PP, Engel JD, et al. (2001)
Reconstitution of human beta-globin locus control region hypersensitive sites in the absence of chromatin assembly. Mol Cell Biol 21: 2629–2640.
31. Long QM, Bengra C, Li CH, Kutlar F, Tuan D (1998) A long terminal repeat of the human endogenous retrovirus ERV-9 is located in the 59boundary area of the human beta-globin locus control region. Genomics 54: 542–555. 32. Routledge SJ, Proudfoot NJ (2002) Definition of transcriptional promoters in the
human beta globin locus control region. J Mol Biol 323: 601–611.
33. Tuan D, Kong SM, Hu K (1992) Transcription of the Hypersensitive Site Hs2 Enhancer in Erythroid-Cells. Proceedings of the National Academy of Sciences of the United States of America 89: 11219–11223.
34. Fibach E, Manor D, Oppenheim A, Rachmilewitz EA (1989) Proliferation and maturation of human erythroid progenitors in liquid culture. Blood 73: 100–103. 35. Fibach E, Rachmilewitz EA (1990) Proliferation and differentiation of erythroid progenitors in liquid culture: analysis of progenitors derived from patients with polycythemia vera. Am J Hematol 35: 151–156.
36. Xiang P, Fang X, Yin W, Barkess G, Li Q (2006) Non-coding transcripts far upstream of the epsilon-globin gene are distinctly expressed in human primary tissues and erythroleukemia cell lines. Biochem Biophys Res Commun 344: 623–630.
37. Humbert C, Santisteban MS, Usson Y, Robertnicoud M (1992) Intranuclear Colocation of Newly Replicated DNA and Pcna by Simultaneous Immunoflu-orescent Labeling and Confocal Microscopy in Mcf-7 Cells. Journal of Cell Science 103: 97–103.
38. Sims RJ 3rd, Belotserkovskaya R, Reinberg D (2004) Elongation by RNA polymerase II: the short and long of it. Genes Dev 18: 2437–2468.
39. Henikoff S, Furuyama T, Ahmad K (2004) Histone variants, nucleosome assembly and epigenetic inheritance. Trends Genet 20: 320–326.
40. Carter D, Chakalova L, Osborne CS, Dai YF, Fraser P (2002) Long-range chromatin regulatory interactions in vivo. Nat Genet 32: 623–626.
42. Wansink DG, Manders EE, van der Kraan I, Aten JA, van Driel R, et al. (1994) RNA polymerase II transcription is concentrated outside replication domains throughout S-phase. J Cell Sci 107 ( Pt 6): 1449–1456.
43. Osborne CS, Chakalova L, Brown KE, Carter D, Horton A, et al. (2004) Active genes dynamically colocalize to shared sites of ongoing transcription. Nat Genet 36: 1065–1071.
44. Ragoczy T, Bender MA, Telling A, Byron R, Groudine M (2006) The locus control region is required for association of the murine beta-globin locus with engaged transcription factories during erythroid maturation. Genes Dev 20: 1447–1457.
45. Chakalova L, Mitchell JA, Debrand E, Osborne CS, Fraser P (2005) Replication and transcription: Forces that shape the landscape of the genome. Nature Reviews Genetics in press.
46. Dickerman HW, Cheng TC, Kazazian HH Jr, Spivak JL (1976) The erythropoietic mouse spleen-a model system of development. Arch Biochem Biophys 177: 1–9.
47. Chakalova L, Carter D, Fraser P (2004) RNA fluorescence in situ hybridization tagging and recovery of associated proteins to analyze in vivo chromatin interactions. Methods Enzymol 375: 479–493.
48. O’Neill LP, Turner BM (2003) Immunoprecipitation of native chromatin: NChIP. Methods 31: 76–82.
49. Livak KJ, Schmittgen TD (2001) Analysis of relative gene expression data using real-time quantitative PCR and the 2(T)(-Delta Delta C) method. Methods 25: 402–408.