ORIGINAL ARTICLE
Interview-based assessment of cognition is a strong
predictor of quality of life in patients with schizophrenia
and severe negative symptoms
Breno F. Cruz,
1Camilo B. de Resende,
2Carolina F. Carvalhaes,
3Clareci S. Cardoso,
4Antonio L. Teixeira,
1,5Richard S. Keefe,
6Fa´bio L. Rocha,
3Joa˜o V. Salgado
1,2,71Programa de Po´s-Graduac
¸a˜o em Neurocieˆncias, Instituto de Cieˆncias Biolo´gicas, Universidade Federal de Minas Gerais (UFMG),
Belo Horizonte, MG, Brazil.2Grupo de Pesquisa em Psiquiatria e Cognic¸a˜o, Instituto Raul Soares, Fundac¸a˜o Hospitalar do Estado de Minas
Gerais (FHEMIG), Belo Horizonte, MG, Brazil.3Instituto de Prevideˆncia dos Servidores do Estado de Minas Gerais (IPSEMG), Belo Horizonte, MG, Brazil.4Departamento de Epidemiologia, Universidade Federal de Sa˜o Joa˜o del-Rei (UFSJ), Sa˜o Joa˜o del-Rei, MG, Brazil.
5Departamento de Medicina Interna, UFMG, Belo Horizonte, MG, Brazil.6Department of Psychiatry and Behavioral Sciences, Duke University
Medical Center, Durham, NC, USA.7Departamento de Morfologia, UFMG, Belo Horizonte, MG, Brazil.
Objective:To analyze the correlation between quality of life, symptoms, and cognition assessed by the interview-based Schizophrenia Cognition Rating Scale (SCoRS).
Methods:Seventy-nine outpatients diagnosed with schizophrenia were evaluated with the Quality of Life Scale – Brazilian version (QLS-BR), the SCoRS, and symptoms scales (Positive and Negative Syndrome Scale [PANSS]). After determining the potential explanatory variables using Spearman’s correlation and Student’s t test results, we ran simple, multivariate, and decision-tree regression analyses to assess the impact of SCoRS and PANSS ratings on mean overall quality of life.
Results:Cognitive deficits and negative symptoms were the best predictors of quality of life. A low degree of negative symptoms (PANSS negativeo11) was a strong predictor of better quality of life (QLS
B75), regardless of SCoRS rating. Among participants with more severe negative symptoms, elevated cognitive impairment (interviewer SCoRSB44) was a predictor of worse quality of life (QLSB44).
Conclusions:Cognitive impairment determined by interview-based assessment seems to be a strong predictor of quality of life in subjects with severe negative symptoms. These results support the usefulness of SCoRS for cognitive assessment that is relevant to the everyday life of patients with schizophrenia.
Keywords: Schizophrenia; cognitive neuroscience; outpatient psychiatry; tests/interviews, psychometric; chronic psychiatric illness
Introduction
Cognitive impairment is a core feature of schizophrenia that does not depend on the presence of positive and negative symptoms and is related to functional impair-ment.1,2 Thus, the assessment of cognitive deficits in
schizophrenia is critical for the study of impact of disease and the development of rehabilitation.
The assessment of quality of life is a useful tool to determine the impact of a disease on daily life. One of the interesting aspects of quality of life is that it introduces a subjective component that covers the perceptions of individuals about themselves and about the damage caused by disease. The inclusion of a subjective feature facilitates more effective interventions from a biopsycho-social perspective, beyond the reduction of symptoms.3
Therefore, quality of life measures are increasingly being used in the evaluation of functional outcome, drug testing, approval of new drugs, evaluation of rehabilitation, and resource allocation.4
Most definitions of quality of life refer to the subjective satisfaction of subjects with various aspects of their life, including physical health, psychological state, social functioning, and general living conditions.5,6 These are distinct areas that are influenced by the experience, beliefs, expectations, and perceptions of individuals. The World Health Organization (WHO) defines quality of life as ‘‘an individual’s perception of their position in life in the context of the culture and value systems in which they live and in relation to their goals, expectations, standards and concerns.’’7
Several studies have examined the associations between quality of life and cognitive deficits in schizophrenia.8-12 However, probably because a variety of instruments have been used to evaluate quality of life, the results have varied between studies. A higher association between cognitive impairment and quality of life has been obtained with the use of objective quality of life scales rated by researchers than with measures of subjective quality of life in patient-reported Correspondence: Prof. Joa˜o Vinı´cius Salgado, Departamento de
Morfologia, Instituto de Cieˆncias Biolo´gicas, Universidade Federal de Minas Gerais, Av. Antoˆnio Carlos, 6627, Campus Pampulha, CEP 31270-910, Belo Horizonte, MG, Brazil.
E-mail: [email protected]
Submitted Jul 16 2015, accepted Nov 24 2015. Associac¸a˜o Brasileira de Psiquiatria
outcomes.13,14 Most of these studies have used perfor-mance-based neuropsychological tests as a measure of cognitive function.
However, identifying cognitive deficits is not the same as understanding the impact of cognitive deficits on the lives and day-to-day activities of patients. A group of experts has cautioned that neuropsychological test scores alone are insufficient for the regulatory approval of new drugs for improvement of cognitive functioning in schizophrenia.15-17 Therefore, assessment tools that are sensitive to changes in cognitive functioning and that directly reflect daily functioning are necessary. To address this need, interview-based measures of cognition (as opposed to functional capacity assessments), which may serve as co-primary measures in drug evaluations, have been proposed.16,17
One of these interview-based assessments is the Schizo-phrenia Cognition Rating Scale (SCoRS). Its original version in English has been validated and shown to have good reliability. The SCoRS involves an interview with patients and informants as well as the interviewer’s impression of these two sources of information.16 The inclusion of informants improves the validity of the scale, because studies have shown that scales that rely only on the views of patients and interviewers do not significantly correlate with objective measures of cognitive functioning.17-21
To date, there is no study evaluating the relationship between quality of life and cognition assessed by inter-view-based scales. This study aimed to investigate the correlation between cognition, as measured by SCoRS, and quality of life, taking into consideration the influence of depressive and of positive and negative symptoms on quality of life and SCoRS.
Methods
Participants
Seventy-nine patients with schizophrenia whose diagnosis was confirmed by structured clinical interview using the Mini International Neuropsychiatric Interview (MINI) - Brazilian version were enrolled.22All patients were stable, undergoing
outpatient psychiatric treatment, and using antipsychotics. Stabilization was defined as the absence of changes in medication doses in the last three months. Exclusion criteria were abuse of alcohol or illicit drugs and history of neuro-logical diseases. The patients were enrolled in the following clinical facilities: Department of Psychiatry of the Instituto de Prevideˆncia dos Servidores do Estado de Minas Gerais (IPSEMG), Nu´cleo de Assisteˆncia Psicossocial (NAPS) de Ribeira˜o das Neves, non-governmental organization LAC¸ O and Raul Soares Institute, Fundac¸a˜o Hospitalar do Estado
de Minas Gerais (FHEMIG).
Severity of symptoms
The Positive and Negative Syndrome Scale (PANSS)23 and the Calgary Depression Scale for Schizophrenia (CDSS)24– Brazilian versions – were used to assess the severity of positive and negative and depressive symp-toms respectively. The PANSS score ranges from 7 to 49
for positive and negative symptoms. The CDSS score ranges from 0 to 27. In both scales, the higher the score, the greater the severity of symptoms. The antipsychotic doses of individual patients were converted to chlorpro-mazine equivalents.
Quality of life
The Quality of Life Scale – Brazilian version (QLS-BR) was used to assess quality of life.25,26 This scale was specifically developed for schizophrenia, and its develop-ment was guided by conceptualizations of the deficit syndrome to evaluate the more insidious aspects of the disease. The Brazilian version of the QLS has a multi-dimensional structure with three factors, including 21 items. The factors are: social network; occupational level; and intrapsychic functioning/interpersonal relationship. Among the 21 items, two that do not fall into one of the three factors were retained due to their high correlation with the total scale score. These items are motivation and anhedonia. For each item, the rater assigns a score from 0 to 6, with higher scores corresponding to better quality of life. Scores range from 0 to 48 in the social network and intrapsychic functioning/interpersonal relationships fac-tors, and from 0 to 30 in the occupational level factor. The total score ranges from 0 to 126. The QLS-BR has internal consistency greater than 0.85, test-retest correla-tion of 0.85, and interrater reliability of 0.67 to 1.00.26In
the present study, the scale was administered by a professional trained by one of the investigators (CSC), who also participated in the validation of the Brazilian version of the QLS.
Cognitive assessment
its English version, the items of the SCoRS have interrater reliability ranging between 1.00 and 0.81, internal consis-tency of 0.79, and validity determined by its high correlation with neuropsychological tests and measures of functional outcome.16In the MATRICS Psychometric and
Standardi-zation Study, SCoRS global ratings had test-retest reliability of ICC = 0.81.27
Procedures
The scales for clinical evaluation and quality of life were administered by the principal clinical investigator (BFC). On the same day, a neuropsychologist administered the cognitive assessment tool. The investigators were blinded to the results of the other assessment. All patients signed an informed consent form, and the study was approved by the Research Ethics Committee at IPSEMG. All proce-dures were in accordance with the 1964 Helsinki Decla-ration and its later amendments or comparable ethical standards.
Statistical analysis
Spearman’s correlation test was used to determine which variables correlated significantly with overall quality of life. The variables of interest were age, total PANSS negative (PANSS-N), total PANSS positive (PANSS-P), total Calgary, and total SCoRS ratings. Student’s t test was used to evaluate the influence of gender on the mean quality of life (QLS). After determining the potential explanatory variables using the Spearman’s correlation and Student’s t tests, we ran simple, multivariate, and
decision-tree regression analyses to assess the power of explanatory variables to predict total quality of life. The software R version 2.15.2 was used for statistical analysis.
Results
Sociodemographic, clinical, and cognitive variables, as well their association with QLS, are presented in Table 1. Gender, age, educational level, dose of medication (in chlorpromazine-equivalent dose), and depressive symp-toms (Calgary scale) did not influence overall quality of life. By contrast, high levels of positive and negative symptoms (as measured by PANSS) or cognitive impair-ment (as measured by SCoRS) were strongly and inversely correlated with QLS.
Table 2 shows the correlation between the three SCoRS scores (patient, informer, and investigator). Because the correlations between these three scores were very high, only interviewer SCoRS data were used for statistical analysis. We chose interviewer SCoRS ratings because these individuals are more qualified to distinguish cognitive impairment from negative symptomatology.28
Running simple regression analyses using PANSS-N, PANSS-P, and SCoRS as single explanatory variables of QLS, we found that PANSS-N (p o 0.001), PANSS-P (p = 0.026), and SCoRS (p o 0.001) significantly predicted quality of life at a = 5%. The adjusted R-squared values resulting from these simple regression analyses were 0.171 for negative symptoms, 0.051 for positive symptoms, and 0.194 for cognitive symptoms. A multivariate regression model including negative symptoms, positive symptoms, and cognitive symptoms
Table 1 Impact of variables on quality of life
Variable Proportion Mean QLS p-value (ttest)
Gender
Male 52% (n=41) 53.6
Female 48% (n=38) 59.1 0.098
Mean (standard deviation) Correlation with total QLS (Spearman’s rho) p-value
Age (years) 40.8 (11.5) -0.166 0.169
Education level (years of study) 8.3 (0.38) 0.192 0.096
CPZ eq (mg) 404.5 (29.77) -0.172 0.133
Calgary 2.9 (3.8) -0.144 0.166
PANSS-P 11.2 (3.9) -0.368 o0.001*
PANSS-N 15.9 (6.2) -0.531 o0.001*
SCoRS interviewer 38.8 (10.8) -0.471 o0.001*
CPZ eq = chlorpromazine equivalent; PANSS-N = Positive and Negative Syndrome Scale - negative; PANSS-P = Positive and Negative Syndrome Scale - positive; QLS = Quality of Life Scale; SCoRS = Schizophrenia Cognition Rating Scale.
*Significant ata= 1%.
Table 2 Correlations between the sources of information from SCoRS
Variable
Mean (standard deviation)
Correlation with SCoRS interviewer
Correlation with SCoRS informant
Correlation with
SCoRS patient p-value
SCoRS interviewer 38.8 (10.8) 0.805 0.773 o0.001*
SCoRS informant 38.7 (11.5) 0.805 0.690 o0.001*
SCoRS patient 38.4 (10.8) 0.773 0.690 o0.001*
SCoRS = Schizophrenia Cognition Rating Scale.
as explanatory variables showed that PANSS-P coeffi-cient (p = 0.383) was not significant, while both PANSS-N (p = 0.012) and SCoRS (p = 0.003) coefficients were significant. A multivariate regression including only PANSS-N and SCoRS had an adjusted R-squared of 0.263 and both coefficients were significant ata= 1%.
We also built regression trees for predicting QLS based on each explanatory variable, allowing only one division per variable. The threshold values found for the variables allowed partitioning of the data into two groups in which the measures of quality of life were as similar as possible; in other words, the sum of variances within groups was minimized. Patient were divided according to each variable into statistically different groups at a level of confidence of 1%, as shown in Table 3. PANSS-N and SCoRS presented similar explanatory power, and divided the patients into two groups with arithmetic difference of 17.6 and 19.4 respec-tively between QLS means. PANSS-P had lower explana-tory power with a difference of 12.9 between QLS means. It is interesting to note that patients with PANSS-N o 12 presented the highest QLS mean (70.0), while patients with SCoRSX44 had the lowest QLS mean (44.7). Therefore, based on the simple regression trees, we concluded that patients with low PANSS-N scores had good quality of life, while patients with elevated SCoRS had poor quality of life. Additionally, we built a multivariate regression tree including PANSS-N, PANSS-P, and SCoRS as explana-tory variables, with the constraint that a group needed to have at least 40 patients to get split, in order to avoid model overfitting. As shown in Figure 1, PANSS-P was not found to be a good predictor of QLS when compared to the other variables, and was not entered as a decision variable. The data were initially divided into two groups, considering PANSS-N at a threshold value of 11. The group of patients with PANSS-NX11 was subsequently divided into two additional groups, depending on SCoRS at a threshold value of 44. The three groups obtained had statistically different means at a significance level of 1%, according to the one-way analysis of variance (ANOVA) and Tukey’s honest significant difference (HSD) tests. Again, PANSS-N score o 11 was a predictor of good quality of life, while a SCoRS X 44 was a predictor of poor quality of life. The quality of life of patients with PANSS-NX11 improved significantly with a low SCoRS. Finally, we also built regression trees for predicting each QLS factor (1-social network; 2-occupational level; 3-intrapsychic functioning/interpersonal relationship) based on each explanatory variable, allowing only one division. Again, threshold values for the variables were found in a manner that they partitioned the data into two groups in
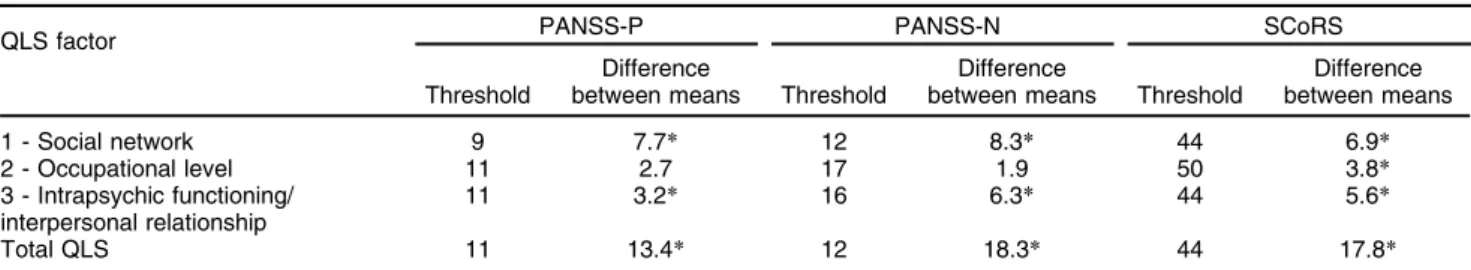
which the measures of quality of life were as similar as possible; in other words, the sum of variances within groups was minimized. Thresholds are shown in Table 4. For factors 1 and 3 (social network and intrapsychic functioning/interpersonal relationship), the patients were divided according to all variables into groups that were statistically different at a level of confidence of 1%, as shown in Table 4. PANSS-N fad the highest explanatory power for both factors, dividing the patients into two groups with a difference of 8.3 between the mean factor 1 QLS scores, and a difference of 6.3 between the mean factor 3 QLS scores. For factor 2, occupational level, only SCoRS divided the patients into statistically different groups at a level of confidence of 1% (mean QLS factor 2 difference of 3.8), as shown in Table 3.
Discussion
We studied a group of individuals with schizophrenia who had a degree of cognitive impairment that is expected for
Table 3 Simple regression trees for PANSS (negative and positive) and SCoRS
Variable Threshold Mean QLS variableothreshold Mean QLS variableXthreshold Difference between means p-value (ttest)
PANSS-P 11 62.6 (n=40) 49.7 (n=39) 12.9 o0.001*
PANSS-N 12 70.0 (n=23) 50.6 (n=56) 19.4 o0.001*
SCoRS 44 62.3 (n=50) 44.7 (n=25) 17.6 o0.001*
PANSS-N = Positive and Negative Syndrome Scale - negative; PANSS-P = Positive and Negative Syndrome Scale - positive; QLS = Quality of Life Scale; SCoRS = Schizophrenia Cognition Rating Scale.
*Significant ata= 1%.
the disease. A recent multicentric study29 including 300 participants with schizophrenia found mean SCoRS ratings and standard deviations that are similar to those reported by us.
The present results indicate that cognitive deficits assessed by SCoRS, and negative symptoms assessed by PANSS are predictors of quality of life in schizo-phrenia. This supports previous results obtained by our group showing that negative symptoms and interview-assessed cognitive deficits represent independent con-structs in patients with schizophrenia.28Our findings also corroborate data in the literature, especially data from studies using objective scales, such as the QLS-BR, to assess quality of life in schizophrenia. Most of those studies, however, used neuropsychological tests to assess cognition.14,30-33Hence, our results indicate that interview-based instruments are also suitable to detect the impact of cognitive impairment on quality of life. This kind of cognitive assessment has obvious advantages over neuropsychological evaluation, especially in clinical settings, since it is easier, faster and does not require extensive training.
In fact, the correlation between cognition as assessed by SCoRS and quality of life found in our study is stronger than that reported by studies that used neuropsychologi-cal tests30-33 and by a meta-analysis.14 Other studies have reported similar results, with interview-based assessment of cognition tending to correlate more strongly with quality of life than performance-based measures.16,27 It is possible that interview-based
cogni-tion assessment has greater sensitivity than neuropsy-chological tests to detect the effects of cognitive deficits on daily life and, consequently, to establish a relationship between cognitive deficits and quality of life. Alternatively, the greater correlation between interview-based mea-sures of cognition and meamea-sures of quality of life may result at least in part from methodological aspects. This is because the effect of non-specific factors (e.g., low motivation) on all interview-based measures is more homogeneous than the effect of non-specific factors on neuropsychological tests. In any case, the use of cognitive interview-based measures seems to be more appropriate to compare the effects of cognition and symptoms on quality of life.
Our study also showed that patients with low level of negative symptoms seem to usually have a good quality of life, independently of cognition. Conversely, among patients
with high levels of negative symptoms, those with higher cognitive impairment have a significantly worse quality of life than those who are more cognitively preserved. This information may be relevant for clinical practice, since it could help clinicians to identify situations in which special attention must be paid to cognitive impairment (i.e., avoid some medications, indicate rehabilitation strategies). Like in previous studies, quality of life was not related to depressive symptoms, and was moderately related to positive symp-toms. It has been shown that depressive symptoms are an important determinant of quality of life in scales that rely on self-assessment, but not in scales completed by an interviewer, as is the case of the QLS-BR.34,35
Based on simple regression trees, we concluded that cognitive deficit assessed by SCoRS significantly predicted the three factors of the QLS scale and was the only significant predictor of QLS factor 2, occupational level. Negative symp-toms assessed by PANSS presented the highest explanatory power for QLS factors 1 and 3, social network and intra-psychic functioning/interpersonal relationship.
This study has some limitations. The sample was relatively small and included clinically stable individuals, with low levels of positive symptoms. Therefore, the results obtained may not be generalized to a more heterogeneous population. Another limitation is that cognitive impairment and quality of life were assessed only by interview-based instruments. The poor insight often observed in patients, as well as the possibility of inaccuracy in informant reports may have influenced the ratings.
In conclusion, interview-based assessment of cognition and negative symptoms were the best predictors of quality of life in schizophrenia. We found that an elevated level of cognitive impairment (interviewer SCoRSX 44) was a predictor of poor quality of life, while a low level of negative symptoms (PANSS negativeo11) was a strong predictor of good quality of life. Elevated cognitive impairment was the only predictor of poor occupational level, while severe negative symptoms were the best predictor of poor social network and intrapsychic function-ing/interpersonal relationship.
Acknowledgements
This word was partially funded by Conselho Nacional de Desenvolvimento Cientı´fico e Tecnolo´gico (CNPq) and Fundac¸a˜o de Amparo e` Pesquisa do Estado de Minas
Gerais (FAPEMIG).
Table 4 Simple QLS factors regression trees for PANSS (negative and positive) and SCoRS
QLS factor PANSS-P PANSS-N SCoRS
Threshold
Difference
between means Threshold
Difference
between means Threshold
Difference between means
1 - Social network 9 7.7* 12 8.3* 44 6.9*
2 - Occupational level 11 2.7 17 1.9 50 3.8*
3 - Intrapsychic functioning/ interpersonal relationship
11 3.2* 16 6.3* 44 5.6*
Total QLS 11 13.4* 12 18.3* 44 17.8*
PANSS-N = Positive and Negative Syndrome Scale - negative; PANSS-P = Positive and Negative Syndrome Scale - positive; QLS = Quality of Life Scale; SCoRS = Schizophrenia Cognition Rating Scale.
Disclosure
The authors report no conflicts of interest.
References
1 Green MF, Kern RS, Braff DL, Mintz J. Neurocognitive deficits and Functional outcome in schizophrenia: are we measuring the ‘‘right stuff’’?. Schizophr Bull. 2000;26:119-36.
2 Sharma T, Antonova L. Cognitive function in schizophrenia. Deficits, functional consequences and future treatment. Psychiatr Clin North Am. 2003;26:25-40.
3 Heslegrave RJ, Awad AG, Voruganti LN. The influence of neuro-cognitive deficits and symptoms on quality of life in schizophrenia J Psychiatry Neurosci. 1997;22:235-43.
4 Awad AG, Voruganti LN. measuring quality of life in patients with schizophrenia: an update. Pharmacoeconomics. 2012;30:183-95. 5 Marwaha S, Johnson S, Bebbington P, Angermeyer MC, Brugha T,
Azorin JM, et al. Correlates of subjective quality of life in people with schizophrenia: findings from the EuroSC study. J Nerv Ment Dis. 2008;196:87-94.
6 Wegener S, Redoblado-Hodge MA, Lucas S, Fitzgerald D, Harris A, Brennan J. Relative contributions of psychiatric symptoms and neu-ropsychological functioning to quality of life in first-episode psychosis. Aust N Z J Psychiatry. 2005;39:487-92.
7 World Health Organization. WHOQOL: measuring quality of life [Internet]. 2016 [cited 2016 Mar 30]. http://www.who.int/healthinfo/ survey/whoqol-qualityoflife/en.
8 Addington J, Addington D. Social and cognitive functioning in psy-chosis. Schizophr Res. 2005;99:176-81.
9 Fujimaki K, Morinobu S, Yamashita H, Takahashi T, Yamawaki S. Predictors of quality of life in inpatients with schizophrenia. Psychiatry Res. 2012;197:199-205.
10 Ojeda N, Sa´nchez P, Pea˜a J, Elizaga´rate E, Yoller AB, Gutie´rrez-Fraile M, et al. An explanatory model of quality of life in schizo-phrenia: the role of processing speed and negative symptoms. Actas Esp Psiquiatr. 2012;40:10-8.
11 Tas C, Brown E, Cubukcuogluc Z, Aydemirc O, Danacic AE, Bru¨ne M. Towards an integrative approach to understanding quality of life in schizophrenia: the role of neurocognition, social cognition, and psy-chopathology. Compr Psychiatry. 2013;54:262-8.
12 Ueoka Y, Tomotake M, Tanaka T, Kaneda Y, Taniguchi K, Nakataki M, et al. Quality of life and cognitive dysfunction in people with schizo-phrenia. Prog Neuropsychopharmacol Biol Psychiatry. 2013;35:53-9. 13 Cruz BF, Salgado JV, Rocha FL. Associac¸o˜es entre de´ficits cognitivos e
qualidade de vida na esquizofrenia. Rev Psiquiatr Clin. 2010;37:233-9. 14 Tolman AW, Kurtz MM. Neurocognitive predictors of objective and subjective quality of life in individuals with schizophrenia: a meta-analytic investigation. Schizophr Bull. 2012;38:304-15.
15 Buchanan RW, Davis M, Goff D, Green MF, Keefe RS, Leon AC, et al. A summary of the FDA-NIMH-MATRICS workshop on clinical trial design for neurocognitive drugs for schizophrenia. Schizophr Bull. 2005;31:5-19. 16 Keefe RS, Poe M, Walker TM, Kang JW, Harvey PD. The Schizo-phrenia Cognition Rating Scale: an interview-based assessment and its relationship to cognition, real-world functioning, and functional capacity. Am J Psychiatry. 2006;163:426-32.
17 Ventura J, Cienfuegos A, Boxer O, Bilder R. Clinical global impres-sion in schizoprenia (CGI-CogS): reliability and validity of a co-primary measure of cognition. Schizoph Res. 2008;106:59-69. 18 Ehmann TS, Goldman R, Yager J, Xu Y, MacEwan GW. Self-reported
cognitive and everyday functioning in persons with psychosis: the
Patient Perception of Functioning Scale. Compr Psychiatry. 2007;48: 597-604.
19 Moritz S, Ferahli S, Naber D. Memory and attention performance in psychiatric patients: lack of correspondence between clinician-rated and patient-rated functioning with neuropsychological test results. J Int Neuropsychol Soc. 2004;10:623-33.
20 Harvey PD, Serper MR, White L, Parrella MJ, McGurk SR, Moriaty PJ, et al. The convergence of neuropsychological testing and clinical ratings of cognitive impairment in patients with schizophrenia. Compr Psychiatry. 2001;42:306-13.
21 Prouteau A, Verdoux H, Briand C, Lesage A, Lalonde P, Nicole L, et al. Self-assessed cognitive dysfunction and objective performance in outpatients with schizophrenia participating in a rehabilitation pro-gram. Schizophr Res. 2004;69:85-91.
22 Amorim P. Mini International Neuropsychiatric Interview (MINI): vali-dac¸a˜o de entrevista breve para diagno´stico de transtornos mentais.
Rev Bras Psiquiatr. 2000;22:106-15.
23 Chaves AC, Shirakawa I. Escala das sı´ndromes negativa e positiva -PANSS e seu uso no Brasil. Rev Psiquiatr Clin. 1998;25:337-43. 24 Bressan RA, Chaves AC, Shirakawa I, de Mari J. Validity study of the
Brazilian version of the Calgary Depression Scale for Schizophrenia. Schizophr Res. 1998;32:41-9.
25 Cardoso CS, Bandeira M, Caiaffa WT, Fonseca JOP. Escala de qualidade de vida para pacientes com esquizofrenia (QLS-BR): adaptac¸a˜o transcultural para o Brasil. J Bras Psiquiatr. 2002;51:
31-8.
26 Cardoso CS, Caiaffa WT, Bandeira M, Siqueira AL, Fonseca IK, Fonseca JOP. Qualidades psicome´tricas da escala de qualidade de vida para pacientes com esquizofrenia: escala QLS-BR. J Bras Psi-quiatr. 2003;52:211-22.
27 Green MF, Nuechterlein KH, Kern RS, Baade LE, Fenton WS, Gold JM, et al. Functional co-primary measures for clinical trials in schi-zophrenia: results from the MATRICS Psychometric and Standardi-zation Study. Am J Psychiatry. 2008;165:221-8.
28 Cruz BF, de Resende CB, Abreu MN, Rocha FL, Teixeira AL, Keefe RS, et al. How specific are negative symptoms and cognitive impairment in schizophrenia? An analysis of PANSS and SCoRS. Cogn Neuropsychiatry. 2013;18:243-51.
29 Keefe RS, Davis VG, Spagnola NB, Hilt D, Dgetluck N, Ruse S, et al. Reliability, validity and treatment sensitivity of the Schizophrenia Cognition Rating Scale. Eur Neuropsychopharmacol. 2015;25:176-84. 30 Bozikas VS, Kosmidis MH, Kafantari A, Gamvrula K, Vasiliadou E, Petrikis P, et al. Community dysfunction in schizophrenia: rate-limiting factors. Prog Neuropsychopharmacol Biol Psychiatry. 2006;30:463-70.
31 Mohamed S, Rosenheck R, Swartz M, Stroup S, Lieberman JA, Keefe RS. Relationship of cognition and psychopathology to func-tional impairment in schizophrenia. Am J Psychiatry. 2008;165: 978-87.
32 Perlick DA, Rosenheck RA, Kaczynski R, Bingham S, Collins J. Association of symptomatology and cognitive deficits to functional capacity in schizophrenia. Schizophr Res. 2008;99:192-9.
33 Savilla K, Kettler L, Galletly C. Relationships between cognitive def-icits, symptoms and quality of life in schizophrenia. Aust N Z J Psy-chiatry. 2008;42:496-504.
34 Fitzgerald PB, de Castella AR, Filia K, Collins J, Brewer K, Williams CL, et al. A longitudinal study of patient- and observer-rated quality of life in schizophrenia. Psychiatry Res. 2003;119:55-62.