Abstract—The bar code image captured by CMOS camera has natural disadvantage such as low resolution, blur, low contrast etc. To recognize this kind of image, locating the transition between the elements of 2D bar code becomes the key algorithm which affects the speed and performance. Nowadays locating algorithms are either not effective enough to cope with image captured by CMOS camera or too complex to implement for embedded application. This article provides an improved algorithm which integrates global threshold and low-pass filter. This algorithm is relatively simple and effective. It can locate the transition between the elements of a bar code quickly and accurately.
Index Terms—PDF417 bar code, locate transition, CMOS Camera
I. INTRODUCTION
More than thirty kinds of 2D bar code have been created since Code 49 was introduced in 1980. So far, several kinds of 2D bar code has been used all over the world, e.g. PDF417, QR code, Code 16K, DataMatrix, ShotCode.
It is preponderant to select PDF417 bar code as portable device 2D bar code. Firstly, PDF417 bar code was the international standard and our national standard. Secondly, compared with QR code, PDF417 bar code requests a lower hardware configuration of portable device, e.g., it does not need Macro lens.[1] Thirdly, PDF417 bar code has a more extensive scope of application than DataMatrix, such as internet link, card, Email and SMS. Last but not the least important, PDF417 bar code has been used widely in all aspects of social and economic life.
In parallel to the development of 2D barcode, more convenient and lower cost method such as using CMOS or CCD camera to identify bar code was invented to substitute
tradition laser scanners. Using CMOS camera for bar code recognition application becomes popular in recent year, because it’s smaller and cheaper to install within portable
device such as mobile phone or asset tracker. However, image captured by CMOS camera is less clearly than image
captured by CCD, creating difficulty for the recognition. Fig.1. shows gray scale data of bar code B within image captured by both CCD and CMOS camera. C represents one line gray scale data by scanning the image captured by a CCD Manuscript received December 8, 2008. This work was supported in part by Cyan Technology Ltd., UK.
Li He is with the Beijing Jiaotong University, Beijing, China 100044 (corresponding author to provide phone: +86 158 1026 4518; e-mail: 05120009@ bjtu.edu.cn).
Xiaoli Hao was with Beijing Jiaotong University, Beijing, China 100044. (e-mail: [email protected]).
Fig.1. Locating the transition between bar code elements camera. S represents one line gray scale data by scanning the image captured by a CMOS camera. Comparing to sharp transitions of sequence C, transitions of sequence S are much slower.
To locate the bar code and transition between the barcode elements is a major task for bar code recognition. In Fig.1., by locating the transition of sequence S or C can produce a 0-1 sequence D which includes digit information that can be decoded in next stage. For CCD camera image this locating task is relatively simple, but for CMOS camera image it becomes more complex due to exist of several non-ideal factors. The first non-ideal factor is printed bar code is easily become polluted. Optical bar code is printed on the package or merchandise that usually been polluted. Another non-ideal factor is because most CMOS cameras use fixed focal length, if distance between bar code and camera is larger or smaller than this length the image can become blur. Also the brightness and contrast would be a problem as insufficient lighting condition on portable device. All these factors should be considered for the recognition algorithm of CMOS camera image.
Following section II reviewed related methods used for locating bar code transition in CCD camera image, and explained the reason that why it’s not suitable for processing CMOS camera image. Section III provided an improved method that combined advantages of methods used for processing CCD camera image. This method reached a balance between complexity and effect dealing with CMOS camera image and embedded environment.
II. RELATED LOCATING METHOD
A. Global threshold
Global threshold is widely used in the binarization of bar code image. Ostu global dynamic threshold is one that commonly used for bar code recognition. [2] used this kind of method in a CCD camera application.
Global threshold has advantages such as relatively easy to execute and acceptable speed. But it also has some defeats that only use this method is not capable for bar code image recognition with CMOS camera.
Method for Fast Locating the Transition between
Elements of PDF417 Bar Code by CMOS camera
Li He, Member, IAENG, Xiaoli Hao
Proceedings of the International MultiConference of Engineers and Computer Scientists 2009 Vol I IMECS 2009, March 18 - 20, 2009, Hong Kong
Fig.2. Using global threshold
Fig.2. shows a concrete example of locating the transitions in image captured by CMOS camera using global threshold. First global threshold T is calculated using whole image or part of image contains bar code B. During the scanning of bar code B, global threshold is used to distinguish black and white, thus to say, to binarize. Peaks above the threshold are recognized as space, and bottoms below the threshold are recognized as bar.
However, several peaks and bottoms, such as 1,2,3 shown in the Fig.2., have been ignored during scanning due to the peaks are below global threshold. This is because width of bar 1,2 and space 3 are not large enough and easily become out of focus in image. The information loss in the process of recognition caused by inaccurate global threshold method convinced that it’s not capable for scanning CMOS camera images.
Also, scanning the whole image for calculating Ostu threshold is an intensive task for embedded hardware. An improved global threshold calculation method is introduced in next section for bar code recognition.
B. Double low-pass filters
A more reliable double low-pass filter method is introduced in [3] for locating the transition of bar code elements. Two FIR filters are used to implement accurate locating algorithm of CCD camera/video signal. Fig.3. shows the block diagram of this method.
However, there are two major defeats by using this method to cope with image captured by CMOS camera. First is the complexity. Carrying on two parallel low pass filter algorithms along with comparing value of each is time consuming in real-time system. Comparison of Performance of this method and improved method is shown in section IV. Second, errors could happen in locating the transition. In
Fig.4., an example is explained that information loss happened due to the low resolution/low contrast of image.
Fig.3. Double LP filters method
Fig.4. Locating transition using double LP method
B is a part of PDF417 bar code cropped from a CMOS camera image. Part of the bar code has very low contrast and brightness due to low resolution and not sufficient lighting. S
is the scaned gray scale signal from this part of bar code, F1
and F2 are two sequences output of two low pass filters. As described in [3], transition of bar and space is decided by the middle of cross point of F1 and S and cross point of F2 and S
on the same side of a peak. However, as shown image, transition 1 and 2 are disregarded by the algorithm because there is no cross point of F2 and S in that part. Because pass frequency of F2 usually lower than F1, unsuccessful choose of F2 might lose critical signal information. In this situation, this method is not reliable enough to deal with blur image. Also, because there is no upper or lower limit of bar code gray scale information, redundant information from area outside of barcode or sharp noise within barcode would be concerned as useful information as well. Thus extra validation of scanning data algorithm is needed. This algorithm would increase the complexity of entire algorithm. III. IMPROVED LOCATING METHOD
Improved locating method introduced in this paper integrated advantages of both global threshold and low pass filter algorithm. It’s more effective than merely using global threshold and simpler than using two low pass filters. Following part describes principle first, and detail algorithm is given.
A. Principle
In ideal situation, consider a transition from bar to space as a part of step sequence, defined as
⎩
⎨
⎧
≥ < = t i i t i i i I , 1 , 0 ][ (1) Signal after FIR filter is:
0 ( ) 1
2 / 2 / {[ ] ( )} 1 ]
[ ∑ < <
+ −
= −
= a j
N i
N i
j I j ai j N
i
F (2)
] [i
F indicates signal after filter, I[j] is input signal numberj. a(j) is parameter and N represents level of filter. Then
⎩
⎨
⎧
⎩
⎨
⎧
≥ < < > = ≥ < < > = ∑ + = = ∑ + = ⋅ + ∑− − = ⋅ = t i i i I t i i i I t i i t i i N i t i j a j NN i
t i
j a j
t i
N i
j a j
N i F ], [ ], [ , 1 , 0 2 / ) ( 1 2 / )] ( 1 1 2 / 0 ( ) [
1 ] [
(3)
Proceedings of the International MultiConference of Engineers and Computer Scientists 2009 Vol I IMECS 2009, March 18 - 20, 2009, Hong Kong
Fig.5. Improved locating method
So the task to locate it becomes to find the point that F[i] changes from larger than I[i] to smaller than I[i] . A comparator use F[i] and I[i] can simply solve the problem. As illustrated in Fig.5., the transitions of bar and space appear as cross point of sequence S and F. S represents original signal and F represents output signal of low pass filter. Using single low pass filter rather than two filters can successfully located transition 1 and 2. In Fig.4. these two transitions have been ignored by two filters algorithm.
However, cross points 3, 4, 5 appeared on Fig.5. are not the transitions of bar and space. This is a defeat of using single filter. But this problem can be solved by define the range of cross points that represent transition of bar and space. Calculated from global threshold, upper threshold TU and lower thresholdTL, as shown in Fig.5., are used to limit the range of transition, then successfully filter the cross points that not indicate the transition of bar and space.
B. Algorithm design
Fig. 6. shows the block diagram of this method. First, gray scale data S passes through a range limit. This range limit is calculated from the central part of image and used to filter the redundant information that not necessary for processing.
Second, data will pass a FIR low pass filter. Then the output sequence of low pass filter and original signal are used as two inputs of comparator 1. Output of comparator is the binary information that represents bar code information. Detail of each step is:
1) Range limit
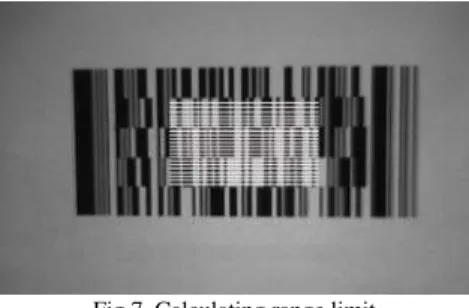
As described in section A, a range limitation composed of upper threshold and lower threshold is used as first step of processing scanning data. However, using every pixel information of whole image to calculate this range limit is time consuming. Actually, by using only important part of image is enough to provide approximate value of global threshold. Normally, 2D bar code occupies the centre part of image, as illustrated in Fig.7. Scanning central part of this image (one line in every 2-3 lines) can get adequate pixel information contains gray scale information of bar code. This can reduce the calculation dramatically to at least 1/10 of calculation required to deal with whole image.
Fig.6. Block diagram of Improved method
Fig.7. Calculating range limit
Then, OSTU global threshold method [4] is used to calculate the global threshold. The result of this method provides not only global threshold but also maximum and minimum value of histogram. Then upper threshold and lower threshold of range limit are calculated as below:
2 max
T T U T
+
= ,
2 min
T T L T
−
= (4)
Trepresents global threshold, Tmaxis max gray value and min
T is min gray value.
2) Low pass filter design
In order to calculate the parametera(j)in equation (2), pass
f andfstopof FIR filter should be calculated below:
min max
w H
f = ,
max min
w H
f = ,fpass = fmin,fstop = fmax (5) As shown in Fig.8., Hrepresents max width of image, which also means the max pixel width of bar code. wminis the thinnest width of a bar and wmax is the widest width of a bar. Then set fmin as fpass,fmax as fstop. (Fig.9.)
Also, this filter should be a linear phase FIR filter. Impulse response of N level FIR filter h[i] needs to satisfy the necessary and sufficient condition:
] [ ]
[i h N i
h =± − (6) With these key parameters, a FIR low pass filter can designed to use in locating method. In addition, parameters
) (j
a in equation (2) are fixed values according to the resolution of CMOS camera.
Fig.8. Width of bar code elements
Fig.9. FIR filter design
Low Pass Filter
Range Limit S
1 +
-Proceedings of the International MultiConference of Engineers and Computer Scientists 2009 Vol I IMECS 2009, March 18 - 20, 2009, Hong Kong
Table.1 Performance Comparison
Method Average recognition time Decoding successful rate
Global threshold 0.5s 14%
Two low pass filters 2.9s 78%
Improved method 1.1s 84%
IV. EXPERIMENT RESULT
By realizing three methods respectively on a 64MHz 16bit Microcontroller with a 0.3 Million pixels CMOS camera (640 x 480 resolution), a comparison is drawn in Table.1. (Tested on 50 images, in which sized of PDF417 is ranged from 30 characters to 120 characters, and max security level 4.)
By integrating and improving original two methods, this improved method appears more effective and efficient. Comparing to global threshold method, this method has advantage of accurately locating the transition of bar and space, obviously more effective. Also, the range limit calculation in this method requires much less calculation than original method. Comparing to two low pass filters algorithm, the improved method can locate the transition of bar and space more accurately while only use one low pass filter, and more efficient.
In order to further improve decode success rate, detail of improved method can be improved by carefully research of how to define range limit and design of FIR filter using different window types. In addition, multiple scan lines can be used to guarantee the accuracy of detecting bar code element width.
Also, adaptability of improved method is evaluated under varies situation using CMOS camera. There include transformation of bar code, low brightness, interfere of text on image, line drawing on the bar code. For these conditions, even some serious drawing on the image could fail the algorithm; the improved method has a relatively good adaptability dealing with image captured by CMOS camera. In all, improved method combined the advantage of two methods used for CCD camera images has a realistic better performance. It’s more suitable for embedded application and also more adaptive to low cost and low resolution CMOS camera than previous method.
REFERENCES
[1] Bilcu R.C., Burian A., Vehvilainen M, “Image pre-processing for bar code detection in mobile devices”, 2006 IEEE International Conference on Acoustics, Speech and Signal Processing, vol. 3, pp. 3, 2006.
[2] Stephen J.Shellhammer, Ming-Hua Chen, Arman Nikzad, “Method and apparatus for decoding two-dimension barcode using ccd/cmd camera” [P].US: 5,319,181, 1992.6
[3] Michele Benedettim, “Method for locating the transition between the elements of a bar code” [P].US: 6,834,806, 2001.12
[4] Ostu N., “A threshold selection method from gray-level histogram”,IEEE Trans, 1979
Proceedings of the International MultiConference of Engineers and Computer Scientists 2009 Vol I IMECS 2009, March 18 - 20, 2009, Hong Kong