Submitted9 December 2015
Accepted 31 January 2016
Published22 February 2016
Corresponding author
Michael O. Harris-Love, [email protected], [email protected]
Academic editor
Justin Keogh
Additional Information and Declarations can be found on page 17
DOI10.7717/peerj.1721
Distributed under
Creative Commons Public Domain Dedication
OPEN ACCESS
Ultrasound estimates of muscle quality in
older adults: reliability and comparison
of Photoshop and ImageJ for the
grayscale analysis of muscle echogenicity
Michael O. Harris-Love1,2,3, Bryant A. Seamon1,4, Carla Teixeira1,5and
Catheeja Ismail1,2
1Muscle Morphology, Mechanics and Performance Laboratory, Clinical Research Center, Washington DC
Veterans Affairs Medical Center, Washington, DC, United States
2Department of Exercise and Nutrition Sciences, Milken Institute School of Public Health,
George Washington University, Washington, DC, United States
3Geriatrics and Extended Care Service, Washington DC Veterans Affairs Medical Center, Washington, DC,
United States
4Physical Medicine & Rehabilitation Service, Washington DC Veterans Affairs Medical Center, Washington,
DC, United States
5The School of Kinesiology and Health Studies, Queen’s University, Kingston, Ontario, Canada
ABSTRACT
Background. Quantitative diagnostic ultrasound imaging has been proposed as a method of estimating muscle quality using measures of echogenicity. The Rectangular Marquee Tool (RMT) and the Free Hand Tool (FHT) are two types of editing features used in Photoshop and ImageJ for determining a region of interest (ROI) within an ultrasound image. The primary objective of this study is to determine the intrarater and interrater reliability of Photoshop and ImageJ for the estimate of muscle tissue echogenicity in older adults via grayscale histogram analysis. The secondary objective is to compare the mean grayscale values obtained using both the RMT and FHT methods across both image analysis platforms.
Methods. This cross-sectional observational study features 18 community-dwelling men (age=61.5±2.32 years). Longitudinal views of the rectus femoris were captured using B-mode ultrasound. The ROI for each scan was selected by 2 examiners using the RMT and FHT methods from each software program. Their reliability is assessed using intraclass correlation coefficients (ICCs) and the standard error of the measurement (SEM). Measurement agreement for these values is depicted using Bland-Altman plots. A paired t-test is used to determine mean differences in echogenicity expressed as grayscale values using the RMT and FHT methods to select the post-image acquisition ROI. The degree of association among ROI selection methods and image analysis platforms is analyzed using the coefficient of determination (R2).
using the RMT and FHT ROI selection methods in ImageJ. Uniform coefficients of determination (R2=.96–.99,p< .001) indicate strong positive associations among the grayscale histogram analysis measurement conditions independent of the ROI selection methods and imaging platform.
Conclusion. Our method for evaluating muscle echogenicity demonstrated a high degree of intrarater and interrater reliability using both the RMT and FHT methods across 2 common image analysis platforms. The minimal measurement error exhibited by the examiners demonstrates that the ROI selection methods used with Photoshop and ImageJ are suitable for the post-acquisition image analysis of tissue echogenicity in older adults.
SubjectsEvidence Based Medicine, Geriatrics, Kinesiology, Radiology and Medical Imaging
Keywords Ultrasound, Grayscale histogram analysis, Muscle echogenicity, ImageJ, Photoshop, Geriatrics
of muscle quality via echogenicity measures has been used as a means to discriminate among individuals with and without muscle abnormalities (Whittaker et al., 2007;Pillen & Van Alfen, 2011). Echogenicity measures have demonstrated value in the assessment of neuromuscular diseases, and may be an important factor in observed muscle performance deficits in older adults (Zaidman et al., 2010;Fukumoto et al., 2012;Ismail et al., 2015).
While echogenicity values can be derived from the digital backscattered radio-frequency (RF) signal, this approach is rarely viable in clinical environments due to the limitations of many commercial ultrasound machines and the need for custom signal processing (Zaidman, Holland & Hughes, 2012). Consequently, the quantitative estima-tion of echogenicity in clinical settings is often through grayscale histogram analysis. This imaging analysis technique involves the construction of a plot featuring the number of pixels associated with a given region of interest (ROI) within intervals determined by intensity level (Pillen et al., 2009;Iftekharuddin & Awwal, 2012). Post-image acquisition analysis may be performed using a variety of image editing programs. A commonly cited program for grayscale histogram analysis is Photoshop (Adobe Systems, San Jose, CA), which has been broadly used for clinical applications ranging from the quantitative analysis of endothelial damage to the measurement of skeletal muscle echogenicity in older adults (Saad et al., 2008;Watanabe et al., 2013;Casella et al., 2015). A widely used alternative to the commercially available Photoshop program is ImageJ, a public-domain Java-based image processing and analysis program developed by Wayne Rasband of the National Institute of Mental Health at NIH (Rasband, 1997;Schneider, Rasband & Eliceiri, 2012). ImageJ has been extensively used for image processing in immunohistochemistry (Schneider, Rasband & Eliceiri, 2012), tissue segmentation in microscopy images (Collins, 2007), and muscle morphometry measurements (Fortin & Battié, 2012). Photoshop and ImageJ have both been cited as being among the most frequently used image processing and analysis programs (Nanes, 2015). Moreover, the origin of ImageJ within a Federal biomedical institution allows for the download of the program through the Veterans Health Administration network security system, thus facilitating its use within Veterans Affairs medical centers. Many image analysis platforms are available and vary based on file type constraints, software customization and flexibility, hardware requirements, cost limitations, and image visualization needs (e.g., confocal microscopy, CT imaging, sonography, etc.). Options range from commercially available software such as Analyze (AnalyzeDirect, Inc., Kansas, USA) and sliceOmatic (TomoVision, Canada), to open source software options such as OpenCV, GNU Image Manipulation Program, the Medical Imaging Interaction Toolkit, MIPAV (Medical Image Processing, Analysis, and Visualization), and OsiriX. Photoshop and ImageJ are featured in this report given their availability at our Federal hospital and because the software capabilities are appropriate for the grayscale histogram analysis required to estimate echogenicity in sonographic images. In addition, the selected image analysis platforms allow for a comparison between a widely used commercial software program and an established open source option.
segments that closely align with the targeted anatomical or morphological structure. In this work, the ‘‘Rectangular Marquee Tool’’ (RMT) is the term used to describe the Rectangular Marquee selection method in Photoshop and the Rectangular selection method in ImageJ. Similarly, the ‘‘Free Hand Tool’’ (FHT) is the term used to describe the Magnetic Lasso Tool (which requires manual adjustments to the semi-automated ROI selections) in Photoshop and the fully manual Freehand selection method in ImageJ. Both ROI selection methods have relative advantages related to the examiner time used to determine the tissue boundaries included in the analysis (RMT), and the accuracy of the selected ROI based on the fascial borders of the targeted muscle (FHT). There is a need to determine if direct comparisons can be made between software programs for the ROI selection used to obtain mean grayscale values. Moreover, it is uncertain if meaningful intrarater or interrater differences exist in the measurement of mean grayscale values based on the post-image acquisition ROI selection method (i.e., RMT versus FHT). Therefore, the primary objective of this study is to determine the intrarater and interrater reliability of Photoshop and ImageJ for the estimate of muscle tissue echogenicity in older adults via grayscale histogram analysis. The secondary objective was to compare the mean grayscale values obtained using both the RMT versus FHT across both image analysis programs.
MATERIALS AND METHODS
Study design and setting
This cross-sectional observational study was conducted to determine the reliability and agreement of echogenicity measures at the rectus femoris of older male veterans at a VA Medical Center. Image acquisition was completed in a clinical environment within an outpatient unit of a Physical Medicine and Rehabilitation department. Post-image acquisition analysis was undertaken within a laboratory at the medical center.
Participants
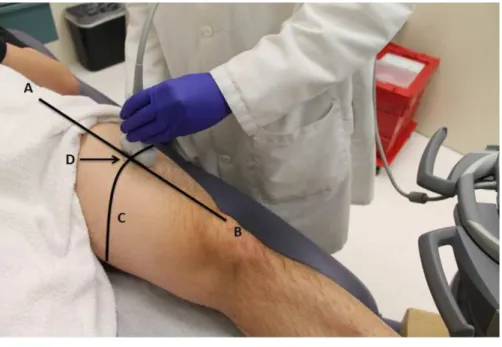
Figure 1 Participant positioning during ultrasound scanning procedure.The scanning site on the ante-rior surface of the thigh (dominant side) was located by obtaining a measurement in cm from the anteante-rior superior iliac spine (A) and the superior pole of the patella (B). This measurement distance was bisected (C) and the midpoint of line was marked with an indelible marker. The participant was then positioned on a plinth in supine with the leg fully supported. A linear ultrasound transducer was placed at the marked scanning site (D) and the transducer was positioned to capture a longitudinal view of the rectus femoris as depicted in the figure. A sufficient amount of water-soluble transmission gel was used during scanning for optimal acoustic contact with the imaging site, and minimal pressure was applied to the sound transducer in order to limit tissue deformation.
Procedures
calibration phantom, and high interrater reliability (ICC2,k =.992,p< .001) for the
assessment of echogenicity at the rectus femoris via grayscale histogram analysis ( Harris-Love et al., 2015).
The two examiners responsible for post-image acquisition analysis independently measured the echogenicity of the rectus femoris in the longitudinal view. Mean grayscale values were obtained for each scan using two image editing programs: Photoshop (version 6.0) and ImageJ (version 1.48). Each examiner selected the ROI for each scan using the Rectangular Marquee Tool (RMT) and the Free Hand Tool (FHT). The measurement procedure included obtaining the ROI within the superior and inferior fascial borders of the muscle and the lateral borders of the muscle defined by the field of view, as adapted from Pillen and associates (2003). In select instances when a portion of a fascial border was poorly visualized, the examiner used the trajectory of the visible fascial border to complete the ROI selection. Additionally, the geometric configuration of the RMT ROI was not expected to perfectly conform to the fascial planes of the rectus femoris. There-fore, the examiners were instructed to maximize the congruency between the selected ROI using the RMT and the superior and inferior fascial borders of the muscle (Fig. 2). All intrasession grayscale measures were completed twice and the mean value was used for the data analysis. The assessment order for each image was separately randomized for each examiner to minimize measurement bias (VassarStats random number generator) (Lowry, 2004), and the assessment sessions were separated by one week to minimize the effects of recall on the selection of the ROI. Masking was employed regarding the initial measurement values, and no information concerning the results of the grayscale histogram analysis was shared between the examiners during the data collection period.
Data analysis
All data and variance distributions are normal based on the Shapiro–Wilk and Levene’s tests, and conveyed as means and standard deviations. Echogenicity levels are expressed as grayscale values (0–255, unitless values). The relative reliability of the examiners for the grayscale histogram analysis is estimated using intraclass correlation coefficients (ICC). The ICC2,k is used to determine the interrater reliability using a 2-way mixed model
absolute agreement approach, and the ICC3,k is used to determine the intrarater reliability
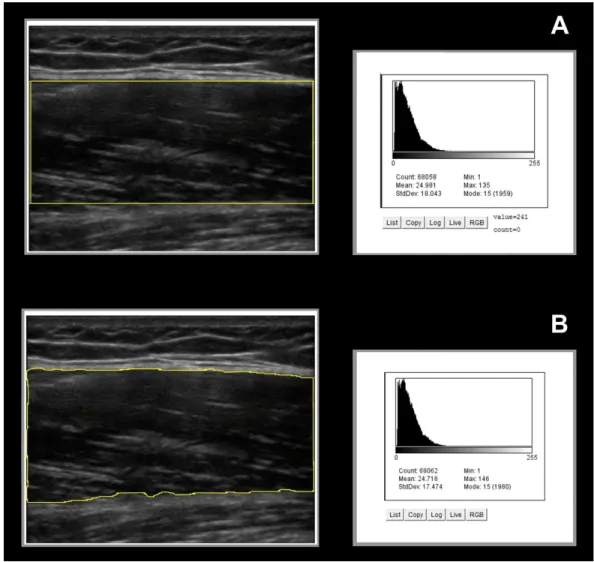
Figure 2 Image analysis ROI selections and the corresponding grayscale histogram values.The exem-plar longitudinal images of the rectus femoris feature an overlay graphic of the ROI selection using the Rectangular Marquee Tool (A) and Free Hand Tool (B) provided by the ImageJ software. The correspond-ing grayscale histogram analysis data for each sonographic image shows similar estimates of rectus femoris echogenicity using both ROI selection methods. (ROI, region of interest. Post-analysis image enhance-ment used only to emphasize the ROI selection borders in the figure.)
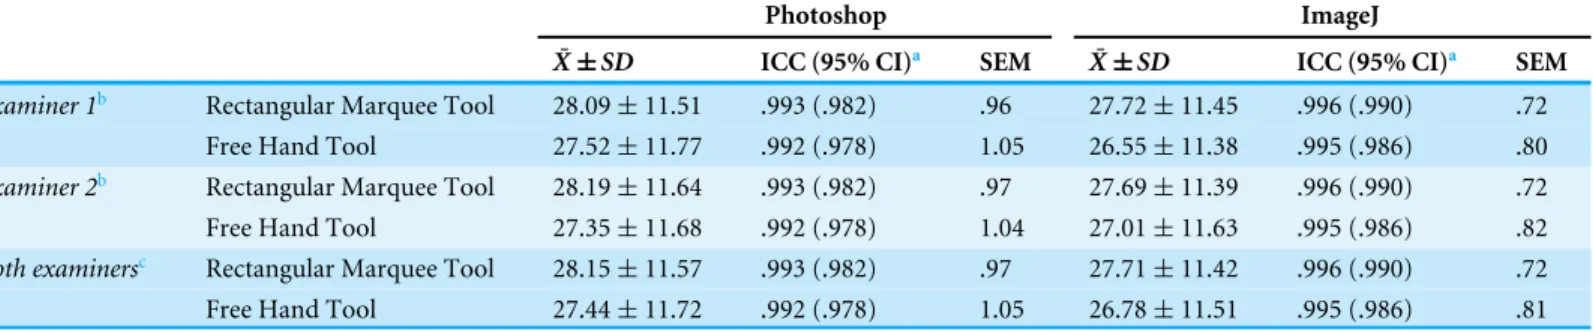
Table 1 Intrarater and interrater reliability for grayscale histogram analysis.Relative reliability of the ROI selection method for grayscale his-togram analysis is determined using intraclass correlation coefficients (ICC), and absolute reliability is expressed via the standard error of measure-ment (SEM). Both the Rectangular Marquee Tool and Free Hand Tool displayed comparable levels of reliability across image processing platforms and examiners, with the echogenicity estimates obtained with ImageJ software exhibiting slightly lower SEM values. Measurement values are in grayscale levels.
Photoshop ImageJ
¯
X±SD ICC (95% CI)a SEM X¯
±SD ICC (95% CI)a SEM
Examiner 1b Rectangular Marquee Tool 28.09±11.51 .993 (.982) .96 27.72±11.45 .996 (.990) .72
Free Hand Tool 27.52±11.77 .992 (.978) 1.05 26.55±11.38 .995 (.986) .80
Examiner 2b Rectangular Marquee Tool 28.19±11.64 .993 (.982) .97 27.69±11.39 .996 (.990) .72
Free Hand Tool 27.35±11.68 .992 (.978) 1.04 27.01±11.63 .995 (.986) .82
Both examinersc Rectangular Marquee Tool 28.15±11.57 .993 (.982) .97 27.71±11.42 .996 (.990) .72
Free Hand Tool 27.44±11.72 .992 (.978) 1.05 26.78±11.51 .995 (.986) .81
Notes.
aone-sided lower limit (CI=confidence interval). bICC
3,kused to determine intrarater reliability.
cICC
2,kused to determine interrater reliability. p< .001 for all ICC values.
(SEM, standard error of the measurement).
RESULTS
Grayscale histogram analysis reliability and measurement error The examiners demonstrated excellent reliability using the RMT and FHT methods to select the ROI across both image analysis platforms. The intraclass correlation coefficients (ICCs) ranged from .97 to .99 (p< .001; lower bound 95% CI) for both intrarater and interrater measurement performance. The aggregate measures for both examiners reveal that mean grayscale values differed by 1.6% for Photoshop in comparison to ImageJ when using the RMT method to select the ROI. The mean grayscale values differed by 2.5% across these image analysis platforms when using the FHT method to select the ROI. Measurement error for both ROI selection methods was nominal when using either Photoshop or ImageJ for grayscale histogram analysis. The SEM for Photoshop was .97 and 1.05 grayscale levels when using the RMT and FHT ROI selection methods, respectively. Comparatively, the SEM values were .72 and .81 grayscale levels, respectively, when using the RMT and FHT ROI selection methods in ImageJ. The data regarding grayscale histogram analysis reliability and measurement error is presented inTable 1.
Examiner agreement based on ROI selection method and image analysis platform
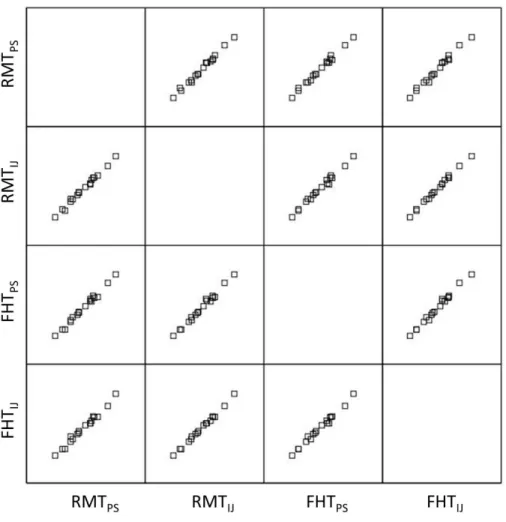
The Bland-Altman plots in Fig. 4 show the agreement between the grayscale measurements for both examiners using each ROI selection method during image analysis in Photoshop or ImageJ. The observed limits of agreement were wider for both the RMT and FHT ROI selection method when using Photoshop in comparison to ImageJ. Considering the data from both examiners, the mean difference between the echogenicity estimates obtained with the RMT method in Photoshop versus ImageJ was .44 grayscale levels (95% CI [.06–.82];p< .03). In comparison, the mean difference between the echogenicity estimates obtained with the FHT method in Photoshop versus ImageJ was .66 grayscale levels (95% CI [.21–1.10];p< .001). Visual analysis of the Bland-Altman plots inFigs. 3and4reveal that≤ 2 measurements were outside the limits of agreement, and no systematic errors were observed. In addition, the matrix scatter plots (Fig. 5) depict uniform coefficients of determination (R2=.96 to .99,p< .001) that indicate strong positive associations among the grayscale histogram analysis measurement conditions independent of the ROI selection methods and imaging platform.
DISCUSSION
Figure 4 Interrater Bland-Altman plots for two examiners.The Bland-Altman plots depict the agree-ment between two novice examiners obtaining the grayscale analysis measures for the rectus femoris mus-cle. Plots are provided showing the observed measurement agreement using both of the image process-ing platforms, and ROI selection methods. The mean of the measures obtained from both examiners is depicted on thex-axis. The difference between the means of these measures are depicted on they-axis. The mean difference and limits of agreement (1.96·standard deviation) are represented by the horizontal lines parallel to thex-axis. (ROI, region of interest; PS, Photoshop; IJ, ImageJ; RMT, Rectangular Marquee Tool; FHT, Free Hand Tool; diff., difference; grayscale level range = 0–255.)
adults is garnering greater attention as a viable approach to characterize muscle quality (Marcus, Addison & LaStayo, 2013;Harris-Love et al., 2014b;Hamaguchi et al., 2014).
Indeed, quantifying muscle quality based on tissue composition may provide insights about a wide array of conditions associated with increasing age. Diminished muscle tissue composition, as measured by CT imaging at the mid-thigh and expressed as mean Hounsfield units (HU), may be associated with critical musculoskeletal health outcomes such as hip fracture incidence. An increased relative risk (RR) of hip fracture (RR/SD=
Figure 5 Matrix scatter plots across both image processing platforms and ROI selection methods.The matrix scatter plots show the relationships among the grayscale values obtained by Examiner 1 using both of the image processing platforms and ROI selection methods. The coefficient of determination (R2) val-ues for all linear regression analyses within the matrix were .96–.99 (p< .001). Specific matrix
combi-nations such as RMTPS×RMTIJand FHTPS×FHTIJsuggest that similar ROI selection methods were
highly associated across imaging platforms. Also, matrix combinations such as RMTPSx FHTPSand RMTIJ
×FHTIJindicate that differing ROI selection methods using Photoshop or ImageJ yield significant
posi-tive relationships. (ROI, region of interest; PS, Photoshop; IJ, ImageJ; RMT, Rectangular Marquee Tool; FHT, Free Hand Tool.)
The implementation of research findings concerning the assessment of muscle quality is dependent on identifying an accessible modality with a minimal testing burden. The clinical assessment of muscle quality using quantitative ultrasound has been explored, perhaps the most extensively, in the neuromuscular diseases (Pillen & Van Alfen, 2011). Sonographic methods have been used to aid the diagnosis of individuals with suspected neuromuscular disease. In a prospective study involving 150 symptomatic children, echogenicity derived from 4 scanning sites was used to effectively discriminate between those with and without the diagnosis of neuromuscular disease (Pillen et al., 2007). In addition, the use of quantitative ultrasound has demonstrated responsiveness in monitoring the progression of muscle pathology. Increased echogenicity corresponds with the advancement of dystrophic muscle changes in boys with Duchenne muscular dystrophy over a follow up period spanning approximately 2 years (median follow-up=27.5 months, interquartile range
independent criterion for presarcopenia and as an element of the sarcopenia staging process by the EWGSOP and other consensus groups may warrant further study.
In this report, two commonly used software programs (Photoshop and ImageJ) were examined to determine the reliability and measurement error associated with assessing echogenicity via grayscale histogram analysis. Moreover, the influence of the ROI selection methods on measurement reliability and agreement was also investigated. The results indicate that the two novice examiners demonstrated excellent intrarater and interrater reliability in the measurement of rectus femoris echogenicity via grayscale histogram analysis. The lower bound 95% CI of the ICC values all exceeded .97 (p< .001) using both the RMT and FHT selection method for the ROIs in both image analysis platforms. Overall, the limits of agreement were better for the RMT method in comparison to the FHT method, and smaller measurement errors were observed with echogenicity estimates calculated with ImageJ. Nevertheless, the statistically significant differences between the image analysis platforms and the ROI selection methods used in this study represent small absolute and proportional error estimates. The estimated measurement errors appear to be suitable for clinical and research use as the SEM values were between .72 and 1.05 grayscale levels for images with mean grayscale values that ranged from 26.55±11.38 to 28.19±11.57. These observed interrater measurement errors are approximately 2.6% to 4.0% of the mean grayscale values obtained from the study sample. To place these values into proper context, it may be useful to consider how estimates of muscle quality based on muscle echogenicity may distinguish between adults with relatively high and low muscle performance. Our recent findings suggest that women with high indices of grip strength in proportion to body weight exhibit low levels of muscle echogenicity as estimated with grayscale histogram analysis. Stronger women in the sample had grayscale values of 38.0
±17.0, whereas weaker women had grayscale values of 58.5±21.0 (Ismail et al., 2015). The preliminary results indicate that the group differences in the mean grayscale values, which may distinguish between high and low muscle performance in older adults, far exceed the measurement errors using Photoshop and ImageJ cited in this study.
In addition, the matrix scatter plot and the associatedR2values show a high degree of association across ROI selection methods and the image analysis platforms. The strong association between the ROI selection methods is likely to be influenced by the longitudinal scanning images of the rectus femoris used in the analyses (Fig. 2). Both ROI selection methods have relative advantages, as the RMT method may confer benefits regarding the time needed to determine the tissue boundaries included in the analysis, and the FHT method may provide accuracy of the selected ROI based on the fascial borders of the targeted muscle. The square or rectangular appearance of the longitudinal rectus femoris image provided uniform fascial borders and a field of view for ROI selections that were readily captured using both the FHT and RMT methods. This image uniformity was reflected in the similar mean values and variance estimates of the ROI selection methods. However, the advantage of using the FHT method may be more apparent in clinical circumstances that require the ROI selection of tissue with complex anatomical borders.
2012;Shklyar et al., 2015;Sarwal et al., 2015;Caresio et al., 2015). Nevertheless, important differences in the assessment methodology found in the literature merit additional consideration. Echogenicity values may be affected by external factors such as the angle of the transducer with respect to the skin surface and underlying muscle bundles, the scanned image orientation (e.g., longitudinal or transverse), and the configuration of the ROI (Zaidman et al., 2008;Harris-Love et al., 2014a). Similar to this study, Caresio and associates (2015)examined the reliability of grayscale histogram analysis at the rectus femoris. Their previous work involved 20 healthy young adults and featured a maximum ROI selection method that parallels the FHT method featured in this study, along with other ROI permutations including a smaller rectangular ROI. The investigators attained acceptable reliability using their method as their ICC values were .78–.86, with a coefficient of variation (CV) ranging from 7.9% to 10.7%. The modest differences in the reliability coefficients of Caresio et al. and the findings reported in this study may be attributed to their use of transverse view images in contrast to the longitudinal view images used in the present work. Zaidman and colleagues(2008), who conducted a study involving the ultrasound imaging of the elbow flexors in 20 healthy adults, suggested that measurements involving longitudinal view images may be more reliable than the use of transverse view images. Using their technique to relate grayscale levels to backscatter via the calculation of calibrated muscle backscatter values (cMBs expressed as GSL/dB),Zaidman et al. (2008) reported that the ICCs for the cMB analysis were .93–.95 for the longitudinal view images and .73–.82 for the transverse view images.
Sarwal and colleagues (2015) also used transverse images in their ultrasound examinations involving critically ill patients admitted to the intensive care unit (ICU). The ultrasound examinations completed by these investigators included the image capture from 20 rectus femoris scans and featured ImageJ in the post-image acquisition analysis. Their ROI selection protocol was used by 4 examiners (2 trained novices and 2 experienced team members) and included the ‘‘trace method’’ (similar to the FHT method in the current study), as well as the ‘‘square technique’’ to capture a representative area of tissue echogenicity. Although the novice examiners exhibited interrater reliability ICCs of .844 (95% CI [.537–.943]), the more experienced examiners attained excellent lower bound reliability coefficient estimates values (ICC=.973; 95% CI [.935–.989]). While ICCs in isolation cannot be used to convey absolute reliability, the novice examiner ICC values in the Sarwal et al. (2015)study approach the degree of relative reliability reported by Caresio et al. (2015) for the rectus femoris—both groups used the transverse view of the target muscle group which is more difficult to capture using conventional ROI selection methods. Other investigators have obtained grayscale or cMB values from longitudinal view scans with a high degree of reliability (Zaidman, Holland & Hughes, 2012;Ismail et al., 2015). Nonetheless, the experienced examiners featured bySarwal et al. (2015)were able to consistently assess the echogenicity of the rectus femoris in the more complex orientation afforded by the transverse view, which does attest to the value of examiner capability and training.
have noted that large ROIs may adversely affect echogenicity estimates because of the hyperechoic nature of intercompartmental fascia in muscle groups with bipennate or multipennate architecture. However, it has been noted that non-pathologic muscle tissue echogenicity varies among differing muscle groups and that this variation is likely a function of muscle ultrastructure, fiber orientation, and relative amounts of non-contractile tissue (Pillen & Van Alfen, 2011;Caresio et al., 2015). Consequently, ROI selection methods that incorporate full muscle thickness dimensions may appropriately characterize the normal anatomical variation among muscle groups, and account for the inherent heterogeneity of muscle tissue echogenicity (Zaidman et al., 2008). The call to incorporate superficial geometric ROI selection methods into cMB and grayscale histogram analyses has emanated from investigators involved in the diagnosis and management of neuromuscular disorders (Zaidman, Holland & Hughes, 2012;Shklyar et al., 2015). Recent findings suggest that quantitative backscatter analysis and grayscale values from superficial ROIs within the tibialis anterior were negatively associated with performance scores obtained using a standardized functional assessment battery (i.e., the North Star Ambulatory Assessment) in people with Duchenne muscular dystrophy (Shklyar et al., 2015). In contrast, quantitative backscatter analysis and grayscale values from larger ROIs involving greater scanning depth were not associated with the functional performance scores of the participants. Moreover, it has been noted that the use of fixed height superficial ROIs may be advantageous for establishing the cMB estimates of echogenicity between two different ultrasound machines by limiting measurement variability (Zaidman, Holland & Hughes, 2012). However, the observation that excessive ultrasound beam attenuation occurs in muscles with substantial dystrophic changes may not fully apply to the study of age-related muscle dysfunction (Heckmatt et al., 1989;Jansen et al., 2012).Watanabe et al. (2013)examined the echogenicity of the rectus femoris using Photoshop in 184 community dwelling older men (aged 65–91 years). Their findings suggest that peak isometric knee extension torque is significantly associated with the grayscale levels obtained with a full muscle thickness ROI using the FHT method (r= −0.33,p<0.001). In a similar vein, a full muscle thickness ROI using the FHT method at the rectus femoris for grayscale histogram analysis was significantly associated with grip strength scaled to body weight in a sample of community dwelling adult women (Ismail et al., 2015). The multiple regression model with age and echogenicity as predictor variables yielded aR2value of .53 (p=.001), and the partial correlations suggested that grayscale levels had a larger degree of association with strength in comparison with age (rxy·z= −.52 versusrxy·z= −.38). While the fixed height superficial ROI method has been effectively taught to examiners involved in the study of neuromuscular disorders (Shklyar et al., 2015), the full muscle thickness approach to ROI selection has also been shown to be very reliable in studies involving samples with older adults (ICC=.96 and CV=4.2%) (Watanabe et al., 2013).
echogenicity estimates and muscle performance in older adults. This study was also limited by the investigation of quantitative ultrasound in only the rectus femoris. Although the rectus femoris is an important muscle group in the sonographic assessment of sarcopenia and other chronic disorders (Watanabe et al., 2013;Ismail et al., 2015;Hernandez et al., 2015), selected upper extremity muscle groups may merit further study as ultrasound-assisted sarcopenia screening and staging is further developed to accommodate non-ambulatory populations (Harris-Love et al., 2014b). This report addresses sources of error related to the post-image acquisition analysis by the examiners, the image analysis software used, and the inherent variation of the scanned images from the sample of older adult participants. However, the sources of error associated with image capture, and the variability of echogenicity levels secondary to different ultrasound machines and transducers were not explored in this study. Finally, while more current versions of Photoshop are available in comparison to the software program featured in this work, the reported ROI selection strategies and echogenicity estimate methods for the musculoskeletal images are similar to other contemporary research reports (Shklyar et al., 2015;Caresio et al., 2015).
CONCLUSIONS
In summary, the Rectangular Marquee Tool and the Free Hand Tool region of interest selection methods yielded high intra and interrater reliability among two novice examiners measuring muscle echogenicity via grayscale histogram analysis. The minimal measurement error exhibited by the examiners demonstrates that the region of interest selection methods used with Photoshop and ImageJ are suitable for the post-acquisition image analysis of tissue echogenicity in older adults. The comparable grayscale levels measured with the two region of interest selection methods may have been aided by the geometric configuration of the rectus femoris images boundaries in the longitudinal scanning view. Although the Rectangular Marquee Tool facilitates a rapid selection of the region of interest, the Free Hand Tool may be an advantageous method for muscles or tissues with irregular boundaries. Finally, while smaller measurement errors were observed with echogenicity estimates calculated with ImageJ in comparison to Photoshop, these differences were minimal and both image analysis software programs generated similar results.
ADDITIONAL INFORMATION AND DECLARATIONS
Funding
of Health and Human Services. The funders had no role in study design, data collection and analysis, decision to publish, or preparation of the manuscript.
Grant Disclosures
The following grant information was disclosed by the authors: Veterans Affairs VISN 5 Pilot Grant Award.
National Center for Advancing Translational Sciences, NIH.
Clinical and Translational Science Awards Program: #UL1TR000101. VA Office of Academic Affiliations.
VA Office of Research and Development–Rehabilitation R&D Service: 1IK2RX001854-01. US Department of Health and Human Services.
Competing Interests
The authors declare there are no competing interests.
Author Contributions
• Michael O. Harris-Love conceived and designed the experiments, analyzed the data, contributed reagents/materials/analysis tools, wrote the paper, prepared figures and/or tables, reviewed drafts of the paper.
• Bryant A. Seamon conceived and designed the experiments, performed the experiments, analyzed the data, wrote the paper, prepared figures and/or tables, reviewed drafts of the paper.
• Carla Teixeira performed the experiments, wrote the paper, reviewed drafts of the paper.
• Catheeja Ismail contributed reagents/materials/analysis tools, wrote the paper, reviewed drafts of the paper.
Human Ethics
The following information was supplied relating to ethical approvals (i.e., approving body and any reference numbers):
The study was approved by the DC VAMC Research and Development Institutional Review Board (IRB; #01671), and registered with Clinicaltrials.gov (NCT02277236). Signed informed consent was obtained from all study participants prior to data collection.
Data Availability
The following information was supplied regarding data availability:
The data is owned by the US Department of Veterans Affairs and is therefore restricted.
Supplemental Information
Supplemental information for this article can be found online athttp://dx.doi.org/10.7717/
peerj.1721#supplemental-information.
REFERENCES
Caresio C, Molinari F, Emanuel G, Minetto MA. 2015.Muscle echo intensity: reliability and conditioning factors.Clinical Physiology and Functional Imaging35:393–403
DOI 10.1111/cpf.12175.
Casella IB, Fukushima RB, Marques AB, De A, Cury MVM, Presti C. 2015.Comparison between a new computer program and the reference software for gray-scale median analysis of atherosclerotic carotid plaques.Journal of Clinical Ultrasound43:194–198
DOI 10.1002/jcu.22178.
Cawthon PM, Blackwell TL, Cauley J, Kado DM, Barrett-Connor E, Lee CG, Hoffman AR, Nevitt M, Stefanick ML, Lane NE, Ensrud KE, Cummings SR, Orwoll ES. 2015. Evaluation of the usefulness of consensus definitions of sarcopenia in older men: results from the Observational Osteoporotic Fractures in Men Cohort Study.Journal of the American Geriatrics Society 63:2247–2259DOI 10.1111/jgs.13788.
Cawthon PM, Fox KM, Gandra SR, Delmonico MJ, Chiou C-F, Anthony MS, Sewall A, Goodpaster B, Satterfield S, Cummings SR, Harris TB, for the Health, Aging and Body Composition Study. 2009.Do muscle mass, muscle density, strength, and physical function similarly influence risk of hospitaliza-tion in older adults?Journal of the American Geriatrics Society57:1411–1419
DOI 10.1111/j.1532-5415.2009.02366.x.
Clark DJ, Fielding RA. 2012.Neuromuscular contributions to age-related weakness.The Journals of Gerontology Series A: Biological Sciences and Medical Sciences67A:41–47
DOI 10.1093/gerona/glr041.
Collins T. 2007.ImageJ for microscopy.BioTechniques43:25–30DOI 10.2144/000112505. Cruz-Jentoft AJ, Baeyens JP, Bauer JM, Boirie Y, Cederholm T, Landi F, Martin FC,
Michel J-P, Rolland Y, Schneider SM, Topinková E, Vandewoude M, Zamboni M, European Working Group on Sarcopenia in Older People. 2010. Sarcope-nia: European consensus on definition and diagnosis: Report of the European Working Group on Sarcopenia in older people.Age and Ageing39:412–423
DOI 10.1093/ageing/afq034.
Eliasziw M, Young SL, Woodbury MG, Fryday-Field K. 1994.Statistical methodology for the concurrent assessment of interrater and intrarater reliability: using goniomet-ric measurements as an example.Physical Therapy 74:777–788.
Fortin M, Battié MC. 2012.Quantitative paraspinal muscle measurements: inter-software reliability and agreement using OsiriX and ImageJ.Physical Therapy 92:853–864DOI 10.2522/ptj.20110380.
Franchi MV, Atherton PJ, Reeves ND, Flück M, Williams J, Mitchell WK, Selby A, Beltran Valls RM, Narici MV. 2014.Architectural, functional and molecular responses to concentric and eccentric loading in human skeletal muscle.Acta Physiologica210:642–654DOI 10.1111/apha.12225.
Fung AD, Collins JA, Campassi C, Ioffe OB, Staats PN. 2014.Performance charac-teristics of ultrasound-guided fine-needle aspiration of axillary lymph nodes for metastatic breast cancer employing rapid on-site evaluation of adequacy: analysis of 136 cases and review of the literature.Cancer Cytopathology122:282–291
DOI 10.1002/cncy.21384.
Giavarina D. 2015.Understanding Bland Altman analysis.Biochemia Medica 25:141–151DOI 10.11613/BM.2015.015.
Giggins OM, Persson U, Caulfield B. 2013.Biofeedback in rehabilitation.Journal of NeuroEngineering and Rehabilitation10:60DOI 10.1186/1743-0003-10-60.
Goodpaster BH, Kelley DE, Thaete FL, He J, Ross R. 2000.Skeletal muscle attenuation determined by computed tomography is associated with skeletal muscle lipid content.Journal of Applied Physiology89:104–110.
Hairi NN, Cumming RG, Naganathan V, Handelsman DJ, Le Couteur DG, Creasey H, Waite LM, Seibel MJ, Sambrook PN. 2010.Loss of muscle strength, mass (sarcope-nia), and quality (specific force) and its relationship with functional limitation and physical disability: the Concord Health and Ageing in Men Project.Journal of the American Geriatrics Society58:2055–2062DOI 10.1111/j.1532-5415.2010.03145.x. Hamaguchi Y, Kaido T, Okumura S, Fujimoto Y, Ogawa K, Mori A, Hammad A, Tamai
Y, Inagaki N, Uemoto S. 2014.Impact of quality as well as quantity of skeletal muscle on outcomes after liver transplantation.Liver Transplantation20:1413–1419
DOI 10.1002/lt.23970.
Harris-Love MO, Adams B, Hernandez HJ, DiPietro L, Blackman MR. 2014b. Dispari-ties in the consequences of sarcopenia: implications for African American Veterans. Frontiers in Physiology5:250.
Harris-Love MO, Monfaredi R, Ismail C, Blackman MR, Cleary K. 2014a.Quantitative ultrasound: measurement considerations for the assessment of muscular dystrophy and sarcopenia.Frontiers in Aging Neuroscience6:172.
Harris-Love MO, Seamon BA, Teixeira C, Ismail C. 2015.Ultrasound estimates of myosteatosis: reliability and comparison of Adobe PhotoshopR and ImageJ for grayscale analysis of muscle echogenicity.Journal of Frailty and Aging4(Supplement
1):103DOI 10.13140/RG.2.1.3275.3764.
Heckmatt J, Rodillo E, Doherty M, Willson K, Leeman S. 1989.Quantitative sonography of muscle.Journal of Child Neurology4(Suppl):S101–S106.
Hernandez HJ, McIntosh V, Leland A, Harris-Love MO. 2015.Progressive resistance exercise with eccentric loading for the management of knee osteoarthritis.Frontiers in Medicine2:45.
Iftekharuddin KM, Awwal AAS. 2012.Field guide to image processing. Bellingham: SPIE Press.
Jansen M, Van Alfen N, Nijhuis van der Sanden MWG, Van Dijk JP, Pillen S, De Groot IJM. 2012.Quantitative muscle ultrasound is a promising longitudinal follow-up tool in Duchenne muscular dystrophy.Neuromuscular Disorders22:306–317
DOI 10.1016/j.nmd.2011.10.020.
Klaastad Ø, Sauter AR, Dodgson MS. 2009.Brachial plexus block with or with-out ultrasound guidance.Current Opinion in Anaesthesiology22:655–660
DOI 10.1097/ACO.0b013e32832eb7d3.
Krivickas LS, Dorer DJ, Ochala J, Frontera WR. 2011.Relationship between force and size in human single muscle fibres: muscle fibre size and force.Experimental Physiology96:539–547DOI 10.1113/expphysiol.2010.055269.
Kwah LK, Pinto RZ, Diong J, Herbert RD. 2013.Reliability and validity of ultrasound measurements of muscle fascicle length and pennation in humans: a systematic re-view.Journal of Applied Physiology114:761–769DOI 10.1152/japplphysiol.01430.2011. Lang T, Cauley JA, Tylavsky F, Bauer D, Cummings S, Harris TB. 2010.Computed
tomographic measurements of thigh muscle cross-sectional area and attenuation coefficient predict hip fracture: the health, aging, and body composition study. Journal of Bone and Mineral Research25:513–519DOI 10.1359/jbmr.090807. Licata A. 2009.Bone density vs bone quality: what’s a clinician to do?Cleveland Clinic
Journal of Medicine76:331–336DOI 10.3949/ccjm.76a.08041.
Lieber RL. 2010.Skeletal muscle structure, function, and plasticity: the physiological basis of rehabilitation. Baltimore: Lippincott Williams & Wilkins.
Lowry R. 2004.VassarStats: Statistical Computation Web Site.Available athttp:// vassarstats.net/ (accessed 27 November 2015).
Maly MR, Calder KM, Macintyre NJ, Beattie KA. 2013.Relationship of intermuscular fat volume in the thigh with knee extensor strength and physical performance in women at risk of or with knee osteoarthritis.Arthritis Care & Research65:44–52
DOI 10.1002/acr.21868.
Marcus RL, Addison O, LaStayo PC. 2013.Intramuscular adipose tissue attenuates gains in muscle quality in older adults at high risk for falling. A brief report.The Journal of Nutrition, Health & Aging17:215–218 DOI 10.1007/s12603-012-0377-5.
Munro BH. 2001.Statistical methods for health care research. Philadelphia: Lippincott,. Nanes BA. 2015.Slide set: reproducible image analysis and batch processing with ImageJ.
BioTechniques59:269–278.
Newman AB, Kupelian V, Visser M, Simonsick EM, Goodpaster BH, Kritchevsky SB, Tylavsky FA, Rubin SM, Harris TB. 2006.Strength, but not muscle mass, is asso-ciated with mortality in the health, aging and body composition study cohort.The Journals of Gerontology. Series A, Biological Sciences and Medical Sciences61:72–77
DOI 10.1093/gerona/61.1.72.
Pillen S, Scholten RR, Zwarts MJ, Verrips A. 2003.Quantitative skeletal muscle
ultrasonography in children with suspected neuromuscular disease.Muscle & Nerve 27:699–705DOI 10.1002/mus.10385.
Pillen S, Van Alfen N. 2011.Skeletal muscle ultrasound.Neurological Research 33:1016–1024DOI 10.1179/1743132811Y.0000000010.
Pillen S, Van Dijk JP, Weijers G, Raijmann W, De Korte CL, Zwarts MJ. 2009. Quan-titative gray-scale analysis in skeletal muscle ultrasound: a comparison study of two ultrasound devices.Muscle & Nerve39:781–786DOI 10.1002/mus.21285.
Pillen S, Verrips A, Van Alfen N, Arts IMP, Sie LTL, Zwarts MJ. 2007.Quantitative skeletal muscle ultrasound: diagnostic value in childhood neuromuscular disease. Neuromuscular Disorders17:509–516DOI 10.1016/j.nmd.2007.03.008.
Portney LG, Watkins MP. 2009.Foundations of clinical research: applications to practice. Upper Saddle River: Pearson/Prentice Hall,.
Rahemi H, Nigam N, Wakeling JM. 2015.The effect of intramuscular fat on skeletal muscle mechanics: implications for the elderly and obese.Journal of The Royal Society Interface12:20150365DOI 10.1098/rsif.2015.0365.
Rasband WS. 1997.ImageJ. Bethesda: US National Institutes of Health.
Reeves ND, Maganaris CN, Longo S, Narici MV. 2009.Differential adaptations to eccentric versus conventional resistance training in older humans.Experimental Physiology94:825–833DOI 10.1113/expphysiol.2009.046599.
Reimers K, Reimers CD, Wagner S, Paetzke I, Pongratz DE. 1993.Skeletal muscle sonography: a correlative study of echogenicity and morphology.Journal of Ultra-sound in Medicine12:73–77.
Saad HA, Terry MA, Shamie N, Chen ES, Friend DF, Holiman JD, Stoeger C. 2008. An easy and inexpensive method for quantitative analysis of endothelial damage by using vital dye staining and Adobe Photoshop software.Cornea27:818–824
DOI 10.1097/ICO.0b013e3181705ca2.
Sarwal A, Parry SM, Berry MJ, Hsu F-C, Lewis MT, Justus NW, Morris PE, Denehy L, Berney S, Dhar S, Cartwright MS. 2015.Interobserver reliability of quantitative muscle sonographic analysis in the critically ill population.Journal of Ultrasound in Medicine34:1191–1200DOI 10.7863/ultra.34.7.1191.
Schneider CA, Rasband WS, Eliceiri KW. 2012.NIH Image to ImageJ: 25 years of image analysis.Nature Methods9:671–675DOI 10.1038/nmeth.2089.
Scott D, Blizzard L, Fell J, Ding C, Winzenberg T, Jones G. 2010.A prospective study of the associations between 25-hydroxy-vitamin D, sarcopenia progression and physical activity in older adults: vitamin D, sarcopenia and physical activity.Clinical Endocrinology73:581–587DOI 10.1111/j.1365-2265.2010.03858.x.
Shklyar I, Geisbush TR, Mijialovic AS, Pasternak A, Darras BT, Wu JS, Rutkove SB, Zaidman CM. 2015.Quantitative muscle ultrasound in Duchenne mus-cular dystrophy: a comparison of techniques.Muscle & Nerve51:207–213
DOI 10.1002/mus.24296.
Sipilä S, Suominen H. 1993.Muscle ultrasonography and computed tomogra-phy in elderly trained and untrained women.Muscle & Nerve16:294–300
DOI 10.1002/mus.880160309.
Sipilä S, Suominen H. 1994.Knee extension strength and walking speed in relation to quadriceps muscle composition and training in elderly women.Clinical Physiology 14:433–442DOI 10.1111/j.1475-097X.1994.tb00402.x.
Visser M, Goodpaster BH, Kritchevsky SB, Newman AB, Nevitt M, Rubin SM, Simon-sick EM, Harris TB. 2005.Muscle mass, muscle strength, and muscle fat infiltration as predictors of incident mobility limitations in well-functioning older persons.The Journals of Gerontology. Series A, Biological Sciences and Medical Sciences60:324–333
DOI 10.1093/gerona/60.3.324.
Watanabe Y, Yamada Y, Fukumoto Y, Ishihara T, Yokoyama K, Yoshida M, Yamagata E, Kimura M. 2013.Echo intensity obtained from ultrasonography images reflecting muscle strength in elderly men.Clinical Interventions in Aging 8:993–998.
Whittaker J, Teyhen D, Elliott J, Cook K, Langevin H, Dahl H, Stokes M. 2007. Rehabilitative ultrasound imaging: understanding the technology and its applications.Journal of Orthopaedic & Sports Physical Therapy 37:434–449
DOI 10.2519/jospt.2007.2350.
Wroblewski AP, Amati F, Smiley MA, Goodpaster B, Wright V. 2011.Chronic exercise preserves lean muscle mass in masters athletes.The Physician and Sportsmedicine 39:172–178DOI 10.3810/psm.2011.09.1933.
Zaidman CM, Connolly AM, Malkus EC, Florence JM, Pestronk A. 2010.Quantitative ultrasound using backscatter analysis in Duchenne and Becker muscular dystrophy. Neuromuscular Disorders20:805–809DOI 10.1016/j.nmd.2010.06.019.
Zaidman CM, Holland MR, Anderson CC, Pestronk A. 2008.Calibrated quantitative ultrasound imaging of skeletal muscle using backscatter analysis.Muscle & Nerve 38:893–898DOI 10.1002/mus.21052.
Zaidman CM, Holland MR, Hughes MS. 2012.Quantitative ultrasound of skele-tal muscle: reliable measurements of calibrated muscle backscatter from dif-ferent ultrasound systems.Ultrasound in Medicine & Biology38:1618–1625