Ultrasound imaging in women’s arm flexor muscles:
intra-rater reliability of muscle thickness and echo
intensity
Amilton Vieira1, Angelina F. Siqueira1, João B. Ferreira-Junior1, Paulo Pereira1, Dale Wagner2, Martim Bottaro1
ABSTRACT | Background: Different ultrasound parameters have been frequently used to assess changes associated with training, aging, immobilization, and neuromuscular diseases. However, an exploratory reliability analysis of the echo intensity (EI) and muscle thickness (MT) of the forearm lexors is scarce, especially in women. Objective: The purpose of the present study was to determine the intra-rater reliability of MT and EI assessed by ultrasound in young women.
Method: Ultrasonographic MT and EI were acquired in the forearm lexors of 41 young women (22±2 yrs). Reliability
was calculated using intraclass correlation coeficient (ICC2,1), standard error of measurement (SEM), coeficient of
variation (CV), smallest detectable change (SDC), and Bland and Altman plot analysis. Results: ICC values for MT and
EI were 0.88 (95% CI: 0.78-0.93). The SEM and CV values were lower than 10%. Bland and Altman analysis revealed that ultrasound mean differences were 0.27 mm (Limits of Agreement - LOA 95%: - 2.6 to 3.2 mm) and -0.09 a.u. (LOA 95%: - 10.9 to 10.7 a.u.). Conclusion: MT and EI assessed by ultrasonography in young women appear to be reliable and may be used to monitor changes in muscle mass induced by strength training when these changes exceed the precision of ultrasound.
Keywords: ultrasonography; rehabilitation; muscle hypertrophy; greyscale analysis; biceps brachii; elbow.
BULLET POINTS
• US may be used to monitor changes in muscle mass induced by exercise programs. • US may be used to monitor changes in muscle quality induced by rehabilitation.
• The measurement error associated with US must be considered in the interpretation of the results. • Lower MT was associated with higher echogenicity.
HOW TO CITE THIS ARTICLE
Vieira A, Siqueira AF, Ferreira-Junior JB, Pereira P, Wagner D, Bottaro M. Ultrasound imaging in women’s arm lexor muscles: intra-rater reliability of muscle thickness and echo intensity. Braz J Phys Ther. 2016 Nov-Dec; 20(6):535-542. http://dx.doi.org/10.1590/bjpt-rbf.2014.0186
1 Laboratório de Treinamento de Força, Faculdade de Educação Física, Universidade de Brasília (UnB), Brasília, DF, Brazil 2 Health, Physical Education and Recreation Department (HPER), Utah State University (USU), Logan, Utah, USA
Received: Sept. 29, 2015 Revised: Mar. 01, 2016 Accepted: Mar. 17, 2016
Introduction
The measurement of muscle size and morphology has been frequently used to monitor the effects of strength training, aging, and immobilization in patients with neuromuscular diseases1-7. Magnetic resonance
imaging (MRI) and computerized tomography are
considered “gold standard” devices for muscle size, morphology, and composition assessment. However, these devices are costly and typically unavailable in sports training facilities and clinical settings8. Thus,
Brightness (B)-mode ultrasound (US) has been a good
alternative to visualize normal and pathological skeletal muscle changes9. Bemben10 also highlighted that US
measures are safe, quick, and more cost effective than other imaging techniques. However, care must be taken due to a number of potential measurement
errors. Changes at the site where measurement is performed and probe compression rate may signiicantly affect US results. Consequently, studies have been
conducted to validate the US measurements of muscle cross-sectional area and to determine their test-retest reliability8,9,11,12. For example, Reeves et al.8 reported
that the validity of US against MRI in assessing
muscle size produced excellent intraclass correlation
Since the irst study using US to measure muscle
cross-sectional areas13, its use in research, sports, and
clinical facilities has grown in popularity. Currently,
other US parameters have been added to the muscle unit investigation. Muscle echo intensity (EI) has attracted attention as a method of non-invasive investigation of tissue composition because it can identify fat and
ibrous tissue iniltration14. Indeed, it has been associated with physical itness, muscle damage, and overall
muscle quality2,4. In addition, muscle thickness (MT) has been frequently used to assess muscle damage induced by exercise and monitor resistance training interventions on hypertrophy outcomes6,15.
English et al.16 published a systematic review that stressed that most of the reliability studies published on US variables lacked an adequate statistical analysis and a blinded rater, and these factors could lead to a large source of bias. Thus, a study using a more robust statistical approach including limits of agreement, larger sample size, and blinded raters are required17,18.
Furthermore, according to Atkinson and Nevill17, US should be reliable enough to be used in a speciic
population. Gender differences seem to be particularly important during MT and EI assessment since it has been reported that women present thinner muscles and higher echogenicity than men over a number of muscles, such as biceps brachii, quadriceps femoris, sternocleidomastoid, tibialis anterior, and others14. These sex-related differences might increase MT and EI variability in women19. Thus, data from other populations, such as men, may not be applicable to young women. Data from the present study will be valuable for future studies to estimate sample size
and to assess better the forearm lexor MT and EI
adaptations in response to treatment or training in this population. Therefore, the aim of this study was to determine the intra-rater reliability of US measurements
of MT and EI in the forearm lexors of healthy young
women. In addition, we investigated the relationship between MT and EI since thicker muscles may also demonstrate lower echogenicity in young and healthy populations.
Method
Study design
A test-retest design was used to assess the reliability of MT assessment of the forearm lexor muscles and the EI of the biceps brachii. Separated by 24–48 hours, each subject was assessed twice at the same time of
day by the same blinded examiner. The examiner
captured the image for subsequent analysis. In order to reduce potential bias and to blind the examiner, no MT or EI measurements were taken during image
capture. Later, all image measurements and statistical
analyses were performed by a second, blind researcher using non-sequential numbers. The choice of these muscle groups and the US parameters were based on the large amount of experimental studies investigating these muscle groups3,5,6,20,21.
Participants
The required number of subjects “a priori” was based on a tabulated chart provided by Walter et al.22 Considering the follow settings p0=0.60, p1=0.80, α=0.05, and β=0.20, a minimum sample size of 39 participants was needed. Although 39 subjects were technically suficient to meet the power required, we decided to recruit 50 subjects to allow for some missing data or dropouts. A sample of 50 healthy women from a
university population volunteered to participate. To be included in the study, participants had to be healthy
and between the ages of 18 and 30 years. In addition,
they were free from neuromuscular diseases or
musculoskeletal injuries involving the upper limbs. Participants were not allowed to perform any
vigorous physical activities or unaccustomed exercise, take medications, or consume any type of supplements during the experimental period. Informed consent was obtained before testing, and the investigation was
approved by the Ethics Committee of Universidade de Brasília (UnB), Brasília, DF, Brazil (approval number 788.65/14).
Procedures
Body height and weight were assessed using
a stadiometer (Sanny, Murrhardt, Germany) and
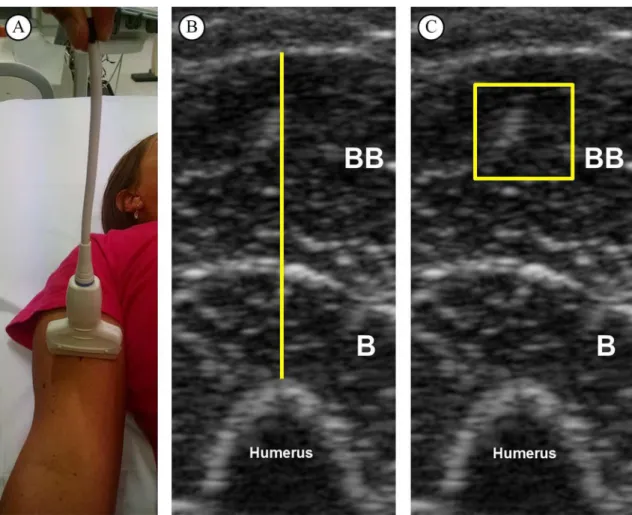
physician’s scale (Lider, São Paulo, Brazil). US B-mode scans (Philips-VMI, Ultra Vision Flip, Model BF, Minas Gerais, Brazil) from forearm lexor muscles were taken 10 cm superior to the antecubital crease23.
This landmark was found to improve reliability10. The participants were evaluated in supine position
with a 7.5 MHz scanning head placed on the skin
perpendicular to the tissue interface2,4,6,15. They were asked to relax their limbs during assessment and a suitable amount of water-soluble transmission gel was used to ensure optimal image quality. To minimize the transducer pressure on the skin, it was held by a guide
mark placed on the transducer’s cable (Figure 1A).
and health science specialist with six months of experience in skeletal muscle US imaging performed all assessments.
Measurement of MT and EI
The images were analyzed in the software Image-J (National Institute of Health, USA, version 1.47). Initially, the subcutaneous adipose tissue–muscle interface and the muscle–bone interface were identiied. Then, the distance between adipose tissue and bone was deined as MT (Figure 1B). The EI was determined by gray-scale analysis using the standard histogram function expressed by values between
0 and 256 (0: black; 256: white) for the region of interest (ROI) (100 mm2)9,24. During EI measurements, the depth of the ROI was set at 5 mm below the fascia
of the biceps brachii2 (Figure 1C).
Statistical analysis
To examine intersession (intra-rater) reliability, the means and standard deviations (SD) for US parameters
from evaluations 1 and 2 were calculated. A dependent
t-test was used to assess systematic error with the
level of signiicance at p<0.05. Relative reliability
was assessed by intraclass correlation coeficient (ICC). Then, standard error of the measurement (SEM), smallest detectable change (SDC), coeficient of variation (CV), and Bland and Altman plot
analysis were used to assess absolute reliability17.
ICC type 2,1 (ICC2,1) was used12,19,25. Subsequently,
SEM was calculated using the following equation17:
1
SEM=SD −ICC. SEM enabled to calculate both SDC
and CV17,25: SDC=SEM×1.96× 2. The CV was calculated using the equation: CV = SEM×Mean-1. The limits of agreement (LOA) were determined based on Bland and Altman plot analysis. The absolute differences against
Figure 1. Representative image from one subject. (A) Ultrasound scan of forearm lexor muscles. (B) Muscle thickness of forearm
lexors, deined as the distance between adipose tissue and bone. (C) Echo intensity of biceps brachii muscle in a square set at 100 mm2.
the individual means of the two measurements were plotted in order to verify homoscedasticity. The 95%
limits of agreements (LOAs) were calculated as follows:
the standard deviation of the differences between
evaluations 1 and 2 was calculated and multiplied by +1.96 and –1.96 to obtain upper and lower limits. Pearson product moment (r) was used to investigate the level of association between MT and EI. Microsoft
Excel and Statistical Package for the Social Sciences (SPSS, version 17.0) were used for analysis.
RESULTS
Fifty healthy women were recruited to participate in this study. Nine subjects did not return on the second day. Then, 41 healthy college-aged women aged 21.1±2.3 years, weight of 59.9±10.2 kg, height 162.6±7.1 cm, and body mass index of 22.6±3.3 m×m-2
were assessed and included in the further analysis.
Table 1 and Figure 2 show the reliability results
for the MT and EI assessments. The ICC values were 0.88 for both MT and EI and they were classiied as very good, where values ≤0.20 are considered poor, 0.21 to 0.40 fair, 0.41 to 0.60 moderate, 0.61 to 0.80 good, and 0.81 to 1.00 very good26. Moreover, SEM and CV values were <10%. Relative systematic error
(bias) was formally evaluated using a dependent t-test across the two trials, and no bias was observed
(p>0.05). In addition, SDC compromised 13.7% and 22.9% of the mean MT and EI, respectively. Bland and Altman analysis revealed that US MT mean difference of 1.3% (LOA 95%: -15.6 to 12.9) and EI of 0.2% (LOA 95%: -23.9 to 24.3). There was a
moderate and negative correlation between MT and
EI in women aged 18 to 28 years (r=.416, p<.0001), where 0.1 to 0.35 = weak; 0.36 to 0.67 = moderate; ≥0.68 = strong)27. Thus, MT statistically explained 17% (r2, equal to 0.416 = 0.17) of the variability in
EI (Figure 3).
DISCUSSION
The aim of this study was to investigate the intra-tester reliability of two US parameters (MT and EI) on
forearm lexor muscles in women. Our data suggest
Table 1. Reliability of ultrasound analysis of the forearm lexors of women (n=41).
Ultrasound Parameters Evaluation 1 Evaluation 2 ICC2,1 SEM CV SRD p Value
Muscle Thickness (mm) 20.51 (4.23) 20.78 (4.42) 0.88 (95% CI: 0.78-0.93) 1.02 4.95 2.82 0.24 Echo Intensity (U.A.) 44.71 (12.70) 44.50 (12.58) 0.88 (95% CI: 0.78-0.93) 3.70 8.28 10.23 0.80
Data from Evaluations 1 and 2 are reported as mean (SD). ICC: intraclass correlation coeficient; CI: 95% conidence interval; SEM: standard error of measurement; CV: coeficient of variation; SRD: smallest real difference; p value: probability value for the t test.
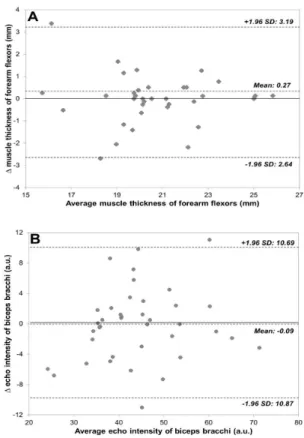
Figure 2. Bland-Altman plots illustrating the differences between
evaluations 1 and 2. (A) Muscle thickness of forearm lexors; (B) echo intensity of biceps brachii. The bias line and random error lines forming the 95% limits of agreement are presented by dashed lines. SD: standard deviation.
Figure 3. Relationship between muscle thickness and echo intensity
the intra-rater reliability of these US parameters is
good, especially for MT. The high ICCs (0.88) and low CV and SEM values (<10%) were comparable
to the reliability of previous US studies examining MT of quadriceps muscles in young men and elderly women3-5. This study was designed to assess reliability
in young women, including a high number of subjects
and using a more robust statistical approach. Data from the present study can be used to design future studies in the estimation of sample size and to assess
better the forearm lexor MT and EI adaptations in
response to treatment or training in this population.
For example, a clinician may consider that an increase in MT following an injury-rehabilitation program should exceed the range of -2.64 to 3.19 mm for MT and -10.87 to 10.69 for EI in young women. LOA and SDC provide further insight since they represent 95%
of the error related to repeated measurements instead
of the ~68% reported by most methods of calculating SEM and CV17. Interestingly, we also observed a
negative relationship between MT and EI. It may indicate that thinner muscles are associated with higher echogenicity, which has been associated with lower muscle quality2,9. In fact, increased echogenicity is typically observed in some myopathies and associated with aging7,9. Future studies are needed to examine the relationship between higher echogenicity and
conjunctive tissue, subcutaneous fat, and inlammatory cell iniltration in muscular tissue.
In the exercise science literature, there is a lack of consensus on the best method for assessing reliability17,28. Methods based on correlation coeficients
and regression (i.e. ICC) provide relative reliability,
while methods expressing error in the actual unit of
measurement (i.e., SEM, CV, SDC, and LOA) provide
absolute reliability. These methods have strengths and weaknesses, which taken together suggest that
they could complement each other. For instance, the
utility of the SEM has been criticized as a measure
of reliability, but it can be used to calculate the SDC. SDC is the minimal difference to be considered real and not merely measurement error. Our SDC results suggest that changes of 2.82 mm (13.7%) and 10.23 (22.9%) a.u. are the minimum values required to be
considered real for MT and EI, respectively. These values can be taken into account when comparing the effect of an intervention program on MT and EI
in young women. Furthermore, when more than a
single method is reported in a reliability study, the reader can interpret and use the one with which they are most familiar17. The inclusion of the LOA method
in all reliability analysis has been highly encouraged17.
The LOA method provides the amount of measurement error in both negative and positive directions. Based
on the results of the present study, further studies using these US parameters would expect (with 95% probability) that the difference between any two tests performed in a similar population should lie within
the LOA presented in Figure 2. For example, for the MT of the forearm lexors of young women, it could
be expected that the differences between two repeated
measurements will range from -2.64 to 3.19 mm. It can
also be said that, for college-aged women, two MT evaluations will differ due to measurement error by
no more than 12.9% in the negative and 15.6% in the
positive direction. It should be noted that the amount of error is unequal, here being greater in the positive
than in the negative direction. A previous study29 examining the MT of trapezius muscles of 12 men and four women reported LOA ranging from -42.85% to 17.85%. These results strongly demonstrate the
importance of quantifying error in both negative and
positive directions. Lastly, we could conclude that B-mode US is probably not reliable enough to monitor
the small changes in MT that result from increasing the training of an already athletic population, but it may detect the large differences in MT that usually follow
injury-rehabilitation programs or monitor training
effects in previously sedentary participants. Ultimately,
it is the task of the researcher to judge whether the LOA are narrow enough for the measurement to be done or whether modiications in the experiment’s
design are needed17.
Despite the frequent use of US devices in sports, rehabilitation, physical therapy, athletic training, and medicine research, few studies have demonstrated a proper reliability analysis in women. To the best of our knowledge, there is only a single study examining the reliability of EI in the biceps brachii of women
(n=10)9. Although this study had shown good reliability for EI in a large range of regions of interest, they only
carried out ICC and CV analysis in 10 women. Other
studies3-5 have demonstrated high ICC (>0.90) and
low CV (<5%), but they were conducted as part of a
larger study in which reliability was not the primary aim and potential sources of bias might not have been adequately controlled (i.e., measures by blind rater).
The overall reliability (relative and absolute) shown in the present study seems to be worse than those
reported by Jenkins et al.12, who used panoramic and
transverse US imaging to measure similar parameters.
and sensitivity to change for MT and EI measurements
of the forearm lexor muscle in 14 men. ICC, CV, and SRD for MT and EI ranged from 0.78 to 0.99, 2.26% to 3.29%, and 6.26% to 9.12%, respectively.
This discrepancy may be the result of sex-related differences in muscle morphology and composition
and/or related to US settings (i.e., frequency: 7.5 versus 10 MHz and/or size of region of interest: EI 100 mm2 versus maximal possible). Potential reasons to explain
better results in men than women include greater body mass and height, which may account for a
signiicant portion of the variance in muscle size, and
higher muscle quality often observed in men (i.e.,
less intramuscular fat). In view of this, Palmer et al.19 recently demonstrated higher EI ICCs values in men
when compared to women. In fact, previous studies
have reported signiicantly lower EI values in men
versus women14,19. This difference may be the result of
intramuscular fat and/or ibrous tissue content. It has been shown that intramuscular fat and ibrous tissue content inluences EI, which also may be related to overall body fat content. Indeed, a signiicant positive
relationship between subcutaneous fat and EI was recently observed9. Thus, given the difference in muscle size and quality between genders, it is prudent
to have sex-speciic reliability data for MT and EI.
Such data will also aid in sample size estimation and interpretation of US results.
Despite considerable advantages conferred to
B-mode US for muscle morphology analysis, care
should be taken during both data collecting and analysis.
One of the main concerns during data collection is the
amount of pressure on the skin, which could deform the underlying tissues and alter the measurements. To the best of our knowledge, there is no standardized procedure to minimise this source of error; however, we believe that the procedure applied in the present study (Figure 1A) may be a good strategy to reduce
the transducer pressure on the skin. Another source of measurement error could be related to acute luid
shifts in response to transition from upright to supine body position30. Rest periods between 15 and 20 min before each measurement have been used to allow
luid shifts to occur1,8,31. It is important to note that
these studies were limited to the lower body, and data
from Berg et al.30 do not support resting periods less
than 30 min. Also, based on Berg et al.30, it seems that calf muscles are mainly affected by postural change.
Our data suggest that for arm evaluations resting
periods may be unnecessary for a good reliability measurement.
A possible limitation of this study was that, for
repeated measurements, the US transducer was placed on the exact site (marked) on the skin. Marking the site is useful to investigate acute changes in the muscle15,20,21; however, for longitudinal studies the US
site must be re-measured. Furthermore, considering
that both MT and EI may be affected by the aging
process, the indings of the present study can only be
applied to young and healthy women. In addition, in
the present study, we adopted a standard site (10 cm
superior to the antecubital crease) to measure MT and EI. Even though, this procedure is suggested to improve within-individual reliability10, we might have introduced a bias due to anthropometric
variations. Finally, it is also worth noting the use of a 7.5 MHz transducer. We assume that lower or
higher frequencies might provide different results. The choice of frequency will be dependent on the depth of the region of interest. Usually, higher frequencies
(greater than 7.5 MHz) are suggested for supericial
muscles and lower frequencies (lower than 5 MHz) for deeper muscles32. A better detail resolution could
be relected in greater reliability especially for echo
intensity analysis, which depends on image quality. In summary, we conclude that US imaging of
the MT and EI of the elbow lexors muscles of women is reliable within approximately ±3 mm for MT and ±10 a.u. for EI. The amount of error reported
here should be considered when calculating sample size estimations, especially when the expected training effect is small, as in an athletic or clinical population. In addition, since the adaptations in muscle mass that occur in response to short-term strength training are small, researchers must be cautious when assessing MT and EI during the early-phase of training in this
population. We also found a negative correlation between
muscle MT and EI, which suggests that intramuscular
fat or ibrous tissue content may exert some inluence
on muscle size in young, healthy women.
References
1. CadoreEL, Izquierdo M, AlbertonCL, PintoRS, Conceicao M, Cunha G, et al. Strength prior to endurance intra-session exercise sequence optimizes neuromuscular and cardiovascular gains in elderly men. Exp Gerontol. 2012;47(2):164-9. http:// dx.doi.org/10.1016/j.exger.2011.11.013. PMid:22178632. 2. CadoreEL, Izquierdo M, Conceicao M, RadaelliR, Pinto
3. Matta TT, NascimentoFX, FernandesIA, OliveiraLF. Heterogeneity of rectus femoris muscle architectural adaptations after two different 14-week resistance training programmes. Clin Physiol Funct Imaging. 2015;35(3):210-5. http://dx.doi.org/10.1111/cpf.12151. PMid:24750784. 4. PintoRS, CorreaCS, RadaelliR, CadoreEL, BrownLE,
Bottaro M. Short-term strength training improves muscle quality and functional capacity of elderly women. Age (Dordr). 2014;36(1):365-72. http://dx.doi.org/10.1007/ s11357-013-9567-2. PMid:23881608.
5. RadaelliR, WilhelmEN, BottonCE, RechA, Bottaro M, BrownLE, et al. Effects of single vs. multiple-set short-term strength training in elderly women. Age (Dordr). 2014;36(6):9720. http://dx.doi.org/10.1007/s11357-014-9720-6. PMid:25358552.
6. Gentil P, FischerB, Martorelli AS, LimaRM, Bottaro M. Effects of equal-volume resistance training performed one or two times a week in upper body muscle size and strength of untrained young men. J Sports Med Phys Fitness. 2015;55(3):144-9. PMid:24732784.
7. Nishihara K, Kawai H, Hayashi H, Naruse H, Kimura A, Gomi T, et al. Frequency analysis of ultrasonic echo intensities of the skeletal muscle in elderly and young individuals. Clin Interv Aging. 2014;9:1471-8. http://dx.doi.org/10.2147/ CIA.S67820. PMid:25228800.
8. ReevesND, Maganaris CN, NariciMV. Ultrasonographic assessment of human skeletal muscle size. Eur J Appl Physiol. 2004;91(1):116-8. http://dx.doi.org/10.1007/s00421-003-0961-9. PMid:14639480.
9. CaresioC, Molinari F, Emanuel G, Minetto MA. Muscle echo intensity: reliability and conditioning factors.Clin Physiol Funct Imaging. 2015;35(5):393-403. http://dx.doi. org/10.1111/cpf.12175. PMid:24902991.
10. Bemben MG. Use of diagnostic ultrasound for assessing muscle size. J Strength Cond Res. 2002;16(1):103-8. PMid:11834114.
11. Miyatani M, Kanehisa H, Kuno S, Nishijima T, Fukunaga T. Validity of ultrasonograph muscle thickness measurements for estimating muscle volume of knee extensors in humans. Eur J Appl Physiol. 2002;86(3):203-8. http://dx.doi.org/10.1007/ s00421-001-0533-9. PMid:11990727.
12. JenkinsND, Miller JM, BucknerSL, CochraneKC, Bergstrom HC, Hill EC, et al. Test-retest reliability of single transverse versus panoramic ultrasound imaging for muscle size and echo intensity of the biceps brachii. Ultrasound Med Biol. 2015;41(6):1584-91. http://dx.doi.org/10.1016/j. ultrasmedbio.2015.01.017. PMid:25746907.
13. Ikai M, Fukunaga T. Calculation of muscle strength per unit cross-sectional area of human muscle by means of ultrasonic measurement. Int Z Angew Physiol.1968;26(1):26 -32. PMid:5700894.
14. Arts IM, Pillen S, Schelhaas HJ, Overeem S, Zwarts MJ. Normal values for quantitative muscle ultrasonography in adults. Muscle Nerve. 2010;41(1):32-41. http://dx.doi. org/10.1002/mus.21458. PMid:19722256.
15. Ferreira-JuniorJB, Bottaro M, VieiraA, Siqueira AF, Vieira CA, Durigan JL, et al. One session of partial-body cryotherapy (-110 degrees C) improves muscle damage recovery. Scand J Med Sci Sports. 2015;25(5):e524-30. PMid:25556301.
16. English C, FisherL, Thoirs K. Reliability of real-time ultrasound for measuring skeletal muscle size in human limbs in vivo: a systematic review. Clin Rehabil. 2012;26(10):934-44. http:// dx.doi.org/10.1177/0269215511434994. PMid:22324054. 17. Atkinson G, NevillAM. Statistical methods for assessing
measurement error (reliability) in variables relevant to sports medicine. Sports Med. 1998;26(4):217-38. http://dx.doi. org/10.2165/00007256-199826040-00002. PMid:9820922. 18. Mokkink LB, PrinsenCA, BouterLM, VetHC, Terwee
CB. The COnsensus-based Standards for the selection of health Measurement INstruments (COSMIN) and how to select an outcome measurement instrument. Braz J Phys Ther. 2016;20(2):105-13. http://dx.doi.org/10.1590/bjpt-rbf.2014.0143. PMid:26786084.
19. PalmerTB, Akehi K, Thiele RM, Smith DB, Thompson BJ. Reliability of panoramic ultrasound imaging in simultaneously examining muscle size and quality of the hamstring muscles in young, healthy males and females. Ultrasound Med Biol. 2015;41(3):675-84. http://dx.doi. org/10.1016/j.ultrasmedbio.2014.10.011. PMid:25683219. 20. Nosaka K, Newton M, Sacco P. Responses of human elbow
flexor muscles to electrically stimulated forced lengthening exercise. Acta Physiol Scand. 2002;174(2):137-45. http:// dx.doi.org/10.1046/j.1365-201X.2002.00936.x. PMid:11860376. 21. Flores DF, Gentil P, BrownLE, PintoRS, Carregaro RL, Bottaro M. Dissociated time course of recovery between genders after resistance exercise. J Strength Cond Res. 2011;25(11):3039-44. http://dx.doi.org/10.1519/ JSC.0b013e318212dea4. PMid:21804429.
22. Walter SD, Eliasziw M, Donner A. Sample size and optimal designs for reliability studies. Stat Med. 1998;17(1):101-10. http:// dx.doi.org/10.1002/(SICI)1097-0258(19980115)17:1<101::AID-SIM727>3.0.CO;2-E. PMid:9463853.
23. Gentil P, Soares S, Bottaro M. Single vs. Multi-Joint Resistance Exercises: Effects on Muscle Strength and Hypertrophy. Asian J Sports Med. 2015;6(2):e24057. PMid:26446291. 24. Nosaka K, ClarksonPM. Changes in indicators of
inflammation after eccentric exercise of the elbow flexors. Med Sci Sports Exerc. 1996;28(8):953-61. http://dx.doi. org/10.1097/00005768-199608000-00003. PMid:8871903. 25. WeirJP. Quantifying test-retest reliability using the intraclass
correlation coefficient and the SEM. J Strength Cond Res. 2005;19(1):231-40. PMid:15705040.
26. Mota P, PascoalAG, Sancho F, Bo K. Test-retest and intrarater reliability of 2-dimensional ultrasound measurements of distance between rectus abdominis in women. J Orthop Sports Phys Ther. 2012;42(11):940-6. http://dx.doi.org/10.2519/ jospt.2012.4115. PMid:22810966.
27. Dancey C, ReidyJ. Statistics without maths for psychology. New Jersey: Pearson Education; 2007.
28. NuzzoJL, AnningJH, Scharfenberg JM. The reliability of three devices used for measuring vertical jump height. J Strength Cond Res. 2011;25(9):2580-90. http://dx.doi. org/10.1519/JSC.0b013e3181fee650. PMid:21804426. 29. O’SullivanC, Bentman S, Bennett K, Stokes M. Rehabilitative
30. Berg HE, Tedner B, Tesch PA. Changes in lower limb muscle cross-sectional area and tissue fluid volume after transition from standing to supine. Acta Physiol Scand. 1993;148(4):379-85. http://dx.doi.org/10.1111/j.1748-1716.1993. tb09573.x. PMid:8213193.
31. AhtiainenJP, Hoffren M, Hulmi JJ, Pietikainen M, Mero AA, AvelaJ, et al. Panoramic ultrasonography is a valid method to measure changes in skeletal muscle cross-sectional area. Eur J Appl Physiol. 2010;108(2):273-9. http://dx.doi. org/10.1007/s00421-009-1211-6. PMid:19777252. 32. WhittakerJL, Thompson JA, Teyhen DS, Hodges P.
Rehabilitative ultrasound imaging of pelvic floor muscle
function. J Orthop Sports Phys Ther. 2007;37(8):487-98. http://dx.doi.org/10.2519/jospt.2007.2548. PMid:17877285.
Correspondence Amilton Vieira
Universidade de Brasília Faculdade de Educação Física
Campus Universitário Darcy Ribeiro – Asa Norte CEP 70910-970, Brasília, DF, Brazil