Food-Restriction on Gene Expression in the Striatum of
Adolescent Rats
Nicholas E. Ilott1,2*, Tomasz Schneider3,4, Jonathan Mill1,5, Leonard Schalkwyk1, Giovana Brolese6, Lisiane Bizarro6, Ian P. Stolerman3, Emma Dempster1,5, Philip Asherson1
1Medical Research Council (MRC), Social, Genetic and Developmental Psychiatry (SGDP) centre, Institute of Psychiatry, King’s College London, London, United Kingdom, 2Computational Genomics Analysis and Training (CGAT), Medical Research Council (MRC) Functional Genomics Unit, Department of Physiology, Anatomy and Genetics, University of Oxford, Oxford, United Kingdom,3Department of addictions, Institute of Psychiatry, King’s College London, London, United Kingdom,,4Experimental Psychology, University of Oxford, Oxford, United Kingdom, 5University of Exeter Medical School, Exeter, United Kingdom, 6Departamento de Psicologia do Desenvolvimento e da Personalidade, Instituto de Psicologia, Universidade Federal do Rio Grande do Sul, Porto Alegre-RS, Brazil
Abstract
Gestational exposure to environmental toxins such as nicotine may result in detectable gene expression changes in later life. To investigate the direct toxic effects of prenatal nicotine exposure on later brain development, we have used transcriptomic analysis of striatal samples to identify gene expression differences between adolescent Lister Hooded rats exposed to nicotine in utero and controls. Using an additional group of animals matched for the reduced food intake experienced in the nicotine group, we were also able to assess the impact of imposed food-restriction on gene expression profiles. We found little evidence for a role of gestational nicotine exposure on altered gene expression in the striatum of adolescent offspring at a significance level of p,0.01 and |log2 fold change .0.5|, although we cannot exclude the possibility of nicotine-induced changes in other brain regions, or at other time points. We did, however, find marked gene expression differences in response to imposed food-restriction. Food-restriction resulted in significant group differences for a number of immediate early genes (IEGs) includingFos, Fosb, Fosl2, Arc, Junb, Nr4a1andNr4a3. These genes are associated with stress response pathways and therefore may reflect long-term effects of nutritional deprivation on the development of the stress system.
Citation:Ilott NE, Schneider T, Mill J, Schalkwyk L, Brolese G, et al. (2014) Long-Term Effects of Gestational Nicotine Exposure and Food-Restriction on Gene Expression in the Striatum of Adolescent Rats. PLoS ONE 9(2): e88896. doi:10.1371/journal.pone.0088896
Editor:Yael Abreu-Villac¸a, Universidade do Estado do Rio de Janeiro, Brazil ReceivedJune 28, 2013;AcceptedJanuary 14, 2014;PublishedFebruary 19, 2014
Copyright:ß2014 Ilott et al. This is an open-access article distributed under the terms of the Creative Commons Attribution License, which permits unrestricted
use, distribution, and reproduction in any medium, provided the original author and source are credited.
Funding:This work was supported by the Wellcome Trust. The funders had no role in study design, data collection and analysis, decision to publish, or preparation of the manuscript.
Competing Interests:The authors have declared that no competing interests exist. * E-mail: [email protected]
Introduction
Smoking during pregnancy (SDP) is associated with a variety of neonatal perturbations including low birth weight [1–6] and sudden infant death syndrome (SIDS) [7], as well as later-developing behavioural outcomes [4,8–10]. Animal studies have identified both physical and behavioural abnormalities due to prenatal nicotine exposure, including delayed development and maturation [11–13], hyperactivity [14,15], increased markers of anxiety [16], as well as cognitive performance deficits that reflect aspects of impulse control and attention regulation in both adult and adolescent animals [17,18]. The molecular basis of these associations may involve alterations of the cholinergic system, where the stimulation of nicotinic acetylcholine receptor (nAChR) subunits is important in a variety of neuronal processes throughout development [19]. Changes in gene expression of nAChR subunits and regulators of acetylcholine neurotransmission have been observed in animals prenatally exposed to nicotine [20–22]. Links between nAChR function and the dopamine system are also highlighted by the observation of an increase in dopamine receptor D5 (Drd5) mRNA expression in the striatum of adult
rats gestationally exposed to nicotine [18], as well as a reduced nicotine-induced dopamine release in adolescent rats [23]. Further, the first large-scale gene expression studies using custom, pathway focused microarrays have revealed a role for cell adhesion and cell death systems in limbic brain regions of adolescent rats exposed to nicotinein utero[24,25].
exposed offspring display hyperactivity, increased number of open arm entries in the elevated plus maze and increased numbers of anticipatory responses in the 5-CSRTT. This suggests that while there may be shared molecular signatures, a significant proportion is likely to be distinct. Nevertheless, any differences due to gestational food-restriction remain of considerable interest. It has been established that growth restriction induced by maternal undernutrition has long-term effects on mRNA expression in offspring. For example, sirtuin 1 (Sirt1) is reduced [29] and somatic cytochrome c (CYCS) [30] is increased in the liver of offspring gestationally exposed to energy restriction. Further, hypothalamic regulation of metabolic processes may also be altered, as evidence suggests increased expression of the leptin receptor and fat mass and obesity-associated (FTO) gene in gestationally malnourished offspring hypothalamus [31,32]. The effects of maternal under-nutrition on gene expression in the striatum, however, have not yet been studied.
To further our understanding of the long-term effects of gestational nicotine exposure on brain development, we have conducted the first genome-scale mRNA expression profiling study in adolescent rats exposed to nicotinein utero. The analyses have been performed in the striatum, a brain structure that is sensitive to nicotine exposure [33] and is implicated in the development of ADHD [34–38].
To control for potential confounding effects of differences in food intake between the nicotine-exposed group and controls, we included an additional group of animals that were matched for food-intake with the nicotine-exposed group. Given the current literature, we hypothesised that the nicotine group would show dysregulation of genes involved in nAChR receptor signaling and dopamine function. In addition, we expected any differences observed due to food-restriction would be distinct from the effects of nicotine [33] yet may reflect a disturbance in the development of metabolic or stress related pathways.
Materials and Methods
Animals
The treatment of animals complied with the UK Animals (Scientific Procedures) Act 1986 and the Code of Practice of the Institute of Psychiatry. The work was carried out under the Project License PPL 70/5569 ‘‘Psychopharmacology of nicotine depen-dence’’ issued by the Home Office of the British Government in 2003 and amended in 2006. Nicotine was administered in the drinking water of pregnant rats in order to avoid stress of invasive surgical procedures involving implants. Supplementary water was made available for drinking to minimise the consequent reductions in fluid intake. The minimum number of animals consistent with adequate statistical power was used. Animals were sacrificed by cervical dislocation.
Both male and female Lister hooded rats (Harlan Olac, Bicester, UK) were used. They were housed individually (except during mating) in a temperature (2162uC) and humidity (50610%) controlled environment on a 12 h light–dark cycle (lights on from 0700 h) and hadad libitumaccess to drinking fluids (tap water or nicotine solutions).
Females were divided into three separate groups according to a randomised block design balanced to their body weight into: nicotine exposure (Nic, n = 8), control group (Con, n = 8) and a food-restricted (pair-fed) group (Con-Pf, n = 9) that was matched for food intake to the Nic animals, was also established. Pair-fed animals were provided each day with the amount of food eaten by matched nicotine-exposed animals on the previous day; their access to water was not restricted.
Nicotine bitartrate (Sigma, USA) was dissolved in the drinking water at varying concentrations and nicotine-containing water was adjusted to the pH of drinking water with 0.001 NaOH. Habituation to increasing concentrations of nicotine solution (0.02, 0.04, 0.06 mg/ml) as the only source of fluid was introduced to the Nic exposed group 3-weeks before mating.
Females were controlled according to their oestrous cycle. Females in pro-oestrus and oestrous were mated during the dark phase of the day at the beginning of the fourth week of nicotine exposure. Nicotine solution was not withheld before mating. The day on which a vaginal plug or spermatozoa in the vaginal smear were found was defined as gestational day 0.
Pregnant females from nicotine, control and pair-fed groups were weighed twice weekly. Consumption of nicotine solution was assessed on a daily basis. Females drinking less than 10 ml of nicotine solution on any particular day were given access to tap water for 3 min. Food consumption was evaluated 3 times a week. All dams were checked twice daily (before 8am and after 4.30pm) starting a few days before delivery. Deliveries completed by 8am were assigned to postnatal day 1 (PND1). Pups born later that day were assigned to PND1 on the following morning. Litters were examined on PND1 for obvious morphological anomalies (e.g., missing digits, facial malformations, etc.), sexed by relative ano-genital distance and, in the case of litters with more than 8 offspring, culled randomly to 8 pups with equal numbers of males and females per litter whenever possible. 8–9 litters were used to assess birthweight of offspring from each group. The dam was first removed from the home cage and birthweight measurements were taken between 9.00am and 4.00pm.
Our previously published work provides additional details regarding the nicotine administration protocol used in the present study [17]. Briefly, using this protocol we obtained 81.1623.2 ng/ ml blood nicotine in those dams assessed. There were no significant effects of nicotine on litter characteristics: number of animals per litter, the numbers of females and males per litter and sex ratio (see [17] for details).
Data concerning maternal fluid intake, food consumption and offspring bodyweight were analysed for between group differences using 1-way ANOVA. Significant differences between the three groups were further assessed post-hoc using Tukey’s Honest Significant Difference test (HSD), implemented in R2.10.1.
Sample Preparation
Experimentally naı¨ve male offspring, littermates of animals used in the previously published behavioural study [17] from the three gestational conditions were used for microarray analysis: a) prenatal nicotine exposed (Nic, n = 8), b) controls (Con, n = 10) and c) pair-fed (Con-Pf, n = 10) resulting in a total of n = 28. Results presented here (e.g. in Table 1) are for this subset of the larger number of offspring generated for the previously published behavioural study; the data in Table 1 are therefore derived from, but not the same as, those in [17].
Rats were killed at post-natal day (PND) 35 to 42 by decapitation and brains were immediately dissected. Equal numbers of animals from each group were extracted on the same day. The striatum was removed, snap frozen on dry ice and stored at280uC until RNA extraction. RNA was extracted using Qiagen AllPrep RNA/DNA minikits (Qiagen, UK) and treated with an RNase-free DNase1 to eliminate genomic DNA contamination. Purity and quality of total RNA samples was assessed using the NanoDrop Spectrophotometer and Agilent RNA 6000 pico kit (Agilent, UK), according to the manufacturer’s instructions (see File S1).
Microarray Processing
cDNA conversion and microarray hybridisation was performed using standard protocols provided by the manufacturers (File S1). To avoid possible batch effects, samples were spread across hybridisation date, fluidics machine and fluidics module in a balanced manner (details available from corresponding author). Microarrays used in the current study were the Affymetrix rat GeneChip 1.0st array. 2 Con samples were removed after array scanning due to clear data quality issues. An outlying sample (from Nic group) was additionally removed after data processing.
Statistical analysis of microarray data
The Robust Multichip Algorithm (RMA) [39] as implemented in the affy package from Bioconductor was used to quantile normalise the expression data and normalised expression summa-ries were used for all downstream analyses conducted in the statistical software package R version 2.10.1. 25 arrays were included for downstream analysis (Nic = 7, Con = 10, Con-Pf = 8). Using thegenefilterpackage in the Bioconductor suite, all probe-sets with intensity less than the median for the 25 arrays were removed from the data to ensure that non-expressed genes were not being analysed. This filtering procedure left 14,073 probe-sets for further analysis. Quality control metrics were employed to assess microarray data quality (Methods S1 in File S1 and Figure S1 in File S1).
The 25 arrays displayed similar expression profiles, with Pearson Product moment correlations between each array ranging from 0.97 to 0.99. The Shapiro-Wilk test of normality on the data rejected the normal distribution for 25% of probes at the p,0.05 level. Given that the majority of probe-sets were normally distributed, we continued downstream analysis without transform-ing the data further, consistent with approaches used by other groups [40].
Pair-wise mean differences in gene expression between groups were analysed using the Student’s t-test. Following recommenda-tions from the MicroArray Quality Control (MAQC) project [41] we used a combination of fold change and p-value thresholds to define significant differential expression, defined as a |log2 fold-change of$0.5| in combination with a p-value of p,0.01.
Quantitative reverse transcription PCR (qRT-PCR) analysis of differentially expressed genes
Ten genes (Fos, Fosl2, Dusp1, Arc, Junb, Egr2, Nr4a3, Nr4a1, Slc25a5and Npas4) were chosen for validation using qRT-PCR. These genes were chosen as they represented genes that were sensitive to imposed food-restriction i.e. they were up-regulated in the Con-Pf group when compared to both Con and Nic groups. Assays were performed with inventoried TaqMan assays (Applied Biosystems, UK) using standard protocols on the same total RNA samples as the microarray experiment (File S1).
Comparisons between groups were performed using a one-tailed Student’s t-test on normalised data, using the comparative Ct method. One of the assays (Npas4) was removed from the analysis due to low quality data.
Ingenuity Pathways Analysis (IPA)
IPA was used to identify functional networks and significantly associated biological pathways amongst the significantly differen-tially expressed genes (IngenuityH Systems, www.ingenuity.com) (see File S1 for details). We considered pathways significant at p,0.05.
Gene Set Enrichment Analysis (GSEA)
To investigate the specific role of food-restriction induced stress response genes in the striatum, and to complement the findings from IPA, we employed GSEA [42]. We used the desktop application of this software for our analysis [43], which is available from the Broad Institute (http://www.broadinstitute.org/gsea/). From the molecular signatures database (MSigDb) (http://www. broadinstitute.org/gsea/msigdb/genesets.jsp) we downloaded the ‘RESPONSE_TO_STRESS’ gene-set, which contains genes annotated by the GO term GO:0006950 and pertains to: ‘‘a change in state or activity of a cell or an organism (in terms of movement, secretion, enzyme production, gene expression, etc.) as a result of a stimulus indicating the organism is under stress. The stress is usually, but not necessarily, exogenous (e.g. temperature, humidity, ionizing radiation)’’.
For genome-wide gene lists from both Nic vs. Con-Pf and the Con vs. Con-Pf comparisons, we calculated a score that accounted for the strength of both p-value and fold-change (-log10(p-value) x
Table 1.Nicotine administration and food-restriction have effects on pregnancy and birth characteristics.
Measure Timing F P-value Con Nic Con-Pf
Dams
Mean body weight Week before pregnancy 12.38 2.50E-04 252.266.2 213.966.5* 223.464.1*
(g) Pregnancy 13.30 1.63E-04 289.166.7 247.866.8* 260.363.5*
Mean food consumption Week before pregnancy 13.06 1.83E-04 15.660.4 13.360.4* 13.760.0*
(g/day) Pregnancy 10.23 7.24E-04 21.460.4 17.860.9* 19.360.0*
Mean food consumption Week before pregnancy 0.05 0.95 61.961.3 62.361.5 61.761.2
(g/Kg bodyweight/day) Pregnancy 0.82 0.46 74.361.4 71.762.3 74.261.1
Mean solnconsumption Week before pregnancy 19.14 1.53E-05 24.961.2 14.560.7*# 18.961.4*
(ml) Pregnancy 33.40 2.16E-07 45.062.7 21.861.7*# 38.061.6
Mean solnconsumption Week before pregnancy 10.97 4.97E-04 98.5
63.6 68.263.4*# 84.565.7
(ml/Kg bodyweight/day) Pregnancy 33.56 2.07E-07 155.166.7 88.166.2*# 146.065.8
Offspring
Bodyweight (g) PND1 5.8 9.08E-03 5.360.1 4.760.1* 5.160.1
log2(fold-change)). This enabled us to rank the gene lists, whereby we used the GSEA pre-ranked function in the GSEA suite to test for enrichment; using this score we considered the gene-set significant at a p,0.05. Genes that contribute to the enrichment score are defined as those that appear in the ranked list before the maximum enrichment score is reached and therefore describe contributing genes that do not meet the significance thresholds imposed at the single gene level.
Global DNA methylation analysis by the Luminometric Methylation Assay (LUMA)
Global DNA methylation was quantified using LUMA as previously described [44] (see File S1). Differences in global methylation status were assessed using pair-wise Wilcoxon rank sum tests between groups.
Assessment of methylation patterns at CpG sites within Fos and Fosb
Changes in gene expression as a result of external stimulation may involve multiple DNA or histone modifications that contribute to an active (or repressive) chromatin state. One such modification is DNA methylation, which is considered a marker of repressed genes.
Promoter CpG sites withinFosandFosbwere analysed using a bisulphite-based method on the Sequenom mass-array system (see Methods S1 in File S1 and Table S1 in File S1). A Student’s t-test at each site for each group-pair was used to assess significant difference between groups.
Results
Gestational nicotine treatment and food-restriction affect body weight and solution consumption in dams
Table 1 displays bodyweight, food consumption and solution consumption of dams used in the present study (i.e. a subset of dams described in [17]). As previously described in the behav-ioural study [17] both the Nic and Con-Pf groups differ significantly for a number of variables compared to controls. Lower dam body weight in both the Nic and Con-Pf groups compared with controls is likely due to a combination of reduced solution and food intake (Table 1). The significantly lower birth weights observed for the Nic group compared with Con (Con = 5.360.1 g, Nic = Con = 4.760.1 g, p,0.05) in the off-spring described in the present study (i.e. experimentally naı¨ve littermates of a subset of dams described in [17]) suggest a specific effect of nicotine on this variable as there was no difference between Con-Pf and Con groups (Con = 5.360.1 g, Con-Pf = 5.360.1 g, p = NS).
Microarray analysis reveals limited effects of gestational nicotine treatment but significant effects of gestational food-restriction on striatal mRNA expression profiles
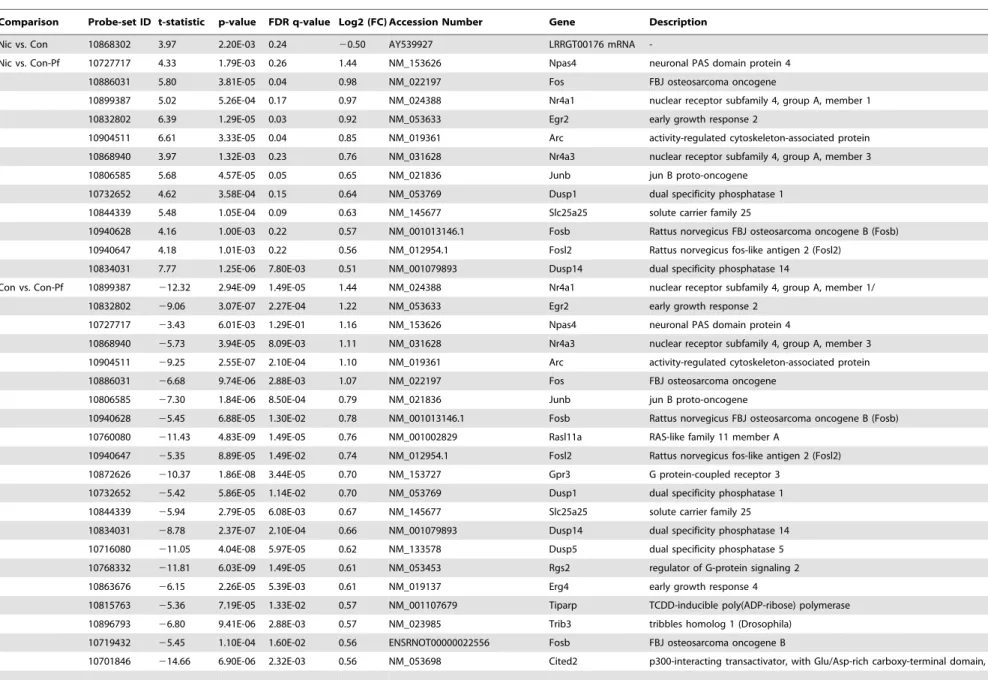
Three group comparisons were performed; Nic versus Con, Con versus Con-Pf and Nic versus Con-Pf (Figure 1). We found little evidence for gene expression differences between the Nic group and the Con group, with just a single gene,LRRGT00176
reaching significance (log2(fold change) =20.5, p-value = 2.20610203, Table 2). In contrast, we found significant
differential expression (p,0.01 and |Fold change$0.5|) in both comparisons involving the Con-Pf group (Figure 1). 26 genes were differentially expressed in the Con versus Con-Pf comparison and 12 were differentially expressed in the Nic versus Con-Pf comparison (Table 2) using the designated criteria. These data
suggest that imposed food-restriction during gestation is capable of affecting the expression of genes much later in life. To assess whether these changes were true positives, we assessed the significance of these genes using the false discovery rate (FDR) q-value (implemented using ther q-valuepackage [45]) as a method for correcting for the number of tests performed (correcting for the original 14,073 probesets analysed) (Table 2). The result of this correction showed low confidence in the finding of differential
LRRGT00176 expression due to gestational nicotine (FDR q = 0.24). However we could be confident that genes called as differentially expressed due to food-restriction using our original criteria were true positives, with multiple genes reaching significance at an FDR q,0.05 (Table 2).
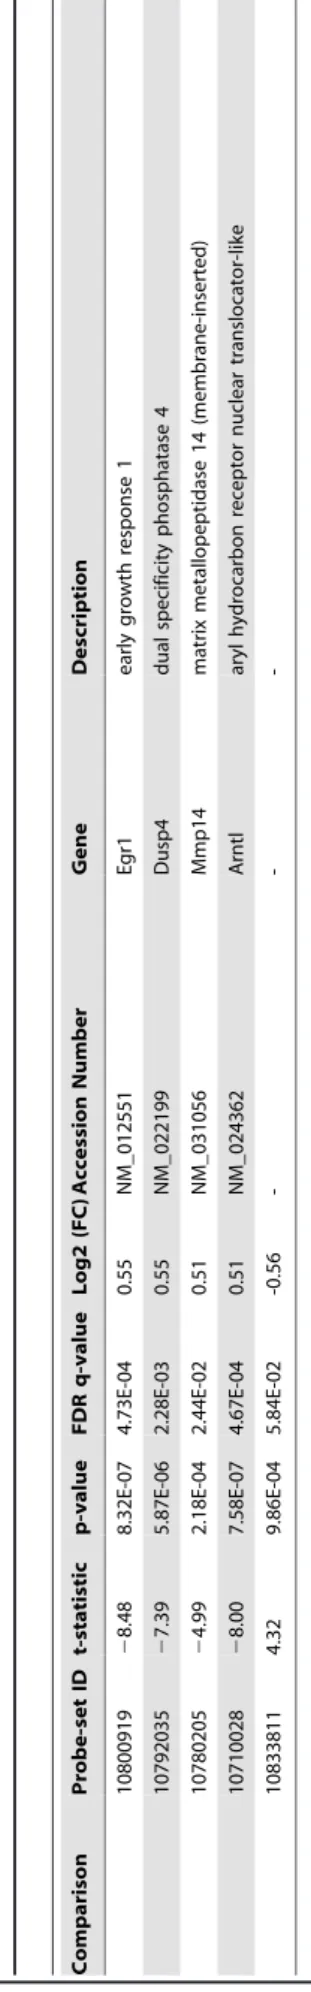
12 genes were found to be significantly differentially expressed in both the Nic vs. Con-Pf comparison and the Con vs. Con-Pf comparison, suggesting that imposed food-restriction had a dominant effect on striatal gene expression. These genes were predominantly immediate early genes (IEGs) and included; Fos, Fosl2, Junb, Arc, Egr1, Nr4a1andNr4a3. To confirm the effects of gestational food-restriction on striatal gene expression we used qRT-PCR to assess differential expression of 9 food-restriction-sensitive genes as a validation set. Significant differential expres-sion in the expected direction was confirmed for all butJunbusing qRT-PCR (90%, Table 3 and Figure 2).
Prenatal food-restriction affects genes involved in stress response pathways
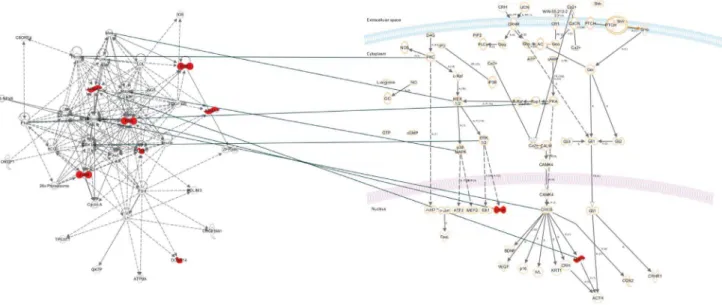
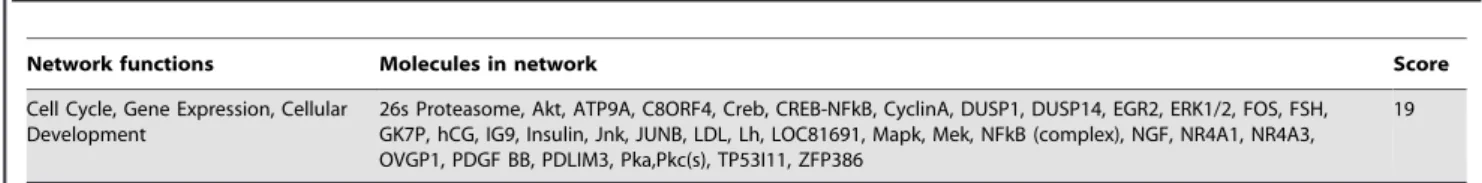
We aimed to characterise the functional relationship between genes that were regulated by prenatal food-restriction. To this end, we tested the 12 genes that were differentially expressed in both the Nic vs. Con-Pf and Con vs. Con-Pf comparisons for pathway enrichment using Ingenuity pathways analysis (IPA). 7 genes in the set formed an interconnected network (score = 19, Table 4, Figure 3). Further, functional enrichment analysis revealed that this gene list was enriched for genes involved in the stress response with ‘‘Corticotrophin releasing hormone signalling’’ (ratio = 2/ 136, p = 1.98610-03, Figure 3) and ‘‘Glucocorticoid receptor
signalling’’ (ratio = 2/280, p = 8.64610-03) featuring in the top 5
most enriched pathways (Table 5). These enrichment analyses show that while only a few genes are regulated by food-restriction, they appear to be functionally cohesive and related to develop-ment of the stress system.
Additional evidence for the role of prenatal food-restriction on stress pathways was sought using an independent analysis method. Genome-wide gene lists generated from the Con vs. Con-Pf and Nic vs. Con-Pf comparisons were analysed using Gene Set Enrichment Analysis (GSEA). This method does not rely on user-defined differential expression cut-offs but rather provides a measure of pathway enrichment at the top (or bottom) of a ranked gene list. To specifically test the hypothesis that genes involved in stress responsiveness are affected by gestational food-restriction we used GSEA to assess enrichment for genes in the ‘RESPONSE TO STRESS’ gene ontology (GO) category. We found significant enrichment for this pathway in the Con vs. Con-Pf comparison ranked gene list (p = 0.04, Figure 4) and a trend for significance in the Nic vs. Con-Pf comparison (p = 0.07). The genes that contributed to the enrichment signal in both lists are given in Table 6. As GSEA analysis does not rely on an arbitrary cut-off to be applied to the data it provides additional insight into the potential role of genes that do not reach statistical significance but are, nevertheless, present towards the top of the gene list. Using these analyses we identified further genes that are regulated by food-restriction that were of potential interest. Like the immediate early genes, a subset of these genes is involved in the cellular
response to environmental stress. For example we observed up-regulation ofHspb1,Gadd45A/GandDdit3which are regulated by heat shock, DNA damage and endoplasmic reticulum (ER) stress, respectively [46-48]. Further, the anti-proliferation factorBtg2is also up-regulated. Interestingly, this gene lies within a quantitative trait locus (QTL) for fear conditioning traits [49], suggesting a link to anxiety-like behaviours. Collectively, these data suggest that gestational food-restriction results in long term up-regulation of multiple stimulation-responsive genes whose role is to induce an appropriate cellular response to a variety of environmental stressors.
Global DNA methylation status and methylation at specific promoters does not explain food-restriction-induced gene expression changes
Given our observations of the up-regulation of stress-response genes due to food-restriction, we hypothesised that early stress leads to epigenetic reprogramming that primes neuronal cells for stressful encounters later in life. To assess the contribution of DNA methylation status on food-restriction-induced gene expression changes we assayed both global DNA methylation changes and locus-specific methylation patterns at Fos and Fosb genes. We found no evidence for differences in global methylation status between any of the groups analysed (Nic vs. Con-Pf, W = 45,
p = 0.70; Con vs. Con-Pf, W = 54, p = 0.50; Nic vs. Con-Pf W = 48, p = 0.28). Further, the majority of CpG sites assessed in the promoter regions ofFosand Fosbin this study displayed low methylation levels and very little variation in methylation status across samples (Figure S2 in File S1; average variance Fos = 9.661024, Fosb = 1.861023). We found no evidence for
DNA methylation differences between any of the groups for either of the genes tested.
Discussion and Conclusions
Prenatal nicotine exposure has limited effects on mRNA expression in the striatum of adolescent rats
We did not find any striking effects of prenatal nicotine exposure on gene expression profiles in the striatum of adolescent rats. However, six previous studies have reported mRNA expression differences due to prenatal exposure to nicotine across various brain regions [18,20,24,25,50]. We do not replicate the majority of these previously observed nicotine-induced changes (for a summary of previous observations see Table S2 in File S1). The lack of replication does not appear to be due to the thresholds that we used to call genes as differentially expressed as we observe just 12 previously reported genes to be differentially expressed when we apply a more relaxed threshold to the data (p,0.05, no Figure 1. Volcano plots representing group comparisons for all genes included in the analysis.x-axes represent log2 fold-changes and
y-axes represent the –log10(p-values) associated with the t-statistic. Vertical dotted lines are positioned at a log2 fold-change of 0.5 or20.5 and
horizontal dotted lines are positioned at the equivalent of p = 0.01. In red are those genes that are differentially expressed at p,0.01 and log2
fold-change.0.5 or,20.5. A) Nic vs. Con B) Nic vs. Con-Pf and C) Con vs. Con-Pf.
Table 2.Results from Student’s t-tests for all three group comparisons.
Comparison Probe-set ID t-statistic p-value FDR q-value Log2 (FC) Accession Number Gene Description
Nic vs. Con 10868302 3.97 2.20E-03 0.24 20.50 AY539927 LRRGT00176 mRNA
-Nic vs. Con-Pf 10727717 4.33 1.79E-03 0.26 1.44 NM_153626 Npas4 neuronal PAS domain protein 4
10886031 5.80 3.81E-05 0.04 0.98 NM_022197 Fos FBJ osteosarcoma oncogene
10899387 5.02 5.26E-04 0.17 0.97 NM_024388 Nr4a1 nuclear receptor subfamily 4, group A, member 1
10832802 6.39 1.29E-05 0.03 0.92 NM_053633 Egr2 early growth response 2
10904511 6.61 3.33E-05 0.04 0.85 NM_019361 Arc activity-regulated cytoskeleton-associated protein
10868940 3.97 1.32E-03 0.23 0.76 NM_031628 Nr4a3 nuclear receptor subfamily 4, group A, member 3
10806585 5.68 4.57E-05 0.05 0.65 NM_021836 Junb jun B proto-oncogene
10732652 4.62 3.58E-04 0.15 0.64 NM_053769 Dusp1 dual specificity phosphatase 1
10844339 5.48 1.05E-04 0.09 0.63 NM_145677 Slc25a25 solute carrier family 25
10940628 4.16 1.00E-03 0.22 0.57 NM_001013146.1 Fosb Rattus norvegicus FBJ osteosarcoma oncogene B (Fosb)
10940647 4.18 1.01E-03 0.22 0.56 NM_012954.1 Fosl2 Rattus norvegicus fos-like antigen 2 (Fosl2)
10834031 7.77 1.25E-06 7.80E-03 0.51 NM_001079893 Dusp14 dual specificity phosphatase 14
Con vs. Con-Pf 10899387 212.32 2.94E-09 1.49E-05 1.44 NM_024388 Nr4a1 nuclear receptor subfamily 4, group A, member 1/
10832802 29.06 3.07E-07 2.27E-04 1.22 NM_053633 Egr2 early growth response 2
10727717 23.43 6.01E-03 1.29E-01 1.16 NM_153626 Npas4 neuronal PAS domain protein 4
10868940 25.73 3.94E-05 8.09E-03 1.11 NM_031628 Nr4a3 nuclear receptor subfamily 4, group A, member 3
10904511 29.25 2.55E-07 2.10E-04 1.10 NM_019361 Arc activity-regulated cytoskeleton-associated protein
10886031 26.68 9.74E-06 2.88E-03 1.07 NM_022197 Fos FBJ osteosarcoma oncogene
10806585 27.30 1.84E-06 8.50E-04 0.79 NM_021836 Junb jun B proto-oncogene
10940628 25.45 6.88E-05 1.30E-02 0.78 NM_001013146.1 Fosb Rattus norvegicus FBJ osteosarcoma oncogene B (Fosb)
10760080 211.43 4.83E-09 1.49E-05 0.76 NM_001002829 Rasl11a RAS-like family 11 member A
10940647 25.35 8.89E-05 1.49E-02 0.74 NM_012954.1 Fosl2 Rattus norvegicus fos-like antigen 2 (Fosl2)
10872626 210.37 1.86E-08 3.44E-05 0.70 NM_153727 Gpr3 G protein-coupled receptor 3
10732652 25.42 5.86E-05 1.14E-02 0.70 NM_053769 Dusp1 dual specificity phosphatase 1
10844339 25.94 2.79E-05 6.08E-03 0.67 NM_145677 Slc25a25 solute carrier family 25
10834031 28.78 2.37E-07 2.10E-04 0.66 NM_001079893 Dusp14 dual specificity phosphatase 14
10716080 211.05 4.04E-08 5.97E-05 0.62 NM_133578 Dusp5 dual specificity phosphatase 5
10768332 211.81 6.03E-09 1.49E-05 0.61 NM_053453 Rgs2 regulator of G-protein signaling 2
10863676 26.15 2.26E-05 5.39E-03 0.61 NM_019137 Erg4 early growth response 4
10815763 25.36 7.19E-05 1.33E-02 0.57 NM_001107679 Tiparp TCDD-inducible poly(ADP-ribose) polymerase
10896793 26.80 9.41E-06 2.88E-03 0.57 NM_023985 Trib3 tribbles homolog 1 (Drosophila)
10719432 25.45 1.10E-04 1.60E-02 0.56 ENSRNOT00000022556 Fosb FBJ osteosarcoma oncogene B
10701846 214.66 6.90E-06 2.32E-03 0.56 NM_053698 Cited2 p300-interacting transactivator, with Glu/Asp-rich carboxy-terminal domain, 2
Early
Environme
ntal
Effects
on
Gene
Expression
PLOS
ONE
|
www.ploson
e.org
6
February
2014
|
Volume
9
|
Issue
2
|
fold change threshold, Table S2 in File S1). This overlap is no greater than we would expect by chance (Nic vs. Con, empirical p = 0.52; Nic vs. Con-Pf, empirical p = 0.69, see Methods S1 in File S1 for statistical analysis). Alternative explanations for the lack of replication are differences in study design and the choice of brain tissue analysed. We can reasonably expect that the effects of prenatal nicotine exposure will vary depending on brain region assayed, as well as developmental time-point. As such it is perhaps not surprising that we fail, in the adolescent striatum, to replicate findings from previous studies. Finally, we cannot exclude potential false negative results in our data that would reflect subtle effects of gestational nicotine on gene expression. However we would require larger sample sizes to robustly identify differentially expressed genes below the significance thresholds that were used in this study.
Maternal food-restriction has significant effects on mRNA expression in adolescence
In contrast to the effects of prenatal nicotine exposure, we identified striatal gene expression changes following restricted food access to pregnant dams. While it is known that mRNA expression of a selection of genes in both the liver and tissues of the HPA axis is affected by maternal undernutrition [29–32], we have provided the first evidence that the striatum is also affected. The set of genes identified contains multiple families of immediate early genes (Fos, Fosl2, Junb, Arc, Dusp1, Dusp14, Egr2, Nr4a1 and Nr4a3), which are known to be regulated by multiple external stimuli [51–54]. These genes are enriched for two stress-related pathways – ‘‘Corticotro-phin releasing hormone signalling’’ and ‘‘Glucorticoid receptor signalling’’ suggestive of food-restriction-induced developmental regulation of the organismal stress system. IEG expression is predominantly activity regulated and levels ofFosmRNA are often used as a marker of neuronal activity. As activity-induced transcription factors, IEGs have wide and varied effects on gene regulation that have been associated with multiple brain processes.
Arc is an important regulator of hippocampal function, where knock-down results in impairment of the maintenance phase of long-term potentiation and hampered long term spatial memory [55].Foshas also been described to have a role in learning and memory, with increased Fos expression in the medial prefrontal cortex being linked to aversive learning [56]. Furthermore, administration of amphetamine-based psychostimulants, including cocaine, causes coincident up-regulation of IEG expression and
Table 2. Cont. Comparison Probe-set ID t-statistic p-value FDR q-value Log2 (FC) Accession Number Gene Description 10800919 2 8.48 8.32E-07 4 .73E-04 0.55 NM_012551 Egr1 early growth response 1 10792035 2 7.39 5.87E-06 2 .28E-03 0.55 NM_022199 Dusp4 dual specificity phosphatase 4 10780205 2 4.99 2.18E-04 2 .44E-02 0.51 NM_031056 Mmp14 m atrix metallopeptidase 14 (membrane-inserted) 10710028 2 8.00 7.58E-07 4 .67E-04 0.51 NM_024362 Arntl aryl hydrocarbon receptor nuclear translocator-like 10833811 4.32 9.86E-04 5.84E-02 -0.56 -Shown are all genes reaching significance at p , 0.01 and |FC $ 0.5| ordered by FC. In bold are those genes that are up-regulated in both the Nic vs. Con and Con-Pf vs. Con comparisons. doi:10.1371/journal.pone. 0088896.t002
Table 3.qRT-PCR results for differentially expressed genes in microarray analysis.
Con vs Con-Pf Nic vs con-Pf
T p.value t p.value
Fosl2 24.46 1.91E-04 3.17 3.10E-03
Fos 26.10 5.13E-06 4.42 3.42E-04
Nr4a1 22.96 4.28E-03 3.66 1.11E-03
Nr4a3 24.46 1.91E-04 3.17 3.10E-03
Slc25a5 21.72 0.05 1.98 0.04
Arc 23.78 8.54E-04 3.72 1.11E-03
Junb 21.78 0.05 1.59 0.07
Dusp1 23.71 8.40E-04 3.17 2.94E-03
Egr2 22.39 0.01 1.76 0.05
synaptic dopamine release [57–62], suggesting an impact of IEG expression on the reward circuitry in the brain. This is of particular interest as these drugs primarily influence neurobehav-ioural features such as attention, impulsivity and hyperactivity [63]. Given the time from exposure to gene expression measure-ment and the rapidity of the culling procedure (neck dislocation, 2–3 seconds per animal), we interpret the observed gene expression differences to be due to baseline changes in IEG expression. Nevertheless, we cannot completely exclude the possibility of theoretical pair-feeding-induced increased sensitivity to stress and animals’ reactivity to culling. Little is known about the roles of IEGs at baseline, and indeed whether baseline differences in gene expression have an effect on stimulation-induced expression. Adaptation of gene expression to repeated immobilisation stress is observed for Fos mRNA in mice, with reduced induction being observed in multiple brain regions upon
activation by acute stress [64]. This suggests that Fos regulation may be reprogrammed in response to repeated encounters with stressful conditions. Further, It should also be noted that evolutionary adaptations to stressful conditions between yeast species involve baseline differences in the expression of stress-response genes [65]. These adaptive expression profiles may contribute to the differences observed in stimulus-induced expression of such genes [65]. In such a model, stress during early development would prime cells for later stressful encounters through baseline up-regulation of stress-response genes such asFos. Further work is required to describe the effects of gestational food-restriction on IEG-dependent changes in learning, memory, reward and stress responses.
To confirm up-regulation of stress-response genes we performed Gene Set Enrichment Analysis (GSEA). We reasoned that the gene ontology (GO) biological function category ‘‘RESPONSE
Figure 3. Ingenuity Pathways Analysis of genes identified as differentially expressed in the Nic vs. Con-Pf and the Con vs. Con-Pf comparisons.On the left is the top network identified consisting of 7/12 genes in our list, and on the right is the top associated canonical pathway. Highlighted red are the genes in our list that were over-expressed due to food-restriction.
doi:10.1371/journal.pone.0088896.g003
Figure 2. qRT-PCR validation of 9 food-restriction-sensitive genes. The y-axis represents the log2(fold changes) observed in both comparisons involving the food restricted group. Differences in gene expression using qRT-PCR were consistent with microarray data. The dashed
line represents the fold change cut-off (log2(fold change).0.5) used in the microarray analysis.
doi:10.1371/journal.pone.0088896.g002
TO STRESS’’ would be enriched in ranked gene lists from the Con vs. Con-Pf and the Nic vs. Con-Pf comparisons. This was the case for the Con vs. Con-Pf comparison. As this analysis was not restricted to arbitrary differential expression cut-offs, it allowed us to delve further into the data to identify additional potentially important genes that did not meet our threshold requirements. Interestingly, we observed a number of additional genes that appeared near the top of the ranked list and are involved in the cellular response to stress. These genes includeHspb1,Gadd45A/G
andDdit3that are responsive to heat shock, DNA damage/growth arrest and endoplasmic reticulum (ER) stress [46–48]. The reason for their persistent up-regulation is not entirely clear. However, we speculate that it may be similar to the increased baseline expression of IEGs – early developmental induction of the stress response through food-restriction induces reprogramming and an altered baseline level of mRNA expression. Food-restriction-induced early induction of stress response genes is likely to have consequences on normal brain development. For example, over-expression ofGadd45ain the developing mouse cortex is associated with decreased neurite complexity, soma hypertrophy and increases in cell death [66]. Chronic up-regulation during adolescence may have further detrimental consequences related to neuronal function and cell death. Ddit3 is responsive to ER stress, whereby exacerbation of ER stress using 1-Methyl-4-phenylpyridinium ion (MPP+) increases its expression level [67] and may contribute to Parkinson’s disease. Again, we do not know how baseline up-regulation of Ddit3affects the adolescent brain, although we speculate that defective ER stress signalling pathways will affect neuron integrity. Interestingly, changes in genes involved in the cellular response to stress may also have an effect on the organismal response to stress. This is evident from a recent study describing the role of mutations inC. elegansDNA repair and apoptotic pathway genes conferring resistance to environmental stressors such as heat shock and osmotic stress [68]. Early developmental alterations in similar pathways may display similar effects. Future work should aim to further understand whether food-restriction during gestation is capable of altering both cellular and organismal responses to stress stimuli.
Recent epigenetic studies have provided a framework through which the environment can shape gene expression patterns in later life and alter offspring behaviour [69–71]. For example, maternal protein restriction is associated with a reduction in DNA methylation at the promoter of the Cyclin-dependent kinase inhibitor 1C (Cdkn1c) promoter [72] which results in an increase in mRNA levels. This suggests that early protein deprivation is associated with epigenetic reprogramming of a certain set of genes whose dysregulation may be responsible for alterations in behaviour. We hypothesised that food-restriction-induced up-regulation of IEG expression may be due to early acquired epigenetic marks that persist into adolescence and explain the observed differences in mRNA regulation. However, we failed to find anyglobalDNA methylation effects or changes in patterns of DNA methylation across two regions within Fos or Fosb. Our results on global DNA methylation are consistent with studies in humans [73] and suggest that specific regulatory regions govern the observed gene expression patterns. Given the very low and invariant methylation levels at Fos and Fosb promoters it is was unlikely that they would harbor critical sites of regulation. Nevertheless, these data do not rule out the potential of DNA methylation or alternative epigenetic marks to set up an early program of gene expression that persists into adolescence.
Limitations
The unexpected limitation of the current study was a potential interaction between prenatal undernutrition and different stress levels induced by either nicotine exposure or enforced food availability. Our intention was to control for reduced food intake
Table 5.The top 5 canonical pathways identified for genes differentially expressed due to food-restriction.
Canonical pathway p-value Ratio
Corticotrophin Releasing Hormone Signalling 1.98E-03 2/136 (0.015)
NRF2-mediated Oxidative Stress Response 3.91E-03 2/183 (0.011)
RAR Activation 3.91E-03 2/181 (0.011)
ERK/MAPK Signalling 4.33E-03 2/192 (0.01)
Glucocorticoid Receptor Signalling 8.64E-03 2/280 (0.007)
doi:10.1371/journal.pone.0088896.t005
Figure 4. Gene set enrichment analysis (GSEA) of the GO pathway ‘‘RESPONSE_TO_STRESS’’ in the Con vs. Con-Pf comparison. The input gene list was all genes in the microarray
analysis ranked by –log10(p-value)6log2(fold change). The enrichment
score profile displays an enrichment of pathway hits at the top of the list, suggesting multiple top-ranked genes involved in the ‘‘Response to stress’’ pathway.
doi:10.1371/journal.pone.0088896.g004
Table 4.IPA identified a functional network of genes that included 7 genes differentially expressed due to food-restriction.
Network functions Molecules in network Score
Cell Cycle, Gene Expression, Cellular Development
26s Proteasome, Akt, ATP9A, C8ORF4, Creb, CREB-NFkB, CyclinA, DUSP1, DUSP14, EGR2, ERK1/2, FOS, FSH, GK7P, hCG, IG9, Insulin, Jnk, JUNB, LDL, Lh, LOC81691, Mapk, Mek, NFkB (complex), NGF, NR4A1, NR4A3, OVGP1, PDGF BB, PDLIM3, Pka,Pkc(s), TP53I11, ZFP386
19
experienced in the Nic group by using a pair-feeding protocol. However, as gene expression changes in Con-Pf group were seen over and above any small nicotine-induced differences it may suggest either ameliorating effects of nicotine or existence of additional factors, e.g., higher stress, in pair-fed animals. Thus, we were able to control for undernutrition (using Con-Pf) as well as the stress induced by pair-feeding (using Con), but not for a potential stress x undernutrition interaction. Unfortunately, there is no obvious way to do this in one experiment. Nevertheless, under our study conditions, there were no strong effects of gestational nicotine exposure on striatal gene expression.
Conclusion
Our work has highlighted a role for maternal food-restriction on the long-term regulation of immediate early genes and stress-response genes in the striatum of adolescent rats. Future studies should therefore focus on establishing the link between food-restriction, stress, IEG expression and phenotypic outcome.
Data availability
Microarray data are available from the Gene Expression Omnibus (GEO) (http://www.ncbi.nlm.nih.gov/geo/) under ac-cession number GSE50607.
Supporting Information
File S1 Supporting information. (DOCX)
Acknowledgments
We would like to thank Dr Emma Meaburn and Dr Chloe Wong for technical assistance during microarray and sequenom data generation, respectively.
Author Contributions
Conceived and designed the experiments: LB IPS PA TS JM. Performed the experiments: TS NEI GB ED. Analyzed the data: NEI LS. Wrote the paper: NEI PA TS.
References
1. Badlissi D, Guillemette A, Fadin A (2001) Prematurity and low birth weight: effects of active and passive smoking during pregnancy. Can J Public Health 92: 272–275.
2. Blake KV, Gurrin LC, Evans SF, Beilin LJ, Landau LI, et al. (2000) Maternal cigarette smoking during pregnancy, low birth weight and subsequent blood pressure in early childhood. Early Hum Dev 57: 137–147.
3. Lam SK, To WK, Duthie SJ, Ma HK (1992) The effect of smoking during pregnancy on the incidence of low birth weight among Chinese parturients. Aust N Z J Obstet Gynaecol 32: 125–128.
4. Langley K, Holmans PA, van den Bree MB, Thapar A (2007) Effects of low birth weight, maternal smoking in pregnancy and social class on the phenotypic manifestation of Attention Deficit Hyperactivity Disorder and associated antisocial behaviour: investigation in a clinical sample. BMC Psychiatry 7: 26. 5. Ventura SJ, Hamilton BE, Mathews TJ, Chandra A (2003) Trends and variations in smoking during pregnancy and low birth weight: evidence from the birth certificate, 1990–2000. Pediatrics 111: 1176–1180.
6. Winzer-Serhan UH (2008) Long-term consequences of maternal smoking and developmental chronic nicotine exposure. Front Biosci 13: 636–649.
7. Sanghavi DM (1995) Epidemiology of sudden infant death syndrome (SIDS) for Kentucky infants born in 1990: maternal, prenatal, and perinatal risk factors. J Ky Med Assoc 93: 286–290.
8. Banerjee TD, Middleton F, Faraone SV (2007) Environmental risk factors for attention-deficit hyperactivity disorder. Acta Paediatr 96: 1269–1274. 9. Linnet KM, Dalsgaard S, Obel C, Wisborg K, Henriksen TB, et al. (2003)
Maternal lifestyle factors in pregnancy risk of attention deficit hyperactivity disorder and associated behaviors: review of the current evidence. Am J Psychiatry 160: 1028–1040.
10. Thapar A, Fowler T, Rice F, Scourfield J, van den Bree M, et al. (2003) Maternal smoking during pregnancy and attention deficit hyperactivity disorder symptoms in offspring. Am J Psychiatry 160: 1985–1989.
11. Murrin LC, Ferrer JR, Zeng WY, Haley NJ (1987) Nicotine administration to rats: methodological considerations. Life Sci 40: 1699–1708.
12. Peters MA, Ngan LL (1982) The effects of totigestational exposure to nicotine on pre- and postnatal development in the rat. Arch Int Pharmacodyn Ther 257: 155–167.
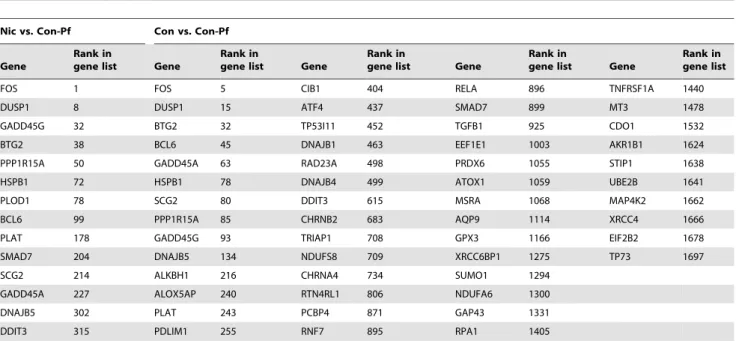
Table 6.Genes in the core enrichment (i.e. contributing to the maximum enrichment score for the gene set ‘‘RESPONSE_TO_STRESS’’) from each gene list.
Nic vs. Con-Pf Con vs. Con-Pf
Gene
Rank in
gene list Gene
Rank in
gene list Gene
Rank in
gene list Gene
Rank in
gene list Gene
Rank in gene list
FOS 1 FOS 5 CIB1 404 RELA 896 TNFRSF1A 1440
DUSP1 8 DUSP1 15 ATF4 437 SMAD7 899 MT3 1478
GADD45G 32 BTG2 32 TP53I11 452 TGFB1 925 CDO1 1532
BTG2 38 BCL6 45 DNAJB1 463 EEF1E1 1003 AKR1B1 1624
PPP1R15A 50 GADD45A 63 RAD23A 498 PRDX6 1055 STIP1 1638
HSPB1 72 HSPB1 78 DNAJB4 499 ATOX1 1059 UBE2B 1641
PLOD1 78 SCG2 80 DDIT3 615 MSRA 1068 MAP4K2 1662
BCL6 99 PPP1R15A 85 CHRNB2 683 AQP9 1114 XRCC4 1666
PLAT 178 GADD45G 93 TRIAP1 708 GPX3 1166 EIF2B2 1678
SMAD7 204 DNAJB5 134 NDUFS8 709 XRCC6BP1 1275 TP73 1697
SCG2 214 ALKBH1 216 CHRNA4 734 SUMO1 1294
GADD45A 227 ALOX5AP 240 RTN4RL1 806 NDUFA6 1300
DNAJB5 302 PLAT 243 PCBP4 871 GAP43 1331
DDIT3 315 PDLIM1 255 RNF7 895 RPA1 1405
doi:10.1371/journal.pone.0088896.t006
13. Schneider T, Bizarro L, Asherson PJ, Stolerman IP (2010) Gestational exposure to nicotine in drinking water: teratogenic effects and methodological issues. Behav Pharmacol 21: 206–216.
14. Pauly JR, Sparks JA, Hauser KF, Pauly TH (2004) In utero nicotine exposure causes persistent, gender-dependant changes in locomotor activity and sensitivity to nicotine in C57Bl/6 mice. Int J Dev Neurosci 22: 329–337.
15. Tizabi Y, Popke EJ, Rahman MA, Nespor SM, Grunberg NE (1997) Hyperactivity induced by prenatal nicotine exposure is associated with an increase in cortical nicotinic receptors. Pharmacol Biochem Behav 58: 141–146. 16. Vaglenova J, Birru S, Pandiella NM, Breese CR (2004) An assessment of the long-term developmental and behavioral teratogenicity of prenatal nicotine exposure. Behav Brain Res 150: 159–170.
17. Schneider T, Bizarro L, Asherson PJ, Stolerman IP (2012) Hyperactivity, increased nicotine consumption and impaired performance in the five-choice serial reaction time task in adolescent rats prenatally exposed to nicotine. Psychopharmacology (Berl).
18. Schneider T, Ilott N, Brolese G, Bizarro L, Asherson PJ, et al. (2011) Prenatal exposure to nicotine impairs performance of the 5-choice serial reaction time task in adult rats. Neuropsychopharmacology 36: 1114–1125.
19. Abreu-Villaca Y, Filgueiras CC, Manhaes AC (2011) Developmental aspects of the cholinergic system. Behav Brain Res 221: 367–378.
20. Chen H, Parker SL, Matta SG, Sharp BM (2005) Gestational nicotine exposure reduces nicotinic cholinergic receptor (nAChR) expression in dopaminergic brain regions of adolescent rats. Eur J Neurosci 22: 380–388.
21. Lv J, Mao C, Zhu L, Zhang H, Pengpeng H, et al. (2008) The effect of prenatal nicotine on expression of nicotine receptor subunits in the fetal brain. Neurotoxicology 29: 722–726.
22. Mao C, Yuan X, Cui Y, Li H, Lv J, et al. (2008) Prenatal exposure to nicotine with associated in utero hypoxia decreased fetal brain muscarinic mRNA in the rat. Brain Res 1189: 43–50.
23. Kane VB, Fu Y, Matta SG, Sharp BM (2004) Gestational nicotine exposure attenuates nicotine-stimulated dopamine release in the nucleus accumbens shell of adolescent Lewis rats. J Pharmacol Exp Ther 308: 521–528.
24. Cao J, Dwyer JB, Mangold JE, Wang J, Wei J, et al. (2011) Modulation of cell adhesion systems by prenatal nicotine exposure in limbic brain regions of adolescent female rats. Int J Neuropsychopharmacol 14: 157–174.
25. Wei J, Wang J, Dwyer JB, Mangold J, Cao J, et al. (2011) Gestational nicotine treatment modulates cell death/survival-related pathways in the brains of adolescent female rats. Int J Neuropsychopharmacol 14: 91–106.
26. Grunberg NE, Winders SE, Popp KA (1987) Sex differences in nicotine’s effects on consummatory behavior and body weight in rats. Psychopharmacology (Berl) 91: 221–225.
27. Mineur YS, Abizaid A, Rao Y, Salas R, DiLeone RJ, et al. (2011) Nicotine decreases food intake through activation of POMC neurons. Science 332: 1330– 1332.
28. Laborie C, Molendi-Coste O, Breton C, Montel V, Vandenbulcke F, et al. (2011) Maternal perinatal undernutrition has long-term consequences on morphology, function and gene expression of the adrenal medulla in the adult male rat. J Neuroendocrinol 23: 711–724.
29. Palou M, Priego T, Sanchez J, Palou A, Pico C (2012) Metabolic programming of sirtuin 1 (SIRT1) expression by moderate energy restriction during gestation in rats may be related to obesity susceptibility in later life. Br J Nutr: 1–8. 30. Altmann S, Murani E, Schwerin M, Metges CC, Wimmers K, et al. (2012)
Somatic cytochrome c (CYCS) gene expression and promoter-specific DNA methylation in a porcine model of prenatal exposure to maternal dietary protein excess and restriction. Br J Nutr 107: 791–799.
31. Manuel-Apolinar L, Zarate A, Rocha L, Hernandez M (2010) Fetal malnutrition affects hypothalamic leptin receptor expression after birth in male mice. Arch Med Res 41: 240–245.
32. Sebert SP, Hyatt MA, Chan LL, Yiallourides M, Fainberg HP, et al. (2010) Influence of prenatal nutrition and obesity on tissue specific fat mass and obesity-associated (FTO) gene expression. Reproduction 139: 265–274.
33. Salas R, De Biasi M (2008) Opposing actions of chronic stress and chronic nicotine on striatal function in mice. Neurosci Lett 440: 32–34.
34. Carmona S, Proal E, Hoekzema EA, Gispert JD, Picado M, et al. (2009) Ventro-striatal reductions underpin symptoms of hyperactivity and impulsivity in attention-deficit/hyperactivity disorder. Biol Psychiatry 66: 972–977. 35. Cubillo A, Halari R, Ecker C, Giampietro V, Taylor E, et al. (2010) Reduced
activation and inter-regional functional connectivity of fronto-striatal networks in adults with childhood Attention-Deficit Hyperactivity Disorder (ADHD) and persisting symptoms during tasks of motor inhibition and cognitive switching. J Psychiatr Res 44: 629–639.
36. Cubillo A, Halari R, Giampietro V, Taylor E, Rubia K (2011) Fronto-striatal underactivation during interference inhibition and attention allocation in grown up children with attention deficit/hyperactivity disorder and persistent symptoms. Psychiatry Res 193: 17–27.
37. Paloyelis Y, Mehta MA, Kuntsi J, Asherson P (2007) Functional MRI in ADHD: a systematic literature review. Expert Rev Neurother 7: 1337–1356. 38. Perlov E, Philipsen A, Matthies S, Drieling T, Maier S, et al. (2009)
Spectroscopic findings in attention-deficit/hyperactivity disorder: review and meta-analysis. World J Biol Psychiatry 10: 355–365.
39. Irizarry RA, Hobbs B, Collin F, Beazer-Barclay YD, Antonellis KJ, et al. (2003) Exploration, normalization, and summaries of high density oligonucleotide array probe level data. Biostatistics 4: 249–264.
40. Fernandes C, Paya-Cano JL, Sluyter F, D9Souza U, Plomin R, et al. (2004) Hippocampal gene expression profiling across eight mouse inbred strains: towards understanding the molecular basis for behaviour. Eur J Neurosci 19: 2576–2582.
41. Shi L, Jones WD, Jensen RV, Harris SC, Perkins RG, et al. (2008) The balance of reproducibility, sensitivity, and specificity of lists of differentially expressed genes in microarray studies. BMC Bioinformatics 9 Suppl 9: S10.
42. Subramanian A, Tamayo P, Mootha VK, Mukherjee S, Ebert BL, et al. (2005) Gene set enrichment analysis: a knowledge-based approach for interpreting genome-wide expression profiles. Proc Natl Acad Sci U S A 102: 15545–15550. 43. Subramanian A, Kuehn H, Gould J, Tamayo P, Mesirov JP (2007) GSEA-P: a desktop application for Gene Set Enrichment Analysis. Bioinformatics 23: 3251– 3253.
44. Karimi M, Johansson S, Ekstrom TJ (2006) Using LUMA: a Luminometric-based assay for global DNA-methylation. Epigenetics 1: 45–48.
45. Storey JD, Tibshirani R (2003) Statistical significance for genomewide studies. Proc Natl Acad Sci U S A 100: 9440–9445.
46. Kirbach BB, Golenhofen N (2011) Differential expression and induction of small heat shock proteins in rat brain and cultured hippocampal neurons. J Neurosci Res 89: 162–175.
47. Pavlovsky AA, Boehning D, Li D, Zhang Y, Fan X, et al. (2013) Psychological stress, cocaine and natural reward each induce endoplasmic reticulum stress genes in rat brain. Neuroscience 246: 160–169.
48. Salvador JM, Brown-Clay JD, Fornace AJ Jr (2013) Gadd45 in stress signaling, cell cycle control, and apoptosis. Adv Exp Med Biol 793: 1–19.
49. Parker CC, Sokoloff G, Cheng R, Palmer AA (2012) Genome-wide association for fear conditioning in an advanced intercross mouse line. Behav Genet 42: 437–448.
50. Park MK, Loughlin SE, Leslie FM (2006) Gestational nicotine-induced changes in adolescent neuronal activity. Brain Res 1094: 119–126.
51. Kamme F, Campbell K, Wieloch T (1995) Biphasic expression of the fos and jun families of transcription factors following transient forebrain ischaemia in the rat. Effect of hypothermia. Eur J Neurosci 7: 2007–2016.
52. Pinaud R, Penner MR, Robertson HA, Currie RW (2001) Upregulation of the immediate early gene arc in the brains of rats exposed to environmental enrichment: implications for molecular plasticity. Brain Res Mol Brain Res 91: 50–56.
53. Smith MA, Kim SY, van Oers HJ, Levine S (1997) Maternal deprivation and stress induce immediate early genes in the infant rat brain. Endocrinology 138: 4622–4628.
54. Umemoto S, Kawai Y, Senba E (1994) Differential regulation of IEGs in the rat PVH in single and repeated stress models. Neuroreport 6: 201–204. 55. Guzowski JF, Lyford GL, Stevenson GD, Houston FP, McGaugh JL, et al.
(2000) Inhibition of activity-dependent arc protein expression in the rat hippocampus impairs the maintenance of long-term potentiation and the consolidation of long-term memory. J Neurosci 20: 3993–4001.
56. Morrow BA, Elsworth JD, Inglis FM, Roth RH (1999) An antisense oligonucleotide reverses the footshock-induced expression of fos in the rat medial prefrontal cortex and the subsequent expression of conditioned fear-induced immobility. J Neurosci 19: 5666–5673.
57. Allen JK, Wilkinson M, Soo EC, Hui JP, Chase TD, et al. (2010) Chronic low dose Adderall XR down-regulates cfos expression in infantile and prepubertal rat striatum and cortex. Neuroscience 169: 1901–1912.
58. Banerjee PS, Aston J, Khundakar AA, Zetterstrom TS (2009) Differential regulation of psychostimulant-induced gene expression of brain derived neurotrophic factor and the immediate-early gene Arc in the juvenile and adult brain. Eur J Neurosci 29: 465–476.
59. Beauvais G, Jayanthi S, McCoy MT, Ladenheim B, Cadet JL (2010) Differential effects of methamphetamine and SCH23390 on the expression of members of IEG families of transcription factors in the rat striatum. Brain Res 1318: 1–10. 60. Daberkow DP, Riedy MD, Kesner RP, Keefe KA (2008) Effect of methamphetamine neurotoxicity on learning-induced Arc mRNA expression in identified striatal efferent neurons. Neurotox Res 14: 307–315.
61. Thiriet N, Zwiller J, Ali SF (2001) Induction of the immediate early genes egr-1 and c-fos by methamphetamine in mouse brain. Brain Res 919: 31–40. 62. Wang JQ, McGinty JF (1996) Acute methamphetamine-induced zif/268,
preprodynorphin, and preproenkephalin mRNA expression in rat striatum depends on activation of NMDA and kainate/AMPA receptors. Brain Res Bull 39: 349–357.
63. Sora I, Li B, Fumushima S, Fukui A, Arime Y, et al. (2009) Monoamine transporter as a target molecule for psychostimulants. Int Rev Neurobiol 85: 29– 33.
64. Ons S, Rotllant D, Marin-Blasco IJ, Armario A (2010) Immediate-early gene response to repeated immobilization: Fos protein and arc mRNA levels appear to be less sensitive than c-fos mRNA to adaptation. European Journal of Neuroscience 31: 2043–2052.
65. Tirosh I, Wong KH, Barkai N, Struhl K (2011) Extensive divergence of yeast stress responses through transitions between induced and constitutive activation. Proc Natl Acad Sci U S A 108: 16693–16698.
66. Sarkisian MR, Siebzehnrubl D (2012) Abnormal levels of Gadd45alpha in developing neocortex impair neurite outgrowth. PLoS One 7: e44207. 67. Zeng XS, Jia JJ, Kwon Y, Wang SD, Bai J (2013) The role of thioredoxin-1