Abstract—Recently, some studies emphasize the potential problems in using estimated parameter values in an independent study for analysis of the primary study, and introduce the concept of “transportability.” As far as we know, however, a mathematical definition and statistical considerations of the transportability have not been fully developed. This paper defines the transportability of a regression model, presents a sufficient condition, describes a necessary assumption, and examines the transportability of the regression model with real data. The motivation of the study comes from the fact that we have to wait for the results of an over ten-year cohort study being conducted at the Radiation Effects Research Foundation to know the epidemiological significance of waist circumference (WC) in the definition of the metabolic syndrome (MS). We considered that it would be possible to estimate the risk associated with WC if an unbiased estimate of WC for each subject ten years earlier could be obtained based on the transportability arguments. Implementing this idea with the cohort database administered by the Radiation Effect Research Foundation, we obtained the relative risk of death from MS-related causes. The results indicated that the risk of death was smaller for a larger WC, which contradicted the suggestion that the risk of death should be higher for a larger WC. The implications of our results are discussed.
Index Terms— Transportability, Survival Analysis, Retrospective Cohort Study, Metabolic Syndrome.
I. INTRODUCTION
The validity of the diagnostic criteria for Metabolic Syndrome (MS) has been questioned since the syndrome was introduced [1]–[3]. To verify the criteria validity, the best strategy would be a cohort study. However, waist
Manuscript received August 16, 2009. RERF is a private, non-profit foundation funded by the Japanese Ministry of Health Labour and Welfare and the U.S. Department of Energy, with the latter funding provided in part through the National Academy of Sciences. This study was based on RERF research protocol RP A04-08.
N. Ishida is with the Graduate School of Science and Technology, Nagasaki University, Nagasaki, Japan, and also with the Radiation Effects Research Foundation, Nagasaki, Japan (corresponding author to provide phone: +81-95-819-2747; fax: +81-95-843-1782;
e-mail: [email protected]).
S. Ichimaru is with the Radiation Effects Research Foundation, Nagasaki, Japan, and also with the Graduate School of Science and Technology, Nagasaki University, Nagasaki, Japan (e-mail: [email protected]).
T. Nakamura is with the Graduate School of Science and Technology, Nagasaki University, Nagasaki, Japan (e-mail: [email protected]).
M. Akahoshi is with the Radiation Effects Research Foundation, Nagasaki, Japan (e-mail: [email protected]).
circumference (WC), which is necessary for the diagnosis of MS, was introduced to health examinations only recently. If a current regression model of WC could be transported to an earlier sample, a cohort study using estimates of WC would be possible. On the other hand, [4] emphasize the potential dangers in using estimated parameter values in an independent-study for analysis of the primary study, and introduce the concept of “transportability.” Transportability means “not only the model but also the relevant parameter estimates can be transported without bias.” Therefore, we define the transportability of a regression model, propose a sufficient condition for the transportability from a mathematical point of view. Using data from the Radiation Effect Research Foundation (RERF), we examined whether the proposed condition could be statistically confirmed in a real dataset. A transported estimate of WC was then obtained for each examinee for a period ten years earlier in the RERF sample and was used as a covariate in a Cox proportional hazards model to estimate an association between WC and the risk of MS-related causes of death.
II. TRANSPORTABILITY OF A REGRESSION MODEL We assume a population Γ1of elements( , )yx that follow a regression model
T 2
, (0, ) y= +α β x+ε ε~N σ
(1) wherey is a response variable, x=( ,...,x1 xp) is a vector
of explanatory variables, β is a vector of regression coefficients, and ε is a normal random variable with mean 0 and variance σ2 . Let S ={( ,y1 x1),..., (ym,xm)} be a random sample of Γ1 and
T ˆ ˆ ˆ
y= +α β x (2)
be a sample regression equation associated with S.
We also consider a similar but distinct population Γ1*of elements (y*,x*) that follow a regression model
* * *T * *, * (0, *2) y =α +β x +ε ε ~N σ
(1*)
On Transportability of Parameters and
Estimation of Risks associated with Metabolic
Syndrome
Let S*={(y1*,x1*),..., (ym**,xm**)} be a random sample of 1
Γ* and * ˆ* ˆ*T * ˆ
y =α +β x (2*)
be a sample regression equation associated with S*. Let us put Δ = −α α*.
Definition (Transportability)
When β β= *holds, (2) is termed as transportable to Γ1* and α βˆ+ ˆT *x is a transported estimate of y*for given x*in
1
Γ*
. Conversely, (2*) is transportable to Γ1 and αˆ*+βˆ*Tx
is a transported estimate of y for given x in Γ1.
When β β= *and the sample size m is large, βˆT *x should be approximately equal to β*T *x and therefore
* ˆ ˆT *
( )
y − α β+ x should be approximately distributed as *2
( , ) N Δσ .
The bias Δ does not affect relative risks between different values of *
y in terms of the Cox regression model in this study.
Proposition (A sufficient condition for Transportability)
When Γ1 and
1
Γ*
are both multivariate normal distributions, β and β* are determined by the variance matrix of Γ1 and that of
1
Γ*
, respectively [5]. In other words, the equality of the variance matrices of the multivariate normal distributions is a sufficient condition for the transportability. Furthermore, since σ2 in (1) is also determined by the variance matrix of Γ1 [5], the equality of the variance matrices leads to not only the transportability but also σ2=σ*2.
To apply the Proposition with y unavailable, we need a certain practical assumption. Let x*=(x1*,...,x*p) denote a vector of p test results and y* an unknown WC value for an examinee ten years earlier.
Definition (y-Homogeneity)
Let Γ0 denote the marginal distribution of x in Γ1 and
0
Γ* that of x* in
1
Γ* . We consider the following two conditions:
(A) Γ0 , Γ*0 , and Γ1 are all multivariate normal distributions and the variance matrices of Γ0 and Γ*0 are mutually equal.
(B) Γ1*is a multivariate normal distribution and the variance matrices of Γ1andΓ1* are mutually equal.
We say y-Homogeneity holds from Γ1 to Γ1* if (B) follows from (A).
To extrapolate estimates, we must make an assumption about relationships between variables beyond the limit of the observations [6]. The assumption y -Homogeneity implies that if the relationships among the components of x* ten years earlier still hold now among x and the relationship between y and x is normal now, then the latter relationships also hold between y* and x* ten years earlier. Since WC was not measured ten years ago, the direct verification of the WC-Homogeneity is difficult. Instead, Weight-Homogeneity will be investigated in detail and the results will be extrapolated with medical considerations to WC-Homogeneity.
In statistical applications, the equality of the variance matrix between Γ1 and
1
Γ*
is examined by hypothesis testing using samples, therefore, even if the null hypothesis of the equality is not rejected, it does not ensure the mathematical equality. The results of the tests depend on their sample sizes, as well. Furthermore, since the magnitude of the errors in the transported estimates also depends on the sample size, it should be confirmed that the sample size is large enough for transported estimates to be sufficiently accurate for use in risk analysis.
III. DATASET
A total of 3,374 men in Nagasaki have received biennial health examinations since 1958 as part of a follow-up program associated with the Radiation Effects Research Foundation (RERF), formally the Atomic Bomb Casualty Commission. A detailed description of that program has been published elsewhere [7], [8]. The examination records for 667 men who were younger than 75 years old, similar to the Framingham study [9], with valid height and weight measurements in 1994-96 (the 19th examination period), and 323 men satisfying the same condition in 2004-06 (the 24th examination period), were analyzed in the present study. The examination items included: height, weight, temperature, systolic blood pressure (SBP), diastolic blood pressure (DBP), asparate aminotransferase (AST), alanine aminotransferase (ALT), glucose (GLU), alkaline phosphatase (ALP), cholinesterase (ChE), serum urea (UA), triglyceride (TG), total cholesterol (T-Cho), albumin (Alb), iron (Fe), high-density lipoprotein (HDL-Cho), white blood cell counts (WBC), red blood cell counts (RBC), thymol turbidity test (TTT), hemoglobin (Hb), hematocrit (Ht), and platelet count (PLT). Waist circumference (WC) has been measured only since 2004. Further, BMI (body mass index) for all participants was calculated from height and weight.
2) Hypertension: blood pressure ≥ 130/85 mmHg
3) Impaired glucose tolerance: fasting plasma glucose ≥ 110 mg/dl.
In this study, those with at least two of these three criteria will be referred to as “Semi-MS.”
IV. ANALYSIS OF DATA
A. Verification of Transportability of a Regression Model
Using the RERF cohort database and Weight which is strongly associated with WC, we first examined whether the conditions (A) and (B) for Weight-Homogeneity in the Definition holds as well as whether the transportability of Weight holds between the current sample and the sample ten years earlier. Based on the results, we considered the transportability of WC. The Henze-Zirkler test and the Bartlett test were used to test the multivariate normality and the equality of two variance matrices, respectively. The stepwise variable selection methods were applied to obtain linear regression equations for each Weight and WC. Analyses are performed with SAS 9.1.
B. The Risk of Death using Transported Estimates
We first constructed a linear regression equation for WC on the current sample. Secondly, the assumption for WC-Homogeneity was examined with the selected variables. Then, a transported estimate of WC was obtained for each examinee in the sample ten years earlier. Finally, we applied the Cox regression model using the transported estimate of
WC, SemiMS (1 for Semi-MS, 0 for otherwise) and Age as covariates:
[
]
01 2 3 4
ln t ln WC SemiMS ln t
ln WC SemiMS ln WC SemiMS Age
λ λ
β β β β
= +
+ + × +
| ( ), ( )
( ) ( )
where λ0( )t is an unspecified baseline hazard, × denotes
interaction and β’s are regression coefficients to estimate. Hereafter, the difference lnλ
[
t ln WC SemiMS| ( ),]
−lnλ0( )t will be denoted by ln RR( ), since it is normally understood as a log relative risk.The follow-up period is ten years and the endpoint is MS-related death. To treat non-linearity of WC in relative risk functions, the following piecewise linear functions [10] were employed:
1 1 1
< Age−C >=max(Age−C , 0), C =50, 55, 60, 65, 70
{
}
2 2
2
< ( ) C max ( ) C , 0 ,
C 70, 75,80,85, 90, 95
ln WC −ln >= ln WC −ln =
where ln denotes log-transformation. Interactions between selected variables will also be employed.
V. RESULTS
A. Normalization
Since the variables are all continuous, Box-Cox transformation [11] was applied to normalize each variable. Normality was tested using the skewness, kurtosis, and Shapiro-Wilk tests. We excluded extreme measurements and some variables that were difficult to transform to normal. The basic statistics of the variables remained for statistical analyses are shown in Table 1.
TABLE 1.RESULTS OF NORMALIZATION
Mean SD N Mean SD N
Height 163.67 5.800 317 163.35 5.917 667 ln(Weight) 4.12 0.166 317 4.09 0.160 667 ln(SBP) 4.85 0.136 317 4.87 0.145 667 ChE 1.01 0.176 303 0.99 0.185 602 UA 5.56 1.293 313 5.95 1.325 615 T-Cho 197.63 33.157 314 192.02 33.343 620 ln(HDL-Cho) 3.91 0.253 312 3.95 0.275 614 RBC 458.90 43.205 309 466.38 42.043 609 Hb2 210.73 36.384 306 213.56 36.144 609 PLT1/2 4.39 0.509 307 4.45 0.578 609
ln(WC) 4.43 0.108 317 - -
-BMI 3.13 0.140 317 3.11 0.136 667 Current Ten years previous
B. Transportability of the Regression Model for Weight and WC
We first examined the transportability of Weight which is strongly correlated with WC (r=0.88, n=323) in the current sample. The regression equation for Weight on the current sample is as follows:
1.01 0.014 0.18
0.20 0.013 0.14
0.00054
Weight Height SBP
ChE UA HDL
RBC
= + × + ×
+ × + × − ×
+ ×
(7)
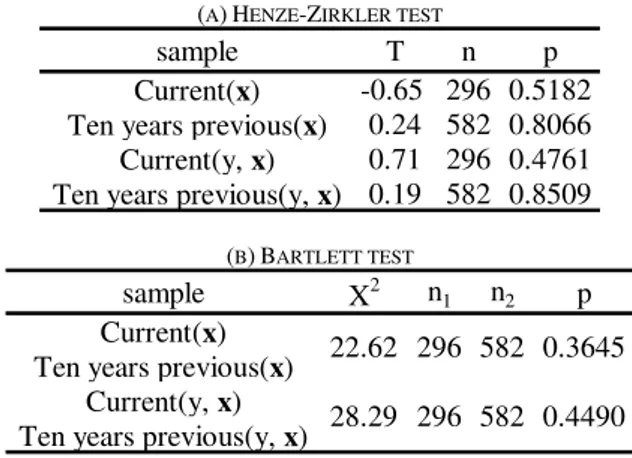
We applied the tests described in Section II to examine the conditions (A) and (B) of Weight-Homogeneity using the selected six variables to obtain the results shown in Table 2. First, the multivariate normality for each of Γ0, Γ*0, Γ1, andΓ1*is not rejected (p=0.5182, 0.8066, 0.4761, and 0.8509, respectively). Then, the equality of variance matrices of
0
Γ and Γ*0 in (A) and that of Γ1andΓ1* in (B) are tested to find out each of them is not rejected (p=0.3645, p=0.4490, respectively). The results are not against the hypothesis that Weight-Homogeneity holds.
The regression equation for Weight using the six variables on the sample ten years earlier becomes:
1.49 0.013 0.071
0.22 0.0067 0.11
0.00049
Weight Height SBP
ChE UA HDL
RBC
= + × + ×
+ × + × − ×
+ ×
(8)
and SD’s were 0.115 and 0.114, respectively. The results clearly demonstrate the transportability of (7) to the sample ten years earlier.
In this study, we verified the transportability of Weight which is strongly correlated with WC. Since WC is considered to represent the amount of “fat” and Weight is “fat and muscle,” if the relationship between WC and Weight ten years earlier was different from that in the current sample, it should be caused by the change in the amount of muscle. Since the sample consists of 48-75 years old persons, the case seems unlikely. Therefore we assumed that the relationship between WC and Weight has not changed significantly. These considerations lead us to the WC-Homogeneity.
TABLE 2.THE RESULTS OF THE TEST FOR THE WEIGHT-HOMOGENEITY
(A)HENZE-ZIRKLER TEST
sample T n p
Current(x) -0.65 296 0.5182 Ten years previous(x) 0.24 582 0.8066 Current(y, x) 0.71 296 0.4761 Ten years previous(y, x) 0.19 582 0.8509
(B)BARTLETT TEST
sample X2 n1 n2 p
Current(x) Ten years previous(x)
Current(y, x) Ten years previous(y, x)
22.62 296 582 0.3645
28.29 296 582 0.4490
C. Analysis of the Risk of Death using Transported Estimates
The regression equation for WC on the current sample is as follows:
1.60 0.0041 0.035 0.00017 0.63
WC Height SBP Hb
BMI
= + × + × + ×
+ ×
with the coefficient of determination R2=0.81 and SD=0.047.
As presented in Table 3, neither the normality of the test for each of Γ0, Γ*0, and Γ1 (p=0.2418, 0.3467, and 0.2802, respectively) nor the condition (A) of WC-Homogeneity is rejected (p=0.6542).
TABLE 3. RESULTS OF THE TEST FOR THE ASSUMPTIONS OF WC-HOMOGENEITY
(A)HENZE-ZIRKLER TEST
sample T n p
Current(x) 1.17 306 0.2418 Ten years previous(x) 0.94 609 0.3467 Current(y, x) 1.08 306 0.2802 Ten years previous(y, x) - -
-(B)BARTLETT TEST
sample X2 n1 n2 p
Current(x) Ten years previous(x)
Current(y, x) Ten years previous(y, x)
7.74 306 609 0.6542
- - -
-Since the condition (A) is not statistically rejected, we assume it. Thus, it follows from the WC-Homogeneity assumption that the regression equation for WC on the current sample is transportable to the sample ten years earlier. Thus, we obtained a transported estimate of WC for each of 608 examinees in the sample ten years earlier. The mean and SD of the estimates are 4.42 and 0.094, respectively.
They were followed-up until June 2008 and their survival experiences were analyzed in terms of a Cox proportional hazards model as specified in Section IV.
The final results for MS-related causes of death are shown in Table 4 and illustrated in Fig. 1, where ln WC( )*
is ln WC( ) minus 4.49 for stabilization of estimates.
At first, we obtained the following results:
( ) 53.13 11.82 ( )
ln RR = ×SemiMS− ×SemiMS ln WC×
+0.13<Age−60>
Since 53.13 is simply an intercept of the regression line when SemiMS=1 , we modified it to the following expression
(
)
{
}
( ) 11.82 ( ) 4.49
ln RR = − SemiMS× ln WC −
0.13 Age 60 + < − >
Both equations are mathematically equivalent to each other. The results indicate that, for those with Semi-MS, the larger the WC, the smaller the risk of MS-related death.
TABLE 4.MS-RELATED CAUSES OF DEATHS
(NUMBER OF THE ENDPOINTS OBSERVED IS 37)
Estimate SE p <Age - 60> 0.13 0.040 0.001 SemiMS·ln(WC)* -11.82 2.000 <.0001
Fig 1. ln(RR) as a function of ln(WC) obtained from the proportional hazards model with the transported estimate of ln(WC) and Age as
covariates and MS-related causes of deaths as the endpoint.
VI. MODEL FITNESS
We examined the fitness of the proportional hazards model obtained in the previous section as follows.
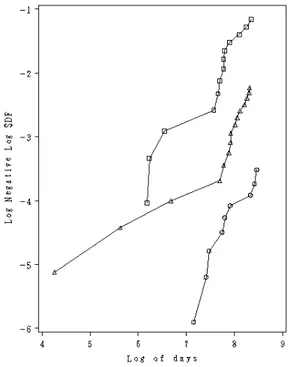
1) The subjects were classified into three groups depending on the estimates of ln(RR) so that the number of endpoints observed are approximately equal among the
ln WC
SemiMS=1
groups. The cutpoints are 0.8 and 1.8 and the sample sizes (the number of endpoints observed) are 382 (9), 168 (15) and 58 (13), respectively.
2) The Kaplan-Meier survival curve S(t) was obtained for each group.
3) Finally log{-logS(t)}, or the log cumulative hazard, at the end of the study period was plotted in Fig.2. Except for the early stage where a small number of deaths were accumulated, the three graphs show relationships approximately parallel to each other, indicating that the proportional hazards model describes the data well.
Fig 2.log-log plot for the three groups classified according to the estimated ln(RR).
VII. DISCUSSION AND CONCLUSION
We formally define the “transportability” introduced by [4] and propose a sufficient condition for it and confirmed the feasibility of the condition with RERF follow-up data for ten years. The RERF sample from A-bomb survivors is somewhat unusual in that the subjects have been covered with free comprehensive health examinations, free medical treatment, and health insurance by the Japanese Government. Those conditions seem to contribute to a high participation rate to the health examinations and keeping their health conditions.
We used the transported estimates of WC as a covariate in the proportional hazards model to study the risk of MS-related death associated with WC. Since the transported estimates are inevitably subject to measurement errors, the estimated regression coefficients may be biased. However, we assume them to be negligible, since [12] reveal that the error is of Berkson-type and [13] indicate that the effects of Berkson-type measurement errors on the estimation of regression coefficients in the proportional hazards model is negligible.
As for the risk of MS-related death for those with Semi-MS, our results indicate that the larger the WC, the smaller the risk. That unexpected result might be due to the
fact that each Semi-MS subject had at least two of these three conditions: dyslipidemia, hypertension, and impaired glucose tolerance; in other words, most of Semi-MS subjects may have been already ill at the time the baseline examinations. This consideration suggests that it is necessary to exclude those who died of any cause within five years after the baseline examinations [14] to unbiasedly estimate the risk of death associated with WC.
The unexpected results also apparently contradict the assumption used in the definition of MS that the larger the
WC, the higher the risk of death. Possible causes of these contradictory findings were either that the definition of MS was not correct or the data used in the analysis were biased. To obtain reliable information to investigate the problem, a larger and longer cohort study should be conducted.
Another possible explanation for the contradictory findings may lie in a similarly observed phenomenon called the “obesity paradox [15].” Obesity is a major factor increasing the risk of all types of heart disease, however once diagnosed with heart disease, obese patients do better, thus improving prognosis. Furthermore, there is solid evidence to suggest that being overweight or obese may improve survival, not just in heart failure, but also in diseases like hypertension, coronary artery disease, and peripheral artery disease [16]. Thus, it will be interesting to examine whether the transported estimates of WC really decrease as MS-related diseases progress in Semi-MS subjects.
Finally, we emphasize that the key factor for a successful application of the definition of transportability and a sufficient condition for it, as discussed in Section II, is the normalization of measurements. To fully exploit the property of the multivariate normality, the definition was confirmed to be proper for dealing with the RERF cohort database that consisted of health examination results. Therefore, it would be interesting to apply the transportability theory to other cohort databases, such as the Framingham study.
ACKNOWLEDGMENT
We thank Dr. Makie and Dr. Nose for helpful comments.
REFERENCES
[1] R. Kahn, J. Buse, E. Ferrannini, M. Stern, “The metabolic syndrome: Time for a critical appraisal - Joint statement from the American Diabetes Association and the European Association for the Study of Diabetes,” Diabetes Care, vol. 28, Sep. 2005, pp. 2289–2304. [2] T. Miyawaki, M. Hirata, K. Moriyama, Y. Sasaki, H. Aono, et al.,
“Metabolic syndrome in Japanese diagnosed with visceral fat measurement by computed tomography,” Proceedings of the Japan Academy Series B: Physical and Biological Sciences, vol. 81, Dec. 2005, pp. 471–479.
[3] G. Federspil, E. Nisoli, and R. Vettor, “A critical reflection on the definition of metabolic syndrome,” Pharmacological Research, vol. 53, Jun. 2006, pp. 449–456.
[4] R. J. Carroll, D. Ruppert, and L. A. Stefanski, Measurement error in nonlinear models. London: Chapman and Hall, 1995.
[5] H. Cramér, The elements of probability theory. New York: Wiley, 1955, ch.10, pp. 145–151.
[6] A. C. Ghani, C. A. Donnelly, D. R. Cox, J. T. Griffin, C. Fraser, et al., “Methods for estimating the case fatality ratio for a novel, emerging infectious disease,” American Journal of Epidemiology, vol. 162, Sep. 2005, pp. 479–786.
development in adolescence,” American Journal of Epidemiology, vol. 144, Jul. 1996, pp. 51–58.
[8] D. A. Pierce, M. Vaeth, J. B. Cologne, “Allowance for random dose estimation errors in atomic bomb survivor studies: A revision,”
Radiation Research, vol. 170, Jul. 2008, pp. 118–126.
[9] J. Marrugat, I. Subirana, E. Comín,C. Cabezas, J. Vila, et al., “Validity of an adaptation of the Framingham cardiovascular risk function: the VERIFICA study,” Journal of Epidemiology and Community Health, vol. 61, Jan. 2007, pp. 40–47.
[10] T. Nakamura, K. Akazawa, K. Kinukawa, Y. Nose, “Piecewise linear Cox model for estimating relative risks adjusting for the heterogeneity of the sample,” Statistics for the Environment, vol.4, New York: Wiley, 1999, ch. 16, pp. 281-289.
[11] G. E. P. Box and D. R. Cox, “An analysis of transformations,” Journal of the Royal Statistical Society.Series B: Statistical Methodology, vol. 26, 1964, pp. 211–252.
[12] S. Ichimaru, N. Ishida, and T. Nakamura, “Food safety in Asia: Study of the metabolic syndrome using waist circumference,” Bulletin of the International Statistical Institute 56th Session, IPM81 - Food Risks. Lisbon, 2007, pp. 1–7.
[13] H. Kuchenhoff, R. Bender, I. Langner, “Effect of Berkson measurement error on parameter estimates in Cox regression models,”
Lifetime Data Analysis, vol. 13, Jun. 2007, pp. 261–272.
[14] A. Hida, M. Akahoshi, K. Toyama,M. Imaizumi, M. Soda, et al., “Do glucose and lipid metabolism affect cancer development in Nagasaki atomic bomb survivors?” Nutrition and Cancer, vol. 52, 2005, pp. 115–120.
[15] T. Tsutamoto, T. Tanaka, H. Sakai,C. Ishikawa, M. Fujii, et al., “Total and high molecular weight adiponectin, haemodynamics, and mortality in patients with chronic heart failure,” European Heart Journal, vol. 28, Jun.2007, pp. 1723–1730.