Submitted3 April 2014 Accepted 6 August 2014 Published16 September 2014
Corresponding author Gonzalo Araujo, g.araujo@lamave.org
Academic editor David Johnston
Additional Information and Declarations can be found on page 15
DOI10.7717/peerj.543
Copyright 2014 Araujo et al.
Distributed under
Creative Commons CC-BY 4.0
OPEN ACCESS
Population structure and residency
patterns of whale sharks,
Rhincodon
typus
, at a provisioning site in Cebu,
Philippines
Gonzalo Araujo1,2, Anna Lucey1, Jessica Labaja1, Catherine Lee So1, Sally Snow1and Alessandro Ponzo1,2
1Large Marine Vertebrates Research Institute Philippines, Jagna, Bohol, Philippines 2Physalus NGO, Large Marine Vertebrates Project Philippines, Largo Callifonte, Rome, Italy
ABSTRACT
This study represents the first description of whale sharks,Rhincodon typus, occur-ring at a provisioning site in Oslob, Cebu, Philippines. Frequent observations of sharks are often difficult, even at tourism sites, giving rise to provisioning activities to attract them. The present study provides repeated longitudinal data at a site where daily provisioning activities took place, and whale sharks were present every day. A total of 158 individual whale sharks were photographically identified between Mar 2012 and Dec 2013, with 129 males (82%), 19 females (12%) and 10 (6%) of undeter-mined sex. Mean estimated total length was 5.5 m (±1.3 m S.D.). Twenty individuals
were measured with laser photogrammetry to validate researchers’ estimated sizes, yielding a good correlation(r2=0.83). Fifty-four (34%) individuals were observed
being hand-fed by local fishermen (provisioned), through in-water behavioural observations. Maximum likelihood methods were used to model mean residency time of 44.9 days (±20.6 days S.E.) for provisionedR. typuscontrasting with 22.4
days (±8.9 days S.E.) for non-provisioned individuals. Propeller scars were observed
in 47% of the animals. A mean of 12.7 (±4.3 S.D.)R. typuswere present in the survey
area daily, with a maximum of 26 individuals (Aug 10 2013) and a minimum of 2 (Dec 6 2012). Twelve (8%) individuals were seen on at least 50% of survey days(n=
621), with a maximum residency of 572 days for one individual (P-396). Twenty four individuals were photographically identified across regional hotsposts, highlighting the species’ migratory nature and distribution. Extended residency and differences in lagged identification rates suggest behavioural modification on provisioned individ-uals, underlying the necessity for proper management of this tourism activity.
Subjects Animal Behavior, Marine Biology, Zoology
Keywords Residency, Lagged identification rate, Whale shark, Population, Oslob, Provisioning, Philippines
INTRODUCTION
the use of provisioning activities to attract them (Gallagher & Hammerschlag, 2011; Ham-merschlag et al., 2012) These are controversial as sharks are apex predators, and some provi-sioned species are potentially dangerous to humans and may impact their ecological func-tion (Brunnschweiler & McKenzie, 2010). In the Red Sea, tagged silky sharks,Carcharhinus falciformis, had modified local habitat use and increased presence on days when baiting occurred (Clarke, Lea & Ormond, 2011). Similarly, studies on sicklefin lemon sharks,
Negaprion acutidens, in French Polynesia, showed an increase in residency and abundance over time, as well as modified intraspecific behaviour resulting from an increase in dom-inance actions and aggression to acquire food (Clua et al., 2010). Though increased resi-dency can have a negative effect on gene flow, and lead to reproductive isolation over time, there is a lack of baseline data at study sites for comparison (Clua et al., 2010). Whitetip reef sharks,Triaenodon obesus, in Australia, showed different daily activity, as measured by vertical movement with temperature-depth-recorder tags, when provisioning took place in the area (Fitzpatrick et al., 2011). In contrast, separate studies on tiger sharks,Galeocerdo cuvier, and Caribbean reef sharks,Carcharhinus perezi, at provisioning sites exhibited no activity space restriction and no significant difference in residency compared with non-provisioned populations, respectively (Maljkovi´c & Cˆot´e, 2011;Hammerschlag et al., 2012). The economic importance of tourism led by provisioning interactions with elasmobranchs is substantial (Clua et al., 2011;Rowat & Engelhardt, 2007;Topelko & Dearden, 2005;
Gallagher & Hammerschlag, 2011). However, to fully grasp the ecological impact of such activities, longitudinal long-term monitoring research is necessary on its adjacent commu-nities and environments, as suggested byBrunnschweiler, Abrantes & Barnett (2014).
The whale shark,Rhincodon typus, is known to inhabit tropical and subtropical waters, and aggregate predictably in several hotspots around the world, which has been primarily linked to high productivity areas (Colman, 1997b;Eckert et al., 2002;Graham & Roberts, 2007;Martin, 2007;Nelson & Eckert, 2007;Rowat et al., 2007;de la Parra Venegas et al., 2011;Rowat & Brooks, 2012;Fox et al., 2013). Their diet consists primarily of surface zooplankton, though recent evidence suggests whale sharks are also feeding on demersal macroplankton and deep-water fishes (Rohner et al., 2013).
The predictability of their occurrence at these hotspots has led to the development of large tourism industries around these aggregations (Davis et al., 1997;Graham, 2007;
Catlin & Jones, 2010;Gallagher & Hammerschlag, 2011). Though many are advertised as ecotours, the widespread use of the term has led to a loss of definition (Honey, 2008). Poor and unregulated whale shark tourism can lead to short and potentially long-term impacts, like behavioural change and displacement from critical habitats (Norman, 2002;
Quiros, 2007;Remolina-Su´arez et al., 2007). Most whale shark aggregations are located in developing or newly industrialised countries, making the management of this resource a greater challenge (Rowat & Brooks, 2012).
can be studied (Arzoumanian, Holmberg & Norman, 2005;Brooks et al., 2010). The citizen science contributing to ‘Wildbook for Whale Sharks’ (www.whaleshark.org) can help match individualR. typusbetween areas by allowing members of the public to submit photographs of the animals and encounter details. Opportunistic Photo-ID of individual
R. typuscan work as photographic mark-recapture data against modified maximum likelihood models to understand their residency and movement patterns (Whitehead, 2001;Wimmer & Whitehead, 2005;Fox et al., 2013).
Whale sharks inhabit the seas around the Philippine archipelago, with the most famous aggregation occurring in the waters of Donsol, Sorsogon Province (Eckert et al., 2002;
Quiros, 2005;Pine, Alava & Yaptinchay, 2007;Quiros, 2007). When the aggregation was first identified in 1997, it attracted tourists and hunters alike, leading to the fishing of sevenR. typus, followed by public outcry and campaigning across the country to protect the species. This successfully resulted in the passing of a national law protecting the whale shark from consumptive use and exploitation (FAO 193, Department of Agriculture, Quezon City, Philippines, March 25th 1998). Supported by WWF-Philippines, the fishing town of Donsol developed into the first whale shark tourism destination in the country (Quiros, 2005;Pine, Alava & Yaptinchay, 2007). The only other known aggregation of
R. typusin the Philippines, was identified byO’Farrell et al. (2006)offPanaon Island, Southern Leyte. This was further described byQuiros et al. (2007), where a total of 62 encounters with 28 individual whale sharks were recorded over seven days.
In the Municipality of Oslob, located on the south of Cebu Island in the Central Visayas region of the Philippines, whale shark hunting was never confirmed (Alava et al., 2002). However, in nearby areas of the Bohol Sea, nearly 700R. typuswere landed at two monitoring sites, between 1993 and 1997 (Alava et al., 2002). The present study is the only detailed description of whale sharks presence in the Municipality of Oslob and examines the population structure and residency patterns of individuals identified at this provisioning site. Data from daily photographic identification was used to compare against residency models, using maximum likelihood methods (Whitehead, 2001). These methods were previously applied on other whale shark aggregations (Ram´ırez-Mac´ıas et al., 2012;Ram´ırez-Mac´ıas, V´azquez-Haikin & V´azquez-Ju´arez, 2012;Fox et al., 2013) as they use identification data to establish the spatial and temporal distribution of effort (Whitehead, 2001).
MATERIALS & METHODS
All the methods here presented were conducted in accordance with national and local laws in respect of animal welfare. The Bureau of Fisheries and Aquatic Resources—Region 7, issued the authors a Gratuitous Permit, and a Memorandum of Agreement was signed with the Department of Environment and Natural Resources and DA-BFAR7. The Municipality of Oslob granted the authors a Prior Informed Consent document.
Study site
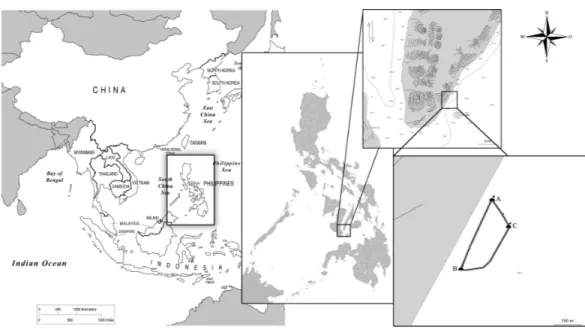
Figure 1 Map of the study site and interaction area demarked by buoys (A, B, C) in Barangay Tan-Awan, Municipality of Oslob, Cebu Province, Philippines.
allowed. Fifty to 100 m offshore within the interaction area, feeders belonging to the TOSWFA people’s organisation are allowed by the municipal government to provision
R. typusfrom one-man paddleboats. Provisioning takes place between 6 am and 1 pm, with 50–150 kg of food utilized for the provisioning daily, depending on the number of sharks and tourists present. The interaction area is semi circular, measuring 480 m from buoy “A” (N9 27 48.6 E123 22 48.4) to buoy “B” (N9 27 34.1 E123 22 43.0), and 170 m at its widest point to buoy “C” (N9 27 42.7 E123 22 52.7), for a total surface area of 65,457 m2(Fig. 1). Researchers snorkelled out from shore and surveyed the area for presence of whale sharks. All recorded encounters withR. typusoccurred within the demarked area. Systematic data collection described in this study took place between March 31st 2012 and December 31st 2013.
Photographic identification
Photo-identification was conducted three times a day, between 7–8 am, 9–10 am and 11–12 pm. These three daily sessions were carried out through the whole study period, conditions and weather permitting. Photo-ID was used to describe the population as a non-invasive means to gather size, sex, and presence information of the animals. Over 350,000 photographs were taken and analysed for the present study. Upon sight of an
taken to capture any scars, abrasions, lacerations and any body truncations. Observations on the feeding behaviour were also noted on individuals. Though the whole population is possibly provisioned, as attracted to the study site by the presence of food (Orams, 2002), for the purpose of this studyR. typuswere considered “provisioned” when they were directly observed being hand-fed from a feeder boat. Caution should be taken as these direct observations on individuals cannot cover the whole of the animal’s time at the study site, and it is therefore possible that some non-provisioned individuals did indeed feed from feeder boats. Differences in size, sex, scarring, and presence were investigated amongst the two groups. The size of whale sharks was estimated by photographing the animal next to snorkelers or boats of known size. Pearson’s chi-squared test was applied to evaluate any bias amongst sex-identifiedR. typusfrom an assumed 1:1 female to male ratio (Joung et al., 1996). Wilcoxon–Mann–Whitney (WMW) tests were run amongst results to test for significance (Fay & Proschan, 2010). Statistical significance was tested atP=0.05.
Linear regression models were used to test relationship between variables. All statistical analyses were run on R version 3.0.1 (http://www.R-project.org).
The photographer visually identified each photographed individual. Two experienced researchers gave further validation to the identity of the individual before being inputted into a local I3S catalogue (http://www.reijns.com/i3s) (Van Tienhoven et al., 2007). Sex, estimated size and presence or absence of scars was also noted and inputted into the database. New, previously unidentified individuals were also uploaded to the online whale shark database “Wildbook for Whale Sharks” atwww.whaleshark.org. The daily presence of everyR. typuswas recorded on a spreadsheet. Celestial information, defined by moon irradiance (www.timeanddate.com; accessed on January 4th 2014), was investigated through linear regression as a possible variable affecting variation in daily presence of
R. typusindividuals in the study area (Graham, Roberts & Smart, 2006).
Photogrammetry
Size ofR. typuswas estimated by photographing the animals next to snorkelers and/or boats of known size parallel to the animals. Additionally, laser photogrammetry was used to validate researchers’ estimated total lengths. Parallel green lasers (Sea Turtle Scuba Inc.;
http://www.seaturtlescuba.us/) were placed on individual arms at the extremities of a custom-made frame 30 cm apart, with an underwater camera placed in the centre of the two. Parallel alignment of the lasers was verified before and after each in-water session by measuring the distance between the two projected laser dots on a parallel surface placed at 1 and 5 m away. During each dedicated 30-min measuring session, or otherwise limited by battery life, the researcher swam in the interaction area measuring free-swimmingR. typus. Only pictures taken perpendicularly to the animal (90◦
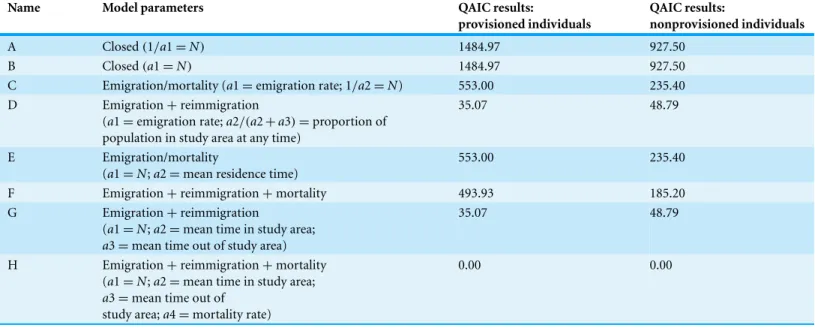
Table 1 Model parameters and comparison for lagged identification rate ofR. typusat Oslob.Parameters as preset by Whitehead (2009)in SOCPROG 2.4. These parameters test from closed population models (A & B) to various combinations of emigration, reimmigration and mortality (C–H). The values displayed show the difference between the QAIC (quasi-Akaike information criterion) results obtained for each model and the smallest QAIC result.
Name Model parameters QAIC results:
provisioned individuals
QAIC results:
nonprovisioned individuals
A Closed(1/a1=N) 1484.97 927.50
B Closed(a1=N) 1484.97 927.50
C Emigration/mortality (a1=emigration rate; 1/a2=N) 553.00 235.40 D Emigration+reimmigration
(a1=emigration rate;a2/(a2+a3)=proportion of
population in study area at any time)
35.07 48.79
E Emigration/mortality
(a1=N;a2=mean residence time)
553.00 235.40
F Emigration+reimmigration+mortality 493.93 185.20
G Emigration+reimmigration
(a1=N;a2=mean time in study area;
a3=mean time out of study area)
35.07 48.79
H Emigration+reimmigration+mortality (a1=N;a2=mean time in study area; a3=mean time out of
study area;a4=mortality rate)
0.00 0.00
Notes.
WhereNis the population size in the study area; QAIC, quasi-Akaike information criterion.
the total length of animal, measured from free-swimming and stranded animals, found to bey=4.8373x+80.994 (r2=0.93). A total of 190 photograph measurements were used
for analysis on 20 individuals and fitted to the abovementioned equation.
Residency and lagged identification rate
Maximum likelihood methods were used to model and estimate overall residency time of
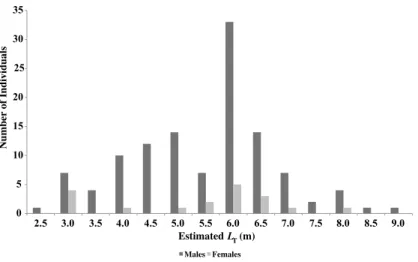
Figure 2 Sex and size distribution ofR. typusidentified in Oslob.
feeding from feeder boats (n=104), defined as non-provisioned. This was inputted
as supplemental data into SOCPROG. Both datasets were run as described above, and results were found to better represent the data. The best-fit model (Model H,Table 1) for both provisioned and non-provisioned sharks, respectively, were bootstrapped for 100 repetitions, to estimate standard errors and provide 95% confidence intervals (Buckland & Garthwaite, 1991).
RESULTS
Population structure
In 621 days of survey, during the 641 days included in the study period, 158 individual
R. typuswere identified. Sex was identified for 148 animals (94%), of which 129 were male (82%) and 19 were female (12%), highlighting a significantly male biased population (χ2=45.7,P=1.37e−11). The estimated total length (LT)of the males (n=118) had
a mean value of 5.5 m (±1.3 m S.D.), whereas the females (n=19) had a mean value of
5.4 m (±1.5 m S.D.) showing no significance in size distribution (WMW,P=0.8722).
Of the 129 males identified, 19 (14%) of them had claspers extending over the pelvic fins, with a mean estimatedLTof 6.9 m (±1.1 m S.D.,n=18), considerably larger than the
overall male mean estimatedLT(WMW,P=7.99e−05). Only four males were considered
to be sexually mature based on the calcified appearance of the claspers and a meanLT
over 8 m (Colman, 1997a). It was not possible to determine maturity of females and none were visibly pregnant. The mean size of the population was 5.5 m (±1.3 m S.D.,n=141),
ranging from 2.5 m to 9 m (Fig. 2).
A total of 190 pictures were selected for photogrammetry measurement based on photograph quality. Twenty individual sharks were measured between the 5th gill slit and the start of the dorsal fin(BP1), yielding a mean total length based onBP1measurements
of 5.6 m (±0.7 m S.D.). The researchers’ visually estimatedLTfor these 20 individuals
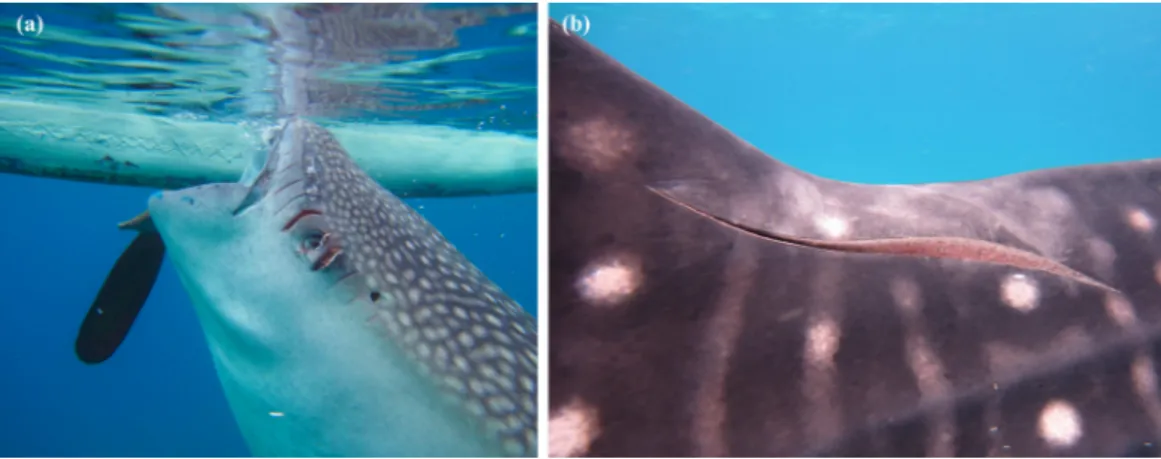
Figure 3 Examples of scars observed onR. typusfrom collision with small (A) and large (B) propellers.
P=0.4885). Linear regression of the researchers’ estimatedLTand the results from the BP1LT, yielded a significant relationship (r2=0.83,P=2.57e−08).
Propeller scars were observed in 47% of the whale sharks (n=158) probably derived
from small outrigger boats with propeller diameter between 5 and 20 cm, or from larger commercial-vessel collisions (21–50 cm) (seeFig. 3). Scars were also used to aid individual identification.
Presence
Throughout the 621 surveyed days, a mean of 12.7 (±4.3 S.D.) individual whale sharks
were seen in the survey area daily, with a maximum presence of 26 individuals (Aug 10 2013). A minimum presence of 2 individuals was recorded on Dec 6 2012, the first day of survey after Typhoon Pablo (International code name “Bopha”) made landfall in Southern Cebu on the Dec 4 2012. Given the length of the study period, the number of new individuals present in the interaction area was analysed by month. Monthly variations in the number of individual whale sharks present on at least one day during each month appear to suggest some seasonality (Fig. 4). During the first month of the study (Apr 2012) 18 individuals were present in the interaction area. Forty-six individualR. typuswere identified throughout the months of June 2012 and May 2013. The maximum number ofR. typusidentified in the study area was seen throughout October 2013, totalling 47 animals. In Contrast, a minimum of 15 individuals were present during February 2013. Linear regression analysis of moon irradiance (%) posed no significant difference on the daily presence ofR. typusindividuals in the study area (r2=0.0015;P=0.33).
Of the 158 individuals identified, 29% (45) were seen once, whereas 71% (113) were resighted (>1 day) in the interaction area. The mean presence of individuals in the interaction area was 49.9 days (±118.7 days S.D.). Twenty-three (14.6%n=158)
individuals were present for longer than the mean residency, and 12 individuals (7.6%
n=158) were identified in the interaction area at least 50% of survey days (n=621).
Figure 4 Presence ofR. typusin Oslob between Mar 2012 and Dec 2013.Bars indicate the number of individualR. typuspresent daily in the interaction area. The line shows the number of individuals identified throughout each month of study.
Figure 5 Histogram depicting the presence of each individualR. typusat the study site for the dura-tion of the study(n=621).
also suggests seasonality as to when new individuals were identified in the study area, as indicated by a steeper climb during peak season (May–Jun,Fig. 6).
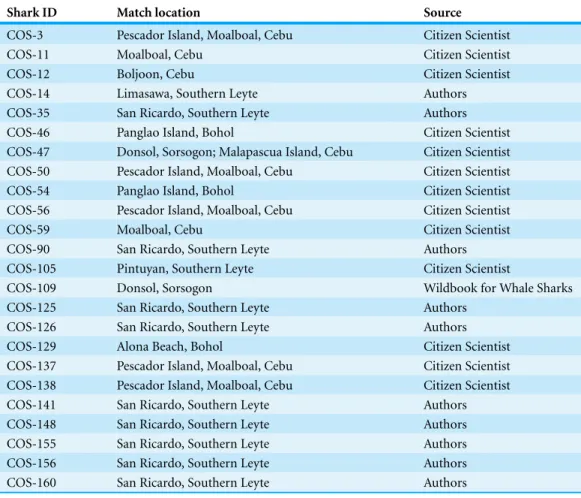
Through the use ofR. typusunique spot pattern, “Wildbook for Whale Sharks” library, and the use of citizen scientists contributing to it, 11 individuals were matched in Southern Leyte, a province located 200 km East across the Bohol Sea. Using the same methods, two individuals were matched to pictures taken in Donsol (∼380 km North East), and another
11 individuals were matched in other regional diving tourism destinations including Malapascua Island (∼220 km North), Panglao Island (∼40 km East), and Moalboal
(∼55 km North West). One individual was matched at both Malapascua Island and
Figure 6 Discovery curve for newly identifiedR. typusin the interaction area for the duration of the study period.
Table 2 Summary table ofR. typusmatched across regional hotspots in the Philippines.
Shark ID Match location Source
COS-3 Pescador Island, Moalboal, Cebu Citizen Scientist
COS-11 Moalboal, Cebu Citizen Scientist
COS-12 Boljoon, Cebu Citizen Scientist
COS-14 Limasawa, Southern Leyte Authors
COS-35 San Ricardo, Southern Leyte Authors COS-46 Panglao Island, Bohol Citizen Scientist COS-47 Donsol, Sorsogon; Malapascua Island, Cebu Citizen Scientist COS-50 Pescador Island, Moalboal, Cebu Citizen Scientist COS-54 Panglao Island, Bohol Citizen Scientist COS-56 Pescador Island, Moalboal, Cebu Citizen Scientist
COS-59 Moalboal, Cebu Citizen Scientist
COS-90 San Ricardo, Southern Leyte Authors COS-105 Pintuyan, Southern Leyte Citizen Scientist
COS-109 Donsol, Sorsogon Wildbook for Whale Sharks
COS-125 San Ricardo, Southern Leyte Authors COS-126 San Ricardo, Southern Leyte Authors
COS-129 Alona Beach, Bohol Citizen Scientist
COS-137 Pescador Island, Moalboal, Cebu Citizen Scientist COS-138 Pescador Island, Moalboal, Cebu Citizen Scientist COS-141 San Ricardo, Southern Leyte Authors COS-148 San Ricardo, Southern Leyte Authors COS-155 San Ricardo, Southern Leyte Authors COS-156 San Ricardo, Southern Leyte Authors COS-160 San Ricardo, Southern Leyte Authors
Notes.
Provisioned and non-provisioned individuals
Provisioned individuals(n=54)had a mean±S.D. estimatedLTof 5.1 m (±1.3 m).
Size was estimated for 87(n=104)non-provisioned whale sharks with a mean±S.D.
estimatedLT 5.7 m (±1.3 m), showing a significant difference in size between the two
groups (WMW,P=0.0163). Provisioned whale sharks were seen between 2 and 572 days
(n=621) inside the interaction area (mean 135.6±173.7 days S.D.), contrasting with
non-provisioned individuals who were seen present between 1 and 63 non-consecutive days (mean 5.4±9.1 days S.D.) (WMW,P=2.2e−16). Moon irradiance had no
signifi-cance on the presence of provisioned or non-provisioned individuals at the study site as explained by linear regression (r2=0.0006,P=0.54;r2=0.0033,P=0.15 respectively).
Sex was determined for provisioned individuals with 49 males (91%,n=54) and 5 females
(9%,n=54), and for non-provisioned individuals with 80 males (77%,n=104), 14
females (13%,n=104) and 10 of undetermined sex (10%,n=104). Both groups were
significantly male biased (χ2=19.6,P=9.63e−06, andχ2=24.8,P=6.20e−07,
respectively). Propeller scars were observed on 51% of provisioned individuals, and on 44% of non-provisioned individuals, showing no significance (χ2=0.13,P=0.72)
relative to the overall population scarring (47%).
Residency and lagged identification rate
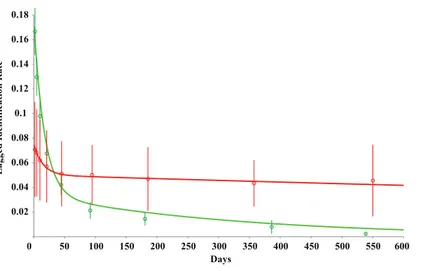
The LIR and residency models showed that provisionedR. typushad a mean residency of 44.9±20.6 S.E. (95% CI [38.5–113.4]) days, contrasting with a mean of 22.4±8.9
S.E. (95% CI [6.0–36.2]) days on non-provisioned individuals. The mean time spent outside the study area was 22.6±12.4 S.E. (95% CI [0.0–45.2]) days for provisioned
individuals, and 94.7±133.6 S.E. (95% CI [14.6–447.5]) days for non-provisioned
individuals. The mean permanent emigration and mortality rate, where the animal is considered to have left the population, was modelled at 0.00031±0.00022 S.E. (95% CI
[−0.000084–0.000823]), and 0.003023±0.001103 S.E. (95% CI [0.001437–0.006185]) for
provisioned and non-provisioned whale sharks respectively.
The LIR was modelled for both datasets. The LIR for non-provisioned individuals showed a fast decrease from 1 to mean 93.3 days, after which the probability of resighting an individual decreased and stayed above zero for the remainder of the study (Fig. 7). Interestingly, there is a slight increased LIR at mean 379.2 days, potentially highlighting yearly seasonality. In contrast, LIR for provisioned individuals also showed a steep decrease from 1 to mean 94.9 days, however, the decrease in LIR over time was steady with only a 9.7% decrease from mean 47.4 to 554.7 days (Fig. 7). The LIR after 600 days of study period was 0.041707 and 0.005578 for provisioned and non-provisioned animals respectively, highlighting an almost 10-fold probability of resighting a provisioned whale shark than a non-provisioned one.
DISCUSSION
Figure 7 Lagged identification rate (LIR) for provisioned (red) and non-provisioned (green)R. typus at Oslob over increasing time periods.Modelled from fitted emigration+reimmigration+mortality rate (mean±S.E.) (seeTable 1).
total of 158 individuals were identified, of which 82% were male, following the population structure of most sites across the globe, which is primarily juvenile male biased (Rowat & Brooks, 2012). The size of individuals ranged from 2.5 to 9.0 mLT, with only four males
appearing to be sexually mature. The maturity of females was impossible to determine, though it has been suggested that it occurs>9.0 m, larger than the biggest female identified in Oslob (8.0 m) (Rowat & Brooks, 2012). The mean size of the animals (5.5 m) was similar to that of previously described aggregations from Ningaloo Reef, Baja California and the Maldives (Nelson & Eckert, 2007;Bradshaw et al., 2008;Riley et al., 2010), and slightly smaller than that described at Honduras, Gulf of Mexico, Qatar and the Seychelles (Graham & Roberts, 2007;de la Parra Venegas et al., 2011;Rowat et al., 2011;Robinson et al., 2013;Fox et al., 2013). While there were no individuals<2.0 mLTidentified, threeR. typus <2.0 mLTwere previously reported (46 cm, 64 cm & 140 cm respectively) in Sorsogon
Province near Donsol byAca & Schmidt (2011), two of which were neonates, as they were smaller than the largest foetus described byJoung et al. (1996). The relative proximity of Oslob to this possible pupping ground and the connectivity established through photo-ID (Table 2) is a reminder of the importance of the area for the ecology ofR. typus. This is however contrasted with the scarcity of sexually mature individuals, with only four males identified throughout the study, the largest of which was 9.0 mLT.
The use of photogrammetry as a non-invasive means to measureR. typus, and validate researchers’ estimated lengths, is an excellent approach. The results obtained for 20
R. typus, were only 0.2 m (±0.7 m) offthose visually estimated lengths, indicating that
researchers’ estimates are a good approximation of the real sizes. The relationship found was less significant (r2 =0.83) than that obtained byRohner et al. (2011), and can be
Propeller scars were observed in 47% of individuals. The fact thatR. typusspends a significant amount of time at or near the surface makes it more vulnerable to vessel collision (Norman, 2002;Graham, Roberts & Smart, 2006;Rowat & Gore, 2007;Speed et al., 2008;Brunnschweiler et al., 2009;Brunnschweiler & Sims, 2011). In the Central Visayas region, where the study was conducted, small coastal villages use small motorized vessels with 5–20 cm diameter propellers to fish in near-shore waters, areas whereR. typusis likely to visit for foraging. The percentage of individuals with propeller cuts within the Oslob population was higher than that recorded in Isla Holbox, Mexico (25%) (Ram´ırez-Mac´ıas et al., 2012). However, findings bySpeed et al. (2008)did note that scarred individuals returned to the same aggregation, suggesting that propeller cuts do not necessarily impact habitat use. This was further supported by our observations in which individuals with fresh propeller cuts would return to the interaction area repeatedly. Given the high occurrence of propeller scars, propeller guards were highly recommended for operators visiting the study area, unfortunately none have been implemented yet.
Twenty-four individuals (15%,n=158) were matched through Photo-ID and the use
of their unique spot patterns, in other national hotspots, highlightingR. typusmigratory nature as previously reported from both telemetry and Photo-ID studies (Eckert & Stewart, 2001;Eckert et al., 2002;Wilson et al., 2006;Graham & Roberts, 2007;Brunnschweiler et al., 2009;Brunnschweiler & Sims, 2011;McKinney et al., 2013). It also underlines the species’ large range, and the potential risk that the behavioural change induced by the provisioning poses to such migratory nature. To date, 650 individuals have been identified on “Wildbook for Whale Sharks” in the Philippines, meaning that Oslob potentially hosts 24% of the country’s population ofR. typus.
The results of the present study show a significant difference in residency patterns between provisioned and non-provisioned individuals suggesting behavioural modifica-tion. This aggregation site is different to any other whale shark site previously identified and described because of the nature of the interaction, where the animals are attracted to the area with food. While a scientific description of provisioningR. typushas been lacking, a similar conditioning has been happening in Teluk Cenderawasih National Park, West Papua, Indonesia, but no data are yet available for comparison (Tania et al., 2013). Provisioning is more commonly used to attract apex predators where their presence is otherwise unreliable and unpredictable. Contrastingly, whale shark tourism interactions are based on their natural and reliable seasonal appearances at feeding sites (Rowat & Brooks, 2012).
The analyses showed no significant difference in sex and presence of propeller scars, between provisioned and non-provisioned individuals, however there was a significant significance in their residency times (WMW,P=2.2e−16). Fifty-four individuals were
recorded doing so, 12 of which were present in the study area over 50% of survey days (n=621). Site fidelity of this magnitude has never been described inR. typus, where
(92% of surveyed days). Provisioned individuals (5.1±1.3 m) were significantly smaller
than non-provisioned individuals (5.7±1.3 m), but could arguably be attributed to the
smaller sample size.Figure 4depicts the number of individuals present daily, and monthly, highlighting an increase of daily individuals over time (r2=0.29,P<0.05). This could
be recruitment of new non-provisioned individuals that learn how to feed from the feeder boats or individuals attracted to the site by the food pulse. Non-provisioned individuals were observed swimming slowly and showing curiosity, approaching snorkelers and boats alike, possibly attracted by the large amount of food dispersed in the water during the provisioning activities. Forty-five individuals were only seen once (28%,n=158),
indicating that the species probably migrate through the area.
The residency ofR. typuswas modelled to understand their presence in Oslob and con-trast to other areas. This model described the provisioned individuals to have a residency time twice as long (44.9±20.6 S.E. days) as non-provisioned ones (22.4±8.9 S.E. days).
With a dataset spanning through 10 years,Fox et al. (2013)modelled a mean residency of 11.76±4.54 days at Utila, and through mark-recapture modelling, residency by R. typusat Ningaloo Reef was estimated at 33 days (Holmberg, Norman & Arzoumanian, 2009). The latter is higher than non-provisioned individuals in Oslob, though this can be attributed to the fact that this study was conducted inside a small interaction area, whereas at Ningaloo animals are sighted throughout a much larger area. Unfortunately few data are available for comparison using the same methods used in this study on estimating residency. Similarly, the LIR results show that after 621 days the probability of resighting a non-provisioned individual is only 13% of that of a provisioned individual. Results using the same statistical approach, fromRam´ırez-Mac´ıas, V´azquez-Haikin & V´azquez-Ju´arez (2012), showed a decline in LIR between 3–30 days at one location, and 3–60 days at their second study site, the latter suggesting slightly longer residency time. In Honduras, the LIR also declined sharply after 16–31 days (Fox et al., 2013). The results from these sites are similar to those found here, though the LIR of provisioned individuals stayed at a relatively high level over the duration of the study period. The mortality rate and permanent emigration modelled for non-provisioned individuals was also∼10-fold that
of provisioned individuals, suggesting they are much likelier to leave the study area. These differences in both residency and probability of being resighted at one particular site over time suggest behavioural modification induced by the provisioning activities.
CONCLUSION
provisioned animals beyond the scope of this study. Approximately 34% of the population was categorised as being provisioned, and are therefore potentially affected by this human interference with their natural ecology. Further work will focus on the dietary differences in provisioned and non-provisioned individuals, as well as other behavioural changes not directly observed or measured through residency, preferably through the use of telemetry technology. The environmental impact of the provisioning activities on the local ecosystems beyond the species under direct study will also be explored. This coupled with the socio-economical aspects of the provisioning activities will be pursued to delineate the limits of acceptable change and suggest a management plan to the Philippine National Government.
ACKNOWLEDGEMENTS
The work here presented wouldn’t have been possible without the help of the Large Marine Vertebrates-Philippines volunteers (http://www.lamave.org), the Municipality of Oslob, TOWSFA People’s Organisation, The Department of Environment and Natural Resources-Region 7, The Department of Agriculture—Bureau of Fisheries and Aquatic Resources-Region 7, Ocean Park Conservation Foundation Hong Kong, M5 SRL-Roma, Elson Aca from Balyena.org, Chris Rohner for scientific support from Marine Megafauna Foundation, and Ecocean/Wildbook for Whale Sharks (http://www.whaleshark.org) for allowing us the use of the library, and help us understand the movements of the world’s largest fish in our study area. We would also like to thank Dr Simon Pierce, Mr Zachary Siders and a third anonymous reviewer in developing a better manuscript.
ADDITIONAL INFORMATION AND DECLARATIONS
Funding
Funding was awarded by the Ocean Park Conservation Foundation—Hong Kong (FH01 1213). M5-SRL Roma also provided funding for completion of this study. The funders had no role in study design, data collection and analysis, decision to publish, or preparation of the manuscript.
Grant Disclosures
The following grant information was disclosed by the authors: Ocean Park Conservation Foundation—Hong Kong: FH01 1213. M5-SRL Roma.
Competing Interests
Gonzalo Araujo, Anna Lucey, Jessica Labaja, Catherine Lee So, Sally Snow,
Alessandro Ponzo are all affiliated with the Large Marine Vertebrates Research Institute Philippines.
Author Contributions
• Gonzalo Araujo, Anna Lucey, Jessica Labaja, Catherine Lee So, Sally Snow and
analyzed the data, contributed reagents/materials/analysis tools, wrote the paper, prepared figures and/or tables, reviewed drafts of the paper.
Animal Ethics
The following information was supplied relating to ethical approvals (i.e., approving body and any reference numbers):
The Whale Shark is under the jurisdiction of The Department of Agriculture-Bureau of Fisheries and Aquatic Resources. A Memorandum of Agreement was signed between Physalus NGO and the aforementioned body, and the Department of Environment and Natural Resources-Biodiversity Management Bureau-Region 7.
A Gratuitous Permit (GP-01-2013) for Scientific Research was granted by DA-BFAR-R7. A Prior Informed Consent was granted by the Local Community, represented by the Mayor Guaren of Oslob.
REFERENCES
Aca EQ, Schmidt JV. 2011.Revised size limit for viability in the wild: neonatal and young of the year whale sharks identified in the Philippines.Asia Life Sciences20:361–367.
Alava MNR, Dolumbalo ERZ, Yaptinchay AA, Trono RB. 2002.Fishery and trade of whale sharks and manta rays in the Bohol Sea, Philippines. In: Fowler SL, Reed TM, Dipper FA, eds.
Elasmobranch biodiversity, conservation and management. Sabah: IUCN, 260.
Arzoumanian Z, Holmberg J, Norman B. 2005.An astronomical pattern-matching algorithm for computer-aided identification of whale sharksRhincodon typus.Journal of Applied Ecology 42:999–1011DOI 10.1111/j.1365-2664.2005.01117.x.
Bradshaw CJA, Fitzpatrick BM, Steinberge CC, Brook BB, Meekan MG. 2008.Decline in whale shark size and abundance at Ningaloo Reef over the past decade: the world’s largest fish is getting smaller.Biological Conservation141:1894–1905DOI 10.1016/j.biocon.2008.05.007. Brooks KS, Rowat D, Pierce SJ, Jouannet D, Vely M. 2010.Seeing spots: photo identification as
a regional tool for whale shark identification.Western Indian Ocean Journal of Marine Science 9:19–28.
Brunnschweiler JM, Abrantes KG, Barnett A. 2014.Long-term changes in species composition and relative abundances of sharks at a provisioning site.PLoS ONE 9(1):e86682
DOI 10.1371/journal.pone.0086682.
Brunnschweiler JM, Baensch H, Pierce SJ, Sims DW. 2009.Deep-diving behaviour of a whale sharkRhincodon typusduring long-distance movement in the western Indian Ocean.Journal of Fish Biology74:706–714DOI 10.1111/j.1095-8649.2008.02155.x.
Brunnschweiler JM, McKenzie J. 2010.Baiting sharks for marine tourism: comment on Clua et al. (2010).Marine Ecology-Progress Series420:283–284DOI 10.3354/meps08877.
Brunnschweiler JM, Sims DW. 2011.Diel oscillations in whale shark vertical movements associated with meso- and bathypelagic diving.American Fisheries Society Symposium76:1–14. Buckland ST, Garthwaite PH. 1991.Quantifying precision of mark-recapture estimates using the
bootstrap and related methods.Biometrics47:255–268DOI 10.2307/2532510.
Clarke C, Lea JSE, Ormond RFG. 2011.Reef-use and residency patterns of a baited population of silky sharks,Carcharhinus falciformis, in the Red Sea.Marine and Freshwater Research 62:668–675DOI 10.1071/MF10171.
Clua E, Buray N, Legendre P, Mourier J, Planes S. 2010.Behavioural response of sicklefin lemon sharksNegaprion acutidensto underwater feeding for ecotourism purposes.Marine Ecology Progress Series414:257–266DOI 10.3354/meps08746.
Clua E, Buray N, Legendre P, Mourier J, Planes S. 2011.Business partner or simple catch? The economic value of the sicklefin lemon shark in French Polynesia.Marine and Freshwater Research62:764–770DOI 10.1071/MF10163.
Colman JG. 1997a.A review of the biology and ecology of the whale shark.Journal of Fish Biology 51:1219–1234DOI 10.1111/j.1095-8649.1997.tb01138.x.
Colman JG. 1997b.Whale shark interaction management, with particular reference to ningaloo marine park 1997–2007,Western Australian wildlife management program no. 27.Perth: Department of Conservation and Land Management.
Davis D, Banks S, Birtles A, Valentine P, Cuthill M. 1997.Whale sharks in Ningaloo Marine Park: managing tourism in an Australian marine protected area.Tourism Management18:259–271
DOI 10.1016/S0261-5177(97)00015-0.
de la Parra Venegas R, Hueter R, Gonz`alez Cano J, Tyminski J, Gregorio Remolina J, Maslanka M, Ormos A, Weigt L, Carlson B, Dove A. 2011.An unprecedented aggregation of whale sharks,Rhincodon typus, in Mexican coastal waters of the Caribbean Sea.PLoS ONE 6(4):e18994DOI 10.1371/journal.pone.0018994.
Dobson J. 2006.Sharks, wildlife tourism, and state regulation.Tourism in Marine Environments 3:15–23DOI 10.3727/154427306779380275.
Eckert S, Dolar L, Kooyman G, Perin W, Rahman A. 2002. Movements of whale sharks, (Rhincodon typus), in South East Asian waters as determined by satellite telemetry.Journal of Zoology257:111–115DOI 10.1017/S0952836902000705.
Eckert S, Stewart B. 2001.Telemetry and satellite tracking of whale sharks,Rhincodon typus, in the Sea of Cortez, Mexico, and north Pacific Ocean.Environmental Biology of Fishes60:299–308
DOI 10.1023/A:1007674716437.
Fay MP, Proschan MA. 2010.Wilcoxon–Mann–Whitney ort-test? On assumptions for hypothesis tests and multiple interpretations of decision rules.Statistics Surveys4:1–39
DOI 10.1214/09-SS051.
Fitzpatrick R, Abrantes KG, Seymour J, Barnett A. 2011.Variation in depth of whitetip reef sharks: does provisioning ecotourism change their behaviour?Coral Reefs30:569–577
DOI 10.1007/s00338-011-0769-8.
Fox S, Foisy I, de la Parra Venegas R, Galv´an Pastoriza BE, Graham RT, Hoffmayer ER, Holmberg J, Pierce SJ. 2013.Population structure and residency of whale sharks
Rhincodon typusat Utila, Bay Islands, Honduras. Journal of Fish Biology83:574–587
DOI 10.1111/jfb.12195.
Gallagher AJ, Hammerschlag N. 2011.Global shark currency: the distribution, frequency, and economic value of shark ecotourism. Current Issues in Tourism 14:797–812
DOI 10.1080/13683500.2011.585227.
Graham R, Roberts CM. 2007.Assessing the size, growth rate and structure of a seasonal population of whale sharks (Rhincodon typus, Smith 1828) using conventional tagging and photo identification.Fisheries Research84:71–80DOI 10.1016/j.fishres.2006.11.026. Graham RT, Roberts CM, Smart JCR. 2006.Diving behaviour of whale sharks in relation to a
predictable food pulse.Journal of the Royal Society Interface3(6):119–116
DOI 10.1098/rsif.2005.0082.
Hammerschlag N, Gallagher AJ, Lazarre DM. 2011.A review of shark satellite tagging studies.
Journal of Experimental Marine Biology and Ecology398:1–8DOI 10.1016/j.jembe.2010.12.012. Hammerschlag N, Gallagher AJ, Wester J, Luo J, Ault JS. 2012.Don’t bite the hand that feeds:
assessing ecological impacts of provisioning ecotourism on an apex marine predator.Functional Ecology26:567–576DOI 10.1111/j.1365-2435.2012.01973.x.
Holmberg J, Norman B, Arzoumanian Z. 2009.Estimating population size, structure, and residency time for whale sharksRhincodon typusthrough collaborative photo-identification.
Endangered Species Research7:39–53DOI 10.3354/esr00186.
Honey M. 2008.Ecotourism and sustainable development. Who owns paradise?Second edition. Island Press.
Joung SJ, Chen CT, Clark E, Uchida S, Huang WYP. 1996.The whale shark,Rhincodon typus, is a live-bearer: 300 embryos found in one ‘megamamma’ supreme.Environmental Biology of Fishes 46:219–223DOI 10.1007/BF00004997.
Maljkovi´c A, Cˆot´e IM. 2011.Effects of tourism-related provisioning on the trophic signatures and movement patterns of an apex predator the Caribbean reef shark.Biological Conservation 144:859–865DOI 10.1016/j.biocon.2010.11.019.
Marshall AD, Pierce SJ. 2012.The use and abuse of photographic identification in sharks and rays.
Journal of Fish Biology80:1361–1379DOI 10.1111/j.1095-8649.2012.03244.x.
Martin RA. 2007.A review of behavioural ecology of whale sharks (Rhincodon typus).Fisheries Research84:10–16DOI 10.1016/j.fishres.2006.11.010.
McKinney J, Hoffmayer ER, Holmberg J, Graham R, de la Parra R, Galv ´n Pastoriza B, Fox S, Pierce S, Dove ADM. 2013.Regional connectivity of whale sharks demonstrated using photo-identification—Western Atlantic, 1999–2013.PeerJ PrePrints.
Meekan MG, Bradshaw CJA, Press M, McLean C, Richards A, Quasnichka S, Taylor JA. 2006. Population size and structure of whale sharks (Rhincodon typus) at Ningaloo Reef, Western Australia.Marine Ecology Progress Series319:275–285DOI 10.3354/meps319275.
Nelson J, Eckert S. 2007.Foraging ecology by whale sharks (Rhincodon typus) within Bahia de los Angeles, Baja California Norte, Mexico.Fisheries Research84:47–64
DOI 10.1016/j.fishres.2006.11.013.
Norman B. 2002.Review of current and historical research on the ecology of whale sharks (Rhincodon typus), and applications to conservation through management of the species. Freemantle: Western Australian Department of Conservation and Land Management.
O’Farrell S, Smith I, Woodward M, Raines P. 2006.Whale Shark Photo-Identification Project, Sogod Bay, Philippines March 24–30, 2006. Coral Cay Conservation & DSV Discovery Report. Orams MB. 2002.Feeding wildlife as a tourism attraction: a review of issues and impacts.Tour
Manage23:281–293DOI 10.1016/S0261-5177(01)00080-2.
Quiros A. 2005.Whale shark “ecotourism” in the Philippines and Belize: evaluating conservation and community benefits.Tropical Resources: Bulletin of the Yale Tropical Resources Institute 24:42–48.
Quiros AL. 2007.Tourist compliance to a code of conduct and the resulting effects on whale shark (Rhincodon typus) behavior in Donsol, Philippines.Fisheries Research84:102–108
DOI 10.1016/j.fishres.2006.11.017.
Quiros A, Campo LF, van Bochove JW, Harding S, Raines P. 2007. Whale shark
photo-identification project, Sogod Bay, Philippines March 29–April 5, 2007. Coral Cay Conservation, Philippine Reef and Rainforest Conservation Foundation Inc. & DSV Discovery Report.
Ram´ırez-Mac´ıas D, Meekan M, de la Parra-Venegas R, Remolina-Su´arez F, Trigo- Mendoza M, V´azquez-Ju´arez R. 2012.Patterns in composition, abundance and scarring of whale sharks
Rhincodon typusnear Holbox Island, Mexico.Journal of Fish Biology80:1401–1416
DOI 10.1111/j.1095-8649.2012.03258.x.
Ram´ırez-Mac´ıas D, V´azquez-Haikin A, V´azquez-Ju´arez R. 2012.Whale sharkRhincodon typus
populations along the west coast of the Gulf of California and implications for management.
Endangered Species Research18:115–128DOI 10.3354/esr00437.
Remolina-Su´arez JF, P´erez RJJ, Gonz`alez CJM, de la Parra VR, Betancourt SN, Trigo MM, Gonzal´ez ML, Antele MJ. 2007.Whale shark management strategies, with the participation of local stakeholders, in Yum Balam, Mexico. In: Irvine TR, Keesing JK, eds.The first international whale shark conference: promoting international collaboration in whale shark: conservation, science and management. conference overview, abstract and supplementary proceedings. Wembley: CSIRO Marine and Atmospheric Research, 31–35.
Riley MJ, Hale MS, Harman A, Rees RG. 2010. Analysis of whale sharkRhincodon typus
aggregations near South Ari Atoll, Maldives Archipelago.Aquatic Biology8:145–150
DOI 10.3354/ab00215.
Robinson DP, Jaidah MY, Jabado RW, Lee-Brooks K, Nour El-Din NM, Al Malki AA, Elmeer K, McCormick PA, Henderson AC, Pierce SJ, Ormond RFG. 2013.Whale sharks,Rhincodon typus, aggregate around offshore platforms in Qatari waters of the Arabian Gulf to feed on fish spawn.PLoS ONE8(3):e58255DOI 10.1371/journal.pone.0058255.
Rohner CA, Couturier LIE, Richardson AJ, Pierce SJ, Prebble CEM, Gibbons MJ, Nichols PD. 2013.Diet of whale sharksRhincodon typusinferred from stomach content and signature fatty acid analyses.Marine Ecology Progress Series493:219–235DOI 10.3354/meps10500.
Rohner CA, Richardson AJ, Marshall AD, Weeks SJ, Pierce SJ. 2011.How large is the world’s largest fish? Measuring whale sharksRhincodon typuswith laser photogrammetry.Journal of Fish Biology78:378–385DOI 10.1111/j.1095-8649.2010.02861.x.
Rowat D, Brooks KS. 2012.A review of the biology, fisheries and conservation of the whale shark
Rhincodon typus.Journal of Fish Biology80:1019–1056DOI 10.1111/j.1095-8649.2012.03252.x. Rowat D, Brooks KS, March A, McCarten C, Jouannet D, Riley L, Jeffreys G, Perri M, Vely M,
Pardigo B. 2011.Long-term membership of whale sharks (Rhincodon typus) in coastal aggregations in Seychelles and Djibouti.Marine and Freshwater Research62:621–627
DOI 10.1071/MF10135.
Rowat D, Gore M. 2007. Regional scale horizontal and local scale vertical movements of whale sharks in the Indian Ocean offSeychelles. Fisheries Research84:32–40
DOI 10.1016/j.fishres.2006.11.009.
Rowat D, Meekan MG, Engelhardt U, Pardigon B, Vely M. 2007.Aggregations of juvenile whale sharks (Rhincodon typus) in the Gulf of Tadjoura, Djibouti.Environmental Biology of Fishes 80:465–472DOI 10.1007/s10641-006-9148-7.
Semeniuk CAD, Rothley KD. 2008.Costs of group-living for a normally solitary forager: effects of provisioning tourism on southern sting raysDasyatis americana.Marine Ecology Progress Series 357:271–282DOI 10.3354/meps07299.
Speed CW, Meekan MG, Rowat D, Pierce S, Marshall AD, Bradshaw CJA. 2008.Scarring patterns and relative mortality rates of Indian Ocean whale sharks.Journal of Fish Biology72:1488–1503
DOI 10.1111/j.1095-8649.2008.01810.x.
Stevens JD. 2007.Whale shark (Rhincodon typus) biology and ecology: a review of the primary literature.Fisheries Research84:4–9DOI 10.1016/j.fishres.2006.11.008.
Tania C, Hitipeuw C, Wijonarno A, Noor B, Stewart BS. 2013.Trend of whale shark sighting in Teluk cenderawasih National Park, Indonesia. In:Proceedings of the 3rd international whale shark conference. Atlanta USA.
The International Ecotourism Society.About TIES.Available athttp://www.ecotourism.org/
(accessed 10 January 2014).
Topelko KN, Dearden P. 2005.The shark watching industry and its potential contribution to shark conservation.Journal of Ecotourism4:108–128DOI 10.1080/14724040409480343. Van Tienhoven AM, Den Hartog JE, Reijns R, Peddemors VM. 2007. A
computer-aided program for pattern-matching of natural marks of the spotted ragged-tooth sharkCarcharias taurus (Rafinesque, 1810). Journal of Applied Ecology 44:273–280
DOI 10.1111/j.1365-2664.2006.01273.x.
Whitehead H. 2001.Analysis of animal movement using opportunistic individual identifications: application to sperm whales.Ecology82:1417–1432
DOI 10.1890/0012-9658(2001)082[1417:AOAMUO]2.0.CO;2.
Whitehead H. 2007.Selection of models of lagged identification rates and lagged association rates using AIC and QAIC.Communication in Statistics—Simulation and Computation36:1233–1246
DOI 10.1080/03610910701569531.
Whitehead H. 2009.SOCPROG programs: analysing animal social structures.Behavioral Ecology and Sociobiology63:765–778DOI 10.1007/s00265-008-0697-y.
Wilson SG, Polovina JJ, Stewart BS, Meekan MG. 2006.Movement of whale sharks (Rhincodon typus) tagged at Ningaloo Reef, Western Australia.Marine Biology 148(5):1157–1166
DOI 10.1007/s00227-005-0153-8.
Wimmer T, Whitehead H. 2005.Movements and distribution of northern bottlenose whales,