NHESSD
2, 3561–3576, 2014A new parametrization of intensity data and
handling of uncertainties
M. Mucciarelli
Title Page
Abstract Introduction
Conclusions References
Tables Figures
◭ ◮
◭ ◮
Back Close
Full Screen / Esc
Printer-friendly Version
Interactive Discussion
Discussion
P
a
per
|
Discus
sion
P
a
per
|
Discussion
P
a
per
|
Discussion
P
a
per
|
Nat. Hazards Earth Syst. Sci. Discuss., 2, 3561–3576, 2014 www.nat-hazards-earth-syst-sci-discuss.net/2/3561/2014/ doi:10.5194/nhessd-2-3561-2014
© Author(s) 2014. CC Attribution 3.0 License.
This discussion paper is/has been under review for the journal Natural Hazards and Earth System Sciences (NHESS). Please refer to the corresponding final paper in NHESS if available.
A proposal for a new parametrization of
historical intensity data providing a better
handling of uncertainties
M. Mucciarelli1,2
1
Seismological Research Center, OGS, Trieste, Italy
2
School of Engineering, Basilicata University, Potenza, Italy
Received: 5 April 2014 – Accepted: 5 May 2014 – Published: 20 May 2014
Correspondence to: M. Mucciarelli ([email protected])
NHESSD
2, 3561–3576, 2014A new parametrization of intensity data and
handling of uncertainties
M. Mucciarelli
Title Page
Abstract Introduction
Conclusions References
Tables Figures
◭ ◮
◭ ◮
Back Close
Full Screen / Esc
Printer-friendly Version
Interactive Discussion
Discussion
P
a
per
|
Discus
sion
P
a
per
|
Discussion
P
a
per
|
Discussion
P
a
per
|
Abstract
In recent times a great deal of research was aimed to the reduction of uncertainties on Probabilistic Seismic Hazard Analysis (PSHA). Most attention was paid to the role of Ground Motion Prediction Equations (GMPEs), while no studies were devoted to a possible larger source of uncertainties: the historical catalogues of earthquakes.
5
In areas where historical catalogues provide a many centuries long record and sur-face geology does not permit at the moment to have complete catalogues of seismo-genic faults, their use is unavoidable for estimating seismicity rates required for PSHA. Their use is also gaining popularity as an independent tool for the estimation of PSHA (D’Amico and Albarello, 2008) or for their use for validation purposes (Stirling and
Pe-10
tersen, 2006; Mucciarelli et al., 2008).
This paper proposes an alternative way for the parametrization of historical macro-seismic intensity and then discusses which is the real impact of starting uncertainties in intensities on the final uncertainties on PSHA.
1 Introduction
15
For each known historical earthquake, the first step of research is to assign macro-seismic intensity at any point affected by what is recognized to be a single event. Then a parametrization is made to have epicentral data such as location and epicentral in-tensity.
In several instances, the historical seismologist is not able to assign unambiguously
20
a single intensity value whose description matches exactly the observations. Is then common practice to assign values such as VI–VIII which are subsequently handled as 7.5 in further calculations. This is not a correct way to proceed, since half-degrees are not foreseen in intensity scales. This is an advice included also in the second version of the EMS scale (Grünthal et al., 1998):
NHESSD
2, 3561–3576, 2014A new parametrization of intensity data and
handling of uncertainties
M. Mucciarelli
Title Page
Abstract Introduction
Conclusions References
Tables Figures
◭ ◮
◭ ◮
Back Close
Full Screen / Esc
Printer-friendly Version
Interactive Discussion
Discussion
P
a
per
|
Discus
sion
P
a
per
|
Discussion
P
a
per
|
Discussion
P
a
per
|
“It will often be the case that no single intensity degree can be decided upon with any confidence. In such cases, it is necessary to decide whether some approximate assessment of intensity can be made, or whether the data are so contradictory that it is better to leave the matter unresolved... It is recommended that the user preserves the integer character of the scale, and not uses forms such as ‘6.5’ or ‘6 1/2’ or ‘6+’. . . In
5
such cases the intensity should be written as 6–7, meaning either 6 or 7; it does not imply some intermediate value”.
2 Methodology
The use of forms like 6.5 is a remnant of the punched card era, when earthquake cat-alogues needed to have all the information compressed in the 80 characters available
10
for each line/event. Nowadays uncertainty on intensity data could be handled using vectorial intensity, such as proposed for site hazard estimates by Magri et al. (1994) ad subsequently by Albarello and Mucciarelli (2002). This is commonly done when using probabilistic attenuation relationships, but could be a great opportunity for the revision of catalogues, leaving to the historical seismologist the possibility of expressing his
15
feeling that an event is “almost certainly” an intensity VIII (e.g. 0.9 probability) while it cannot be completely ruled out that the effects reached IX (e.g. 0.1 probability). For 12◦ intensities scales (like MMI, MCS, MSK, EMS) this will result in a 12 term probability vector, with a value for each intensity class expressing the probability that the intensity is equal to or larger than that class:
20
[1.0 1.0 1.0 1.0 1.0 1.0 1.0 0.9 0.1 0.0 0.0 0.0]
This formulation could be used both for single site intensity data and for the epicentral parametrization of the earthquake. Of course this could apply also to data that now are taken as integer intensity values but could raise some doubts in historical seismolo-gists.
NHESSD
2, 3561–3576, 2014A new parametrization of intensity data and
handling of uncertainties
M. Mucciarelli
Title Page
Abstract Introduction
Conclusions References
Tables Figures
◭ ◮
◭ ◮
Back Close
Full Screen / Esc
Printer-friendly Version
Interactive Discussion
Discussion
P
a
per
|
Discus
sion
P
a
per
|
Discussion
P
a
per
|
Discussion
P
a
per
|
The use of probability to express the degree of belief should be subjected to simple “conversion rules” such those listed in the EMS-98 scale for the definition of quantity such as “many”, “few”, or “most”. A possible conversion rule is given in Table 1.
3 The effect of intensity uncertainty on PSHA
Mucciarelli and Albarello (2012) discussed a rough approximation of the effect of
inten-5
sity uncertainty on PSHA: if one is not sure that a quake was an intensity, say, 5 event because some elements suggest that it could be an intensity 6, then from the point of view of relative error, this means that we are compiling our input catalog with data that are affected by a (6−5)/5=20 % starting error. The theory of error propagation proce-dures states that relative errors cannot decrease throughout the procedure from input
10
data to final outcomes, thus the minimum effect on PSHA will be at least an uncertainty of 20 %.
To explore the effect that uncertainty on intensity assignment has on Mean Recur-rence Times, the simplest estimate of PSHA at a given site, I have chosen sites in the area affected by the recent 2012 Emilia, Italy, earthquake. The Po Plain is an ideal
15
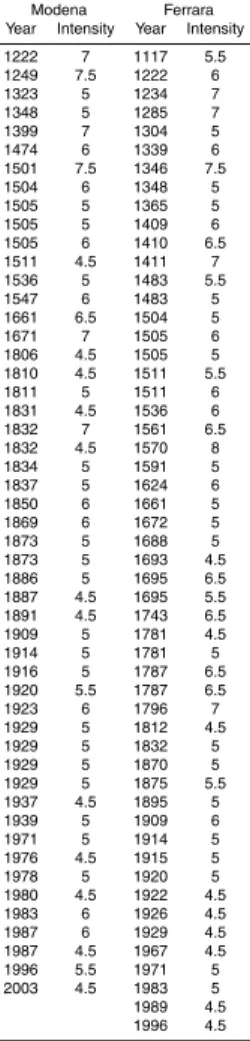
study area, because many cities have a complete seismic history dating back to mid-dle ages. Considering the site earthquake catalogue for Ferrara and Modena, the two closest cities to the 2012 earthquake sequence, we note many damaging earthquake as well as an abundance of uncertain intensities (Table 2).
There are two possible ways to proceed then. They have in common the
Monte-20
Carlo simulation of hundreds of run to estimate MRTs with fixed intensity values when possible, while at each simulation the “half-degrees” are treated in two alternative ways:
1. each half-degree between thenth and the n+1th degree is assigned with a ran-dom probabilitypbetween 0 and 1 to thenth degree and with a probability 1−p to then+1th degree.
NHESSD
2, 3561–3576, 2014A new parametrization of intensity data and
handling of uncertainties
M. Mucciarelli
Title Page
Abstract Introduction
Conclusions References
Tables Figures
◭ ◮
◭ ◮
Back Close
Full Screen / Esc
Printer-friendly Version
Interactive Discussion
Discussion
P
a
per
|
Discus
sion
P
a
per
|
Discussion
P
a
per
|
Discussion
P
a
per
|
2. each half-degree is assigned with a random selection either to thenth degree or to then+1th degree
For the site intensities I modified the catalogue following the first approach, while the second will be used for the sensitivity analysis on seismogenic zones.
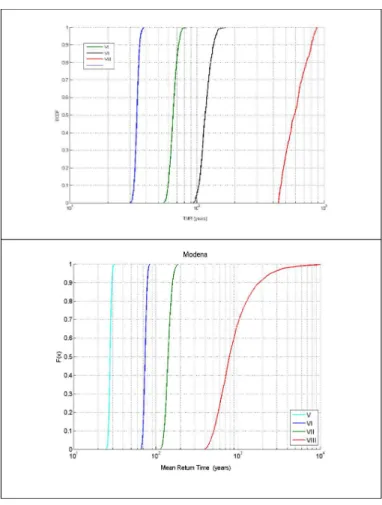
The result of 5000 runs on modified site catalogues for Modena and Ferrara is shown
5
in Fig. 1, with the MRT estimated separately for each intensity class as the time be-tween the first and last shock divided by the sum of probabilities of events (see Magri et al., 1994).
It is possible to note that as expected the dispersion increases with the increase of intensity. On the other hand the MRTs are smaller for lower intensities, so the relative
10
error on estimates remains similar.
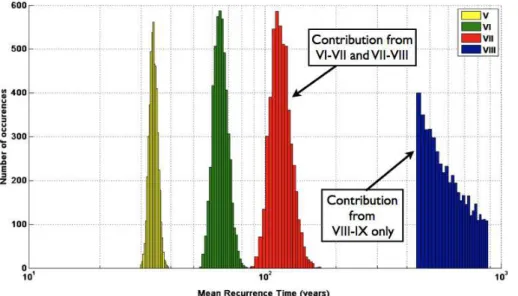
This can be seen in a better way plotting histograms instead of ECDFs (see Fig. 2) It is worth noting that the distributions are slightly asymmetrical for lower intensities as an effect of the Gutenberg–Richter-like distribution as a function of intensity, with less events coming from above than from below. The highest class is highly
asymmet-15
rical due to the fact that no contribution may come from above.
Stitching to the non-parametric style adopted for this exercise, the uncertainty can be estimated as the ratio between median and inter-quartile range, with results in the range 25–30 % for all intensity thresholds.
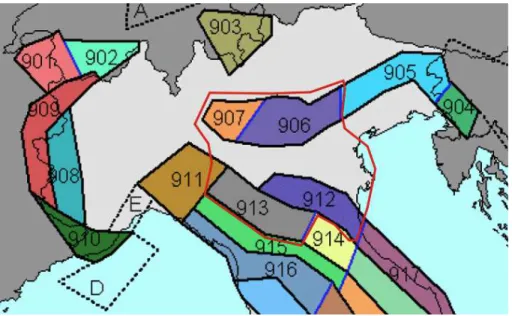
The last step of this study considers recurrence model using epicentral intensities
20
data, as given from the CPTI catalogue of INGV (http://emidius.mi.ingv.it/CPTI11/). The area selected is reported in Fig. 3, and comprises the four seismogenic zone covering most of the Po Valley, according to the zoning available from INGV at the web page http://zonesismiche.mi.ingv.it/documenti/App2.pdf.
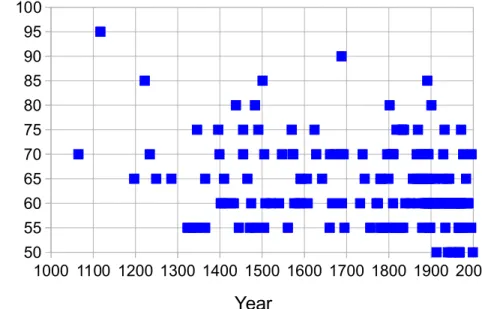
The parametric catalogue for this area (CPTI11) reports 184 events with intensity
25
greater or equal to V degree MCS, and 76 are listed with half-integer intensity values (see Fig. 4).
NHESSD
2, 3561–3576, 2014A new parametrization of intensity data and
handling of uncertainties
M. Mucciarelli
Title Page
Abstract Introduction
Conclusions References
Tables Figures
◭ ◮
◭ ◮
Back Close
Full Screen / Esc
Printer-friendly Version
Interactive Discussion
Discussion
P
a
per
|
Discus
sion
P
a
per
|
Discussion
P
a
per
|
Discussion
P
a
per
|
described in Magri et al., 1994), and at every run each half-degree was assigned either to the lower or to the higher degree using a random selection with uniform probability.
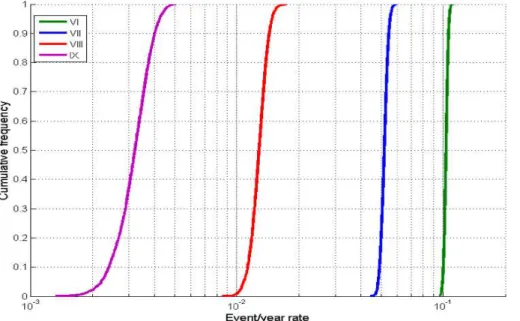
Figure 5 reports the result of 2000 runs. As expected, the variability increases with increasing of intensity in a way similar to that observed for site intensities. In this case a further analysis was performed: at each random generation, it was possible to save
5
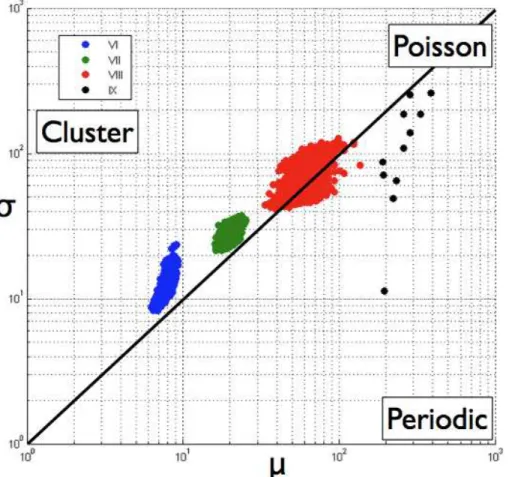
the distribution of inter-event times of each modified catalogue, to study the distribution of ratio average vs. standard deviation (Fig. 6) compared with a Poisson distribution for which the ratio should be equal to 1.
The result is puzzling. Moving from the lowermost intensities to the highest, the be-havior seems to change from clustered to slightly periodic. This may be explained in
10
several ways:
1. no single relationships exist for the frequency distribution of events (Gutenberg– Richter-like);
2. notwithstanding the fact that CPTI11 is declared as a de-clustered catalogue, clustering is still present for lower intensities, maybe due to medium-range
corre-15
lation of seismicity between the borders of the Po Plain as suggested by Bragato (2014);
3. the move toward periodic behavior (α <1) at higher intensities could be due to a problem of under-sampling, because not all the modified catalogues allow for enough events of intensity IX to be present. For a discussion of the role of
under-20
sampling in assessing correctly the time distribution of large event, see Ellsworth et al. (1999) or Mucciarelli (2007).
4 Conclusions
The uncertainty in assignment of intensity both at each site or in parametric histor-ical catalogues propagates to PSH estimates affecting final result with a relative
er-25
NHESSD
2, 3561–3576, 2014A new parametrization of intensity data and
handling of uncertainties
M. Mucciarelli
Title Page
Abstract Introduction
Conclusions References
Tables Figures
◭ ◮
◭ ◮
Back Close
Full Screen / Esc
Printer-friendly Version
Interactive Discussion
Discussion
P
a
per
|
Discus
sion
P
a
per
|
Discussion
P
a
per
|
Discussion
P
a
per
|
avoiding fake half-degrees in favor of a probabilistic translation of expert judgment. The intensity could then be given for each event as a 12 values vector, that can pro-vide alternative input to standard PSHA codes or be easily incorporated in existing PSHA softwares designed for exploitation of intensity data like SASHA (D’Amico and Albarello, 2008).
5
Acknowledgements. This research was funded by a grant under project SIGMA (http:// projet-sigma.com).
References
Albarello, D. and Mucciarelli, M.: Seismic hazard estimates from ill-defined macroseismic data at a site, Pure Appl. Geophys., 159, 1289–1304, 2002.
10
Bragato, P. L.: Rate changes, premonitory quiescence, and synchronization of earth-quakes in northern Italy and its surroundings, Seismol. Res. Lett., 85, 639–648, doi:10.1785/0220130139 2014.
D’Amico, V. and Albarello, D.: SASHA: a computer program to assess seismic hazard from intensity data, Seismol. Res. Lett., 79, 663–671, 2008.
15
Ellsworth, W. L., Matthews, M. V., Nadeau, R. M., Nishenko, S. P., Reasenberg, P. A., and Simpson, R. W.: A Physically-Based Earthquake Recurrence Model for Estimation of Long-Term Earthquake Probabilities, USGS Open File 522, 22 pp., 1999.
Grünthal, G.: European Macroseismic Scale 1998 (EMS-98), Cahiers du Centre Européen de Géodynamique et de Séismologie, 15, 1–99, 1998.
20
Magri, L., Mucciarelli, M., and Albarello, D.: Estimates of site seismicity rates using ill-defined macroseismic data, Pure Appl. Geophys., 143, 618–632, 1994.
Mucciarelli, M.: A test for checking earthquake aperiodicity estimates from small samples, Nat. Hazards Earth Syst. Sci., 7, 399–404, doi:10.5194/nhess-7-399-2007, 2007.
Mucciarelli, M. and Albarello, D.: Comment on “Seismic hazard assessment (2003–2009) for
25
the Italian Building Code” by Stucchi, M. et al., B. Seismol. Soc. Am., 102, 2789–2792, 2012. Mucciarelli, M., Albarello, D., and D’Amico, V.: Comparison of probabilistic seismic hazard
NHESSD
2, 3561–3576, 2014A new parametrization of intensity data and
handling of uncertainties
M. Mucciarelli
Title Page
Abstract Introduction
Conclusions References
Tables Figures
◭ ◮
◭ ◮
Back Close
Full Screen / Esc
Printer-friendly Version
Interactive Discussion
Discussion
P
a
per
|
Discus
sion
P
a
per
|
Discussion
P
a
per
|
Discussion
P
a
per
|
Table 1.Proposal of conversion rule of expert judgment into probability for the statement “the intetsity is equal to or greater than a given class”.
NHESSD
2, 3561–3576, 2014A new parametrization of intensity data and
handling of uncertainties M. Mucciarelli Title Page Abstract Introduction Conclusions References Tables Figures ◭ ◮ ◭ ◮ Back Close
Full Screen / Esc
Printer-friendly Version Interactive Discussion Discussion P a per | Discus sion P a per | Discussion P a per | Discussion P a per |
Table 2.Site seismic history for Modena and Ferrara, Italy, from the Italian Data-Base of Macro-seismic Intensities, available on INGV website (http://emidius.mi.ingv.it/DBMI11/).
Modena Ferrara Year Intensity Year Intensity
NHESSD
2, 3561–3576, 2014A new parametrization of intensity data and
handling of uncertainties
M. Mucciarelli
Title Page
Abstract Introduction
Conclusions References
Tables Figures
◭ ◮
◭ ◮
Back Close
Full Screen / Esc
Printer-friendly Version
Interactive Discussion
Discussion
P
a
per
|
Discus
sion
P
a
per
|
Discussion
P
a
per
|
Discussion
P
a
per
|
1000 1100 1200 1300 1400 1500 1600 1700 1800 1900 2000 50
55 60 65 70 75 80 85 90 95 100
Year
In
te
n
si
ty*
1
0
NHESSD
2, 3561–3576, 2014A new parametrization of intensity data and
handling of uncertainties
M. Mucciarelli
Title Page
Abstract Introduction
Conclusions References
Tables Figures
◭ ◮
◭ ◮
Back Close
Full Screen / Esc
Printer-friendly Version
Interactive Discussion
Discussion
P
a
per
|
Discus
sion
P
a
per
|
Discussion
P
a
per
|
Discussion
P
a
per
|