www.nat-hazards-earth-syst-sci.net/14/2761/2014/ doi:10.5194/nhess-14-2761-2014
© Author(s) 2014. CC Attribution 3.0 License.
Uncertainty in PSHA related to the parametrization of
historical intensity data
M. Mucciarelli
Seismological Research Center, OGS, Trieste, Italy School of Engineering, Basilicata University, Potenza, Italy Correspondence to:M. Mucciarelli ([email protected])
Received: 5 April 2014 – Published in Nat. Hazards Earth Syst. Sci. Discuss.: 20 May 2014 Revised: 1 September 2014 – Accepted: 6 September 2014 – Published: 13 October 2014
Abstract. In recent times a great deal of research aimed to reduce of uncertainties in probabilistic seismic hazard anal-ysis (PSHA). Most attention was paid to the role of ground motion prediction equations (GMPEs; see, e.g., Strasser et al., 2009), while no studies were devoted to a possible larger source of uncertainties: the historical catalogues of earth-quakes.
In areas where historical catalogues provide a record many centuries long and surface geology does not permit us to ob-tain complete catalogues of seismogenic faults at the mo-ment, their use is unavoidable for estimating seismicity rates required for PSHA. Their use is also gaining popularity as an independent tool for the estimation of PSHA (D’Amico and Albarello, 2008) and for validation purposes (Stirling and Petersen, 2006; Mucciarelli et al., 2008).
After proposing an alternative parametrization of histor-ical macroseismic intensity, this paper is devoted to dis-cussing what the real impact of starting uncertainties in in-tensities on the final uncertainties in PSHA is.
1 State of the art and a new proposal
For each known historical earthquake, the first step of re-search is to assign a macroseismic intensity to any point of the area affected by what is recognized to be a single event. Then a parametrization is made in order to obtain epicentral data, such as location and epicentral intensity.
In several instances, the historical seismologist is not able to unambiguously assign a single intensity value whose de-scription matches the observations exactly. It is then com-mon practice to assign values such as VII–VIII, which are
subsequently treated as 7.5 in further calculations. This is not the correct way to proceed, since intensity scales do not pro-vide for the use of half-degrees. This is advice also included in the second version of the EMS (European Macroseismic Scale) (Grünthal, 1998):
It will often be the case that no single intensity de-gree can be decided upon with any confidence. In such cases, it is necessary to decide whether some approximate assessment of intensity can be made, or whether the data are so contradictory that it is better to leave the matter unresolved. ... It is recom-mended that the user preserves the integer charac-ter of the scale, and not uses forms such as “6.5” or “612” or “6+”. . . In such cases the intensity should be written as 6–7, meaning either 6 or 7; it does not imply some intermediate value. [sic]
Table 1.Proposal of conversion rule of expert judgment into prob-ability for the statement “the intensity is equal to or greater than a given class”.
Absolutely true 1 Very likely 0.9 Uncertain 0.5 Unlikely 0.1 Absolutely false 0
reached IX (e.g. 0.1 probability). For 12◦ intensity scales (such as Modified Mercalli Intensity (MMI), Mercalli Can-cani Sieberg (MCS), Medvedev Sponheuer Karnik (MSK), European Macroseimic Scale (EMS)), this will result in a 12-term probability vector, with a value for each intensity class expressing the probability that the intensity is equal to or larger than that class:
[1.0 1.0 1.0 1.0 1.0 1.0 1.0 0.9 0.1 0.0 0.0 0.0].
This formulation could be used both for single-site inten-sity data and for the epicentral parametrization of the earth-quake. Of course, this could apply also to data that now are taken as integer intensity values but could raise some doubts for historical seismologists.
The use of probability to express the degree of belief should be subjected to simple conversion rules such those listed in the EMS-98 scale for the definition of quantities such as “many”, “few”, or “most”. A possible conversion rule is given in Table 1.
2 The effect of intensity uncertainty on PSHA
Mucciarelli and Albarello (2012) discussed a rough approxi-mation of the effect of intensity uncertainty on PSHA (prob-abilistic seismic hazard analysis): if one is not sure that a quake had an intensity of, say, 5 because some elements sug-gest that it could be of an intensity of 6, then, from the point of view of relative error, this means that we are compiling our input catalog with data that are affected by a(6−5)/5=20 % starting error. The relative error gets smaller for higher inten-sities, but since the PSHA is calculated using the whole cata-logue and since the theory of error propagation states that rel-ative errors cannot decrease throughout the procedure from input data to final outcomes, the minimum effect on PSHA will be at least an uncertainty of 20 %.
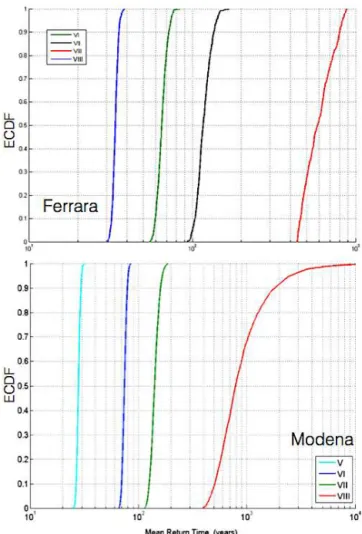
To explore the effect that uncertainty on intensity assign-ment has on mean recurrence times, the simplest estimate of PSHA at a given site, I have chosen sites in the area affected by the recent 2012 earthquake in Emilia, Italy. The Po Plain is an ideal study area because many cities have a complete seismic history dating back to Middle Ages. When consid-ering the site earthquake catalogue for Ferrara and Modena, the two closest cities to the 2012 earthquake sequence, we
Figure 1.Empirical cumulative distribution functions of the MRT in Ferrara (above) and Modena (below), produced by 5000 simula-tion runs for some of the intensity classes.
note many damaging earthquake as well as an abundance of uncertain intensities (Table 2).
There are two possible ways to proceed. They have in common the Monte Carlo simulation of hundreds of runs to estimate MRTs (mean return times). Once the classes of a seismic scale are defined as a domain for the Monte Carlo simulation, the inputs are generated according to one of these two ways:
1. fix a level of intensity (i.e. VII–VIII), modify a site his-tory by associating the valuep(or 1−p) with the in-tensity class VII (or VIII) for each of the earthquakes of that intensity, p being drawn from a uniform distribution on (0;1);
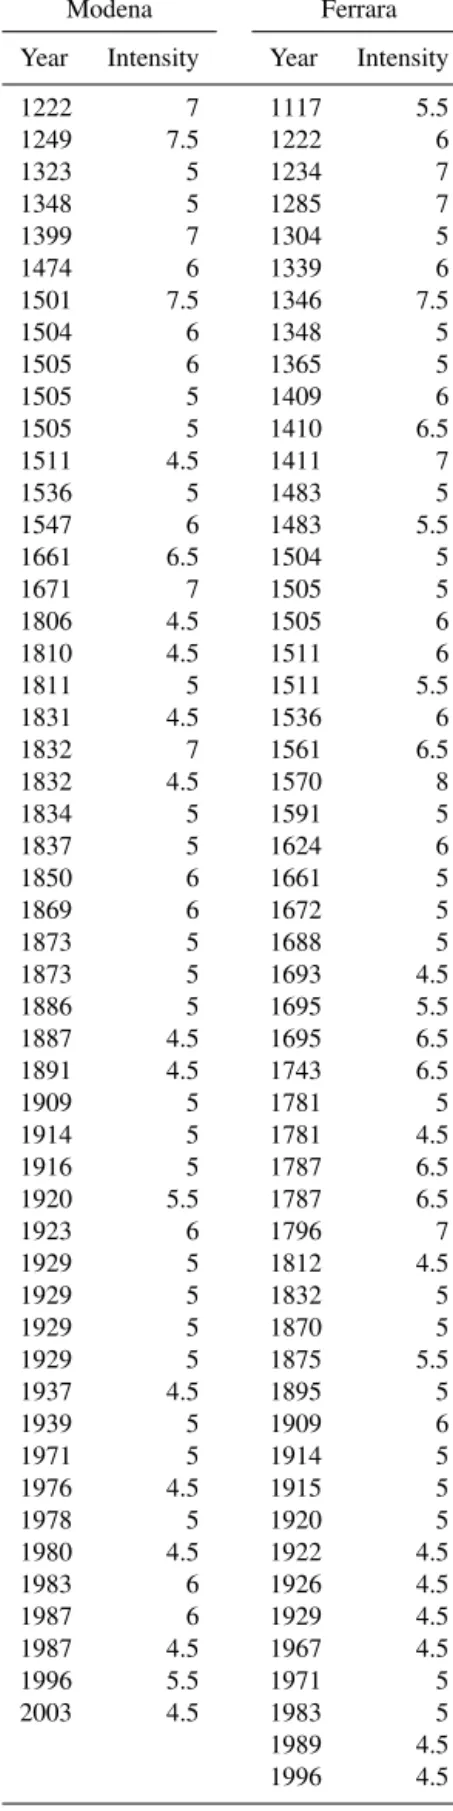
Table 2. Site seismic history for Modena and Ferrara, Italy, from the Italian Database of Macroseismic Intensities, available on the INGV website (http://emidius.mi.ingv.it/DBMI11/).
Modena Ferrara
Year Intensity Year Intensity
1222 7 1117 5.5
1249 7.5 1222 6
1323 5 1234 7
1348 5 1285 7
1399 7 1304 5
1474 6 1339 6
1501 7.5 1346 7.5
1504 6 1348 5
1505 6 1365 5
1505 5 1409 6
1505 5 1410 6.5
1511 4.5 1411 7
1536 5 1483 5
1547 6 1483 5.5
1661 6.5 1504 5
1671 7 1505 5
1806 4.5 1505 6
1810 4.5 1511 6
1811 5 1511 5.5
1831 4.5 1536 6
1832 7 1561 6.5
1832 4.5 1570 8
1834 5 1591 5
1837 5 1624 6
1850 6 1661 5
1869 6 1672 5
1873 5 1688 5
1873 5 1693 4.5
1886 5 1695 5.5
1887 4.5 1695 6.5
1891 4.5 1743 6.5
1909 5 1781 5
1914 5 1781 4.5
1916 5 1787 6.5
1920 5.5 1787 6.5
1923 6 1796 7
1929 5 1812 4.5
1929 5 1832 5
1929 5 1870 5
1929 5 1875 5.5
1937 4.5 1895 5
1939 5 1909 6
1971 5 1914 5
1976 4.5 1915 5
1978 5 1920 5
1980 4.5 1922 4.5
1983 6 1926 4.5
1987 6 1929 4.5
1987 4.5 1967 4.5
1996 5.5 1971 5
2003 4.5 1983 5
1989 4.5
1996 4.5
Figure 2.Histograms of the MRT in Ferrara, produced by 5000 runs for some of the intensity classes.
Figure 3.The seismogenic zones whose earthquakes were used for simulations.
For the site intensities, I modified the catalogue following the first approach, while the second was used for the sensi-tivity analysis of seismogenic zones. The result of 5000 runs on catalogues resulting from the simulation for Modena and Ferrara is shown in Fig. 1, with the MRT estimated separately for each intensity class as the time between the first and last shock divided by the sum of probabilities of events obtained counting the number (or the total weight) of the events in the various classes of intensity (VI;VII;VIII;IX) (see Magri et al., 1994).
It is possible to note that, as expected, the dispersion in-creases with the increase in intensity. On the other hand, the MRTs are smaller for lower intensities, so the relative error on estimates remains similar. This can be seen better by plot-ting histograms instead of empirical cumulative distribution functions (ECDFs) (see Fig. 2).
Figure 4.The earthquakes used for simulations, plotted by year and intensity. Note the large amount of half-degree intensities.
Following the nonparametric style adopted for this exer-cise, the uncertainty can be estimated as the ratio between the median and interquartile range, with results in the range of 25–30 % for all intensity thresholds.
The last step of this study considers a recurrence model using epicentral intensities data, as given by the Catlogo Parametrico dei Terremoti Italiani, parametric catalogue of Italian earthquakes (CPTI) catalogue of Istituto Nazionale di Geofisica e Vulcanologia, national institute of geo-physics and volcanology (INGV) (http://emidius.mi.ingv.it/ CPTI11/). The area selected is shown in Fig. 3 and comprises the four seismogenic zones covering most of the Po Valley, according to the zoning available from INGV on the web page http://zonesismiche.mi.ingv.it/documenti/App2.pdf.
The parametric catalogue of this area (CPTI11) reports 184 events with an intensity greater or equal to a V-degree MCS, and 76 are listed with half-integer intensity values (see Fig. 4).
To estimate the effect of this uncertainty on seismic rates, the four zones were considered together. Hundreds of simu-lations were run to estimate seismic rates (again, as described in Magri et al., 1994), and at every run each half-degree was assigned either to the lower or to the higher degree using a random selection with uniform probability.
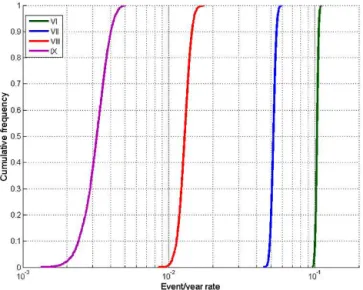
Figure 5 reports the result of 2000 runs. As expected, the variability increases with increasing intensity in a way simi-lar to that observed for site intensities. In this case, a further analysis was performed: at each random generation, it was possible to save the distribution of interevent times of each modified catalogue; This was done in order to study the dis-tribution of ratio average vs. variance (Fig. 6) compared to a Poisson distribution for which the ratio should be equal to 1. The result is puzzling. Moving from the lowermost intensi-ties to the highest, the behaviour seems to change from clus-tered to slightly periodic. This may be explained in several ways:
1. No single relationships exist for the frequency distribu-tion of events (Gutenberg–Richter-like).
Figure 5.ECDF of the activity rates for four intensity classes.
Figure 6.Aperiodicity and clustering for 2000 runs of modified historical catalogues of the Po Plain.
2. Notwithstanding the fact that CPTI11 is declared as a declustered catalogue, clustering is still present for lower intensities, maybe due to medium-range correla-tion of seismicity between the borders of the Po Plain, as suggested by Bragato (2014).
3 Conclusions
The uncertainty in intensity assignment, both at a given site and in parametric historical catalogues, propagates to PSH (probabilistic seismic hazard) estimates, affecting final result with a relative error of around 25–30 %. To avoid this uncer-tainty, existing catalogues should be revised avoiding false half-degrees in favour of a probabilistic translation of expert judgment. The intensity could then be given for each event as a 12-values vector that can provide alternative input to standard PSHA codes or be easily incorporated into exist-ing PSHA software designed for the exploitation of intensity data, such as SASHA (D’Amico and Albarello, 2008).
Acknowledgements. This research was funded by a grant within the context of the project SIGMA (SeIsmic Ground Motion Assessment, http://projet-sigma.com). I acknowledge the fruitful discussion with Gordon Woo and Jean Savy.
Edited by: O. Katz
Reviewed by: two anonymous referees
References
Albarello, D. and Mucciarelli, M.: Seismic hazard estimates from ill-defined macroseismic data at a site, Pure Appl. Geophys. 159, 1289–1304, 2002.
Bragato, P. L.: Rate changes, premonitory quiescence, and syn-chronization of earthquakes in northern Italy and its surround-ings, Seismol. Res. Lett., 85, 639–648, doi:10.1785/0220130139, 2014.
D’Amico, V. and Albarello, D.: SASHA: a computer program to assess seismic hazard from intensity data, Seismol. Res. Lett., 79, 663–671, 2008.
Ellsworth, W. L., Matthews, M. V., Nadeau, R. M., Nishenko, S. P., Reasenberg, P. A., and Simpson, R. W.: A Physically-Based Earthquake Recurrence Model for Estimation of Long-Term Earthquake Probabilities, U.S.G.S. Open File 522, 22 pp., 1999.
García-Fernández, M. and Egozcue, J. J.: Seismic hazard assess-ment in TERESA test areas based on a Bayesian technique, Nat-ural Hazards, 2, 249–265, 1989.
Grünthal, G.: European Macroseismic Scale 1998 (EMS-98), Cahiers du Centre Européen de Géodynamique et de Séismolo-gie, 15, 1–99, 1998.
Magri, L., Mucciarelli, M., and Albarello, D.: Estimates of site seis-micity rates using ill-defined macroseismic data, Pure Appl. Geo-phys., 143, 618–632, 1994.
Mucciarelli, M.: A test for checking earthquake aperiodicity esti-mates from small samples, Nat. Hazards Earth Syst. Sci., 7, 399– 404, doi:10.5194/nhess-7-399-2007, 2007.
Mucciarelli, M. and Albarello, D.: Comment on “Seismic Haz-ard Assessment (2003–2009) for the Italian Building Code” by M. Stucchi et al., B. Seismol. Soc. Am., 102, 2789–2792, 2012. Mucciarelli, M., Albarello, D., and D’Amico, V.: Comparison of
probabilistic seismic hazard estimates in Italy, B. Seismol. Soc. Am., 98, 2652–2664, 2008.
Rotondi, R., Egozcue, J. J., and Zonno, G.: Bayesian approach to the treatment of uncertainty in seismic data, Statistician, 42, 513– 523, 1993.
Stirling, M. and Petersen, M.: Comparison of the historical record of earthquake hazard with seismic hazard models for New Zealand and the Continental United States, B. Seismol. Soc. Am., 96, 1978–1994, 2006.