Studies in Late-Onset Fuchs Endothelial Corneal
Dystrophy
Yi-Ju Li1,2.*, Mollie A. Minear2., Jacqueline Rimmler2
, Bei Zhao2, Elmer Balajonda3, Michael A. Hauser2, R. Rand Allingham3, Allen O. Eghrari4, S. Amer Riazuddin4, Nicholas Katsanis5, John D. Gottsch4, Simon G. Gregory2, Gordon K. Klintworth3,6, Natalie A. Afshari3
1Department of Biostatistics and Bioinformatics, Duke University Medical Center, Durham, North Carolina, United States of America,2Center for Human Genetics, Duke University Medical Center, Durham, North Carolina, United States of America,3Duke University Eye Center, Duke University Medical Center, Durham, North Carolina, United States of America,4Wilmer Eye Institute, The Johns Hopkins University School of Medicine, Baltimore, Maryland, United States of America,5Center for Human Disease Modeling, Duke University, Durham, North Carolina, United States of America,6Department of Pathology, Duke University Medical Center, Durham, North Carolina, United States of America
Abstract
Fuchs endothelial corneal dystrophy (FECD) is a common, late-onset disorder of the corneal endothelium. Although progress has been made in understanding the genetic basis of FECD by studying large families in which the phenotype is transmitted in an autosomal dominant fashion, a recently reported genome-wide association study identified common alleles at a locus on chromosome 18 nearTCF4which confer susceptibility to FECD. Here, we report the findings of our independent validation study forTCF4using the largest FECD dataset to date (450 FECD cases and 340 normal controls). Logistic regression with sex as a covariate was performed for three genetic models: dominant (DOM), additive (ADD), and recessive (REC). We found significant association with rs613872, the target marker reported by Baratzet al.(2010), for all three genetic models (DOM:P= 9.33610235; ADD:P= 7.48
610230; REC:P= 5.2761026). To strengthen the association study, we also conducted a genome-wide linkage scan on 64 multiplex families, composed primarily of affected sibling pairs (ASPs), using both parametric and non-parametric two-point and multipoint analyses. The most significant linkage region localizes to chromosome 18 from 69.94cM to 85.29cM, with a peak multipoint HLOD = 2.5 at rs1145315 (75.58cM) under the DOM model, mapping 1.5 Mb proximal to rs613872. In summary, our study presents evidence to support the role of the intronicTCF4single nucleotide polymorphism rs613872 in late-onset FECD through both association and linkage studies.
Citation:Li Y-J, Minear MA, Rimmler J, Zhao B, Balajonda E, et al. (2011) Replication ofTCF4through Association and Linkage Studies in Late-Onset Fuchs Endothelial Corneal Dystrophy. PLoS ONE 6(4): e18044. doi:10.1371/journal.pone.0018044
Editor:Florian Kronenberg, Innsbruck Medical University, Austria
ReceivedOctober 22, 2010;AcceptedFebruary 22, 2011;PublishedApril 20, 2011
Copyright:ß2011 Li et al. This is an open-access article distributed under the terms of the Creative Commons Attribution License, which permits unrestricted use, distribution, and reproduction in any medium, provided the original author and source are credited.
Funding:Funding for this work was provided by NEI R01 grants EY016514 (GKK), EY016835 (JDG and NK), EY015543 (RRA), EY019126 (MAH) and EY013315 (MAH); and Research to Prevent Blindness (NAA; http://www.rpbusa.org/rpb/). NK is a Distinguished Brumley Professor. The funders had no role in study design, data collection and analysis, decision to publish, or preparation of the manuscript.
Competing Interests:The authors have declared that no competing interests exist. * E-mail: [email protected]
.These authors contributed equally to this work.
Introduction
Fuchs endothelial corneal dystrophy (FECD), first described by Ernst Fuchs [1], is a common progressive disorder of the corneal endothelium that typically becomes symptomatic during the fifth or sixth decade of life [2,3], although corneal endothelial abnormalities can be clinically detected several years before patients become symptomatic [4]. The disorder affects as much as 4% of the United States population over the age of 40 years [5–7] and occurs predominantly in women, who comprise approximate-ly 75% of cases [8]. This debilitating disorder leads to corneal edema with a loss of corneal clarity, painful episodes of recurrent corneal erosions, severe impairment of visual acuity, and sometimes even blindness.
FECD is often inherited as an autosomal dominant trait [5,9– 13] and 50% of clinical cases of FECD are estimated to show familial clustering [2]. While it is recognized that FECD has a
genetic basis, few genes have been identified that explain the genetic underpinnings of FECD susceptibility. The first gene to be causally linked with FECD was COL8A2 (MIM: 120252) on chromosome 1, in which two missense mutations, p.L450W and p.Q455V/Q455K, have been replicated in rare early-onset (before 40 years of age) FECD multigenerational families [3,13– 15] and in atypical sporadic FECD cases [15]. AdditionalCOL8A2
missense mutations have been identified in late-onset FECD patients, although their role remains unclear due to conflicting results [16–18]. Mutations in two additional genes that play roles in other corneal endothelial dystrophies have also been suggested to cause FECD. SLC4A11 (MIM: 610206), which causes autosomal recessive congenital hereditary endothelial dystrophy (CHED2, MIM: 217700) [19], was found to contain mutations in Chinese, Indian, and Caucasian patients with the common late-onset phenotype of FECD [20,21]. Additionally, mutations in
polymorphous corneal dystrophy (PPCD, MIM: 609141) [22], were recently reported in late-onset Caucasian [23] but not in Chinese FECD patients [24].
Several genome-wide linkage scans using large multigenera-tional families have reported FECD loci on chromosomes 13 (FCD1), 18 (FCD2), 5 (FCD3), and 9 (FCD4) [23,25–27]. Our own genome-wide linkage scan using affected sibpairs (ASPs) from 21 late-onset FECD families and one large multigenerational family [28] detected five regions of linkage with multipoint LOD scores
.1.5, including the chromosome 1p region nearCOL8A2. Neither our late-onset FECD families nor our large, multigenerational family replicated the four previous FECD loci (FCD1toFCD4), but the number of families used in the study may have been underpowered to detect significant linkage.
The first genome-wide association study (GWAS) for FECD was reported recently, using an initial dataset of 130 unrelated cases and 260 unaffected controls genotyped with the Illumina 370K BeadChip panel [29]. After genotyping their most significant findings in a replication dataset containing 150 cases and 150 controls, Baratz and colleagues concluded that a single nucleotide polymorphism (SNP) on chromosome 18q21, rs613872, in an intron of a gene encoding transcription factor 4 (TCF4, MIM: 602272) showed genome-wide significant association with FECD (P= 1.10x10212
for the initial GWAS dataset;P= 1.79x10213
for the replication dataset;P= 2.34x10226for the combined dataset). Here we present additional evidence for the presence of a FECD locus on chromosome 18. We report the results from an expansion of our previous linkage study, as well as an association study analyzing the association of rs613872 with FECD in a dataset containing 450 unrelated FECD cases and 340 unaffected controls, the largest sample of FECD patients interrogated to date.
Materials and Methods
Ethics Statement
Our study was performed in accordance with the Declaration of Helsinki and the institutional review boards at Duke University Medical Center and Johns Hopkins University (JHU) specifically approved this study. Both FECD study sites, the Cornea Clinics at Duke University Eye Center (DUEC) and the Wilmer Eye Institute at JHU, obtained the appropriate institutional review board approval for research on human subjects prior to initiating subject recruitment, and all individuals gave written, informed consent. The control subjects from the Duke glaucoma genetics study were also recruited under the approval of the Duke Institutional Review Board, and consented to allow their biological samples to be used by other research studies.
Subjects and Families
All FECD subjects underwent detailed ophthalmic examination, including slit lamp biomicroscopy, to determine FECD severity. Grading of disease severity was determined using a slightly modified version of the Krachmer scale classification system [2], which classifies severity on a scale of 0 to 5: (1) grade 0: no central cornea guttae; (2) grade 1: scattered central cornea guttae; (3) grade 2: 1 or 2 mm of central cornea guttae; (4) grade 3: 2 to 5 mm of grouped cornea guttae; (5) grade 4:.5 mm of grouped central cornea guttae; (6) grade 5: cornea guttae with corneal edema. Subjects were classified as affected if grade$2, unaffected if the corneal examination was normal (grade = 0), and unknown if grade 1.
Two Caucasian datasets were used for association and linkage studies. The association dataset consisted of 450 unrelated FECD cases, each with a Krachmer grade $2, and 340 unaffected
controls with age at enrollment of $45 years old. The 450 unrelated cases used here were either probands from the family dataset (see below) or singleton cases, all of whom were ascertained through the cornea clinic at DUEC. The unrelated controls were from 26 unaffected married-in spouses from the DUEC family dataset and 314 control subjects from the glaucoma genetic study at DUEC [30]. Glaucoma control subjects underwent detailed eye examination and had no signs of corneal abnormalities at the time of subject enrollment.
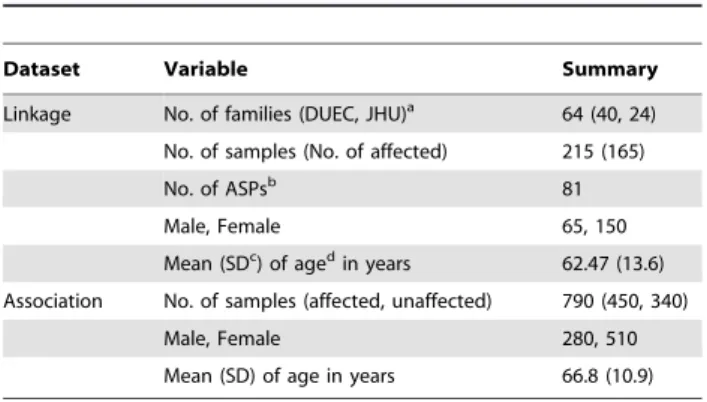
The linkage dataset consisted of 64 multiplex families (at least two affected individuals per family) containing a total of 215 subjects (69.8% females). Families were ascertained independently from the Cornea Clinics at DUEC or at the Wilmer Eye Institute at JHU. Demographic data, including age at enrollment and gender, for the individuals analyzed in the association and linkage datasets are summarized inTable 1.
Marker Selection and Genotyping
Association analysis focused on the SNP rs613872 inTFC4, the most significantly associated SNP in the GWAS performed by Baratz and colleagues [29]. We also genotyped rs10490775 in
PTPRG on chromosome 3, which was significant but not at a genome-wide level in the Baratz GWAS, to examine possible replication in our dataset. The two SNPs were genotyped with pre-designed TaqManH allelic discrimination assays (Life Technolo-gies, formerly Applied Biosystems, Inc., Foster City, CA), which use unlabeled polymerase chain reaction (PCR) primers and two allele-specific probes containing the TaqManH minor groove binding group (MGB) probe and either a FAMTMand VICHdye label in a 384-well plate format. PCR reactions were performed with TaqmanH Universal PCR Master Mix on the GeneAmpH
PCR System 9700 (Applied Biosystems, Inc.), and the ABI 7900HT Fast PCR System (Applied Biosystems, Inc.) was used for reading allelic discrimination calls. Quality control (QC) samples, including two CEPH (Centre d’Etude du Polymorphisme Humain) pedigree individuals, one no-template sample, and two duplicate samples (one male, one female), were contained within each quadrant of each 384-well plate. These QC samples were used to provide duplicate samples within one quadrant, across quadrants within one plate, and across plates. Results of the CEPH and QC sample genotyping were compared to identify possible sample plating errors and genotype-calling
inconsisten-Table 1.Demographic data for individuals analyzed in the linkage and association datasets.
Dataset Variable Summary
Linkage No. of families (DUEC, JHU)a 64 (40, 24)
No. of samples (No. of affected) 215 (165)
No. of ASPsb 81
Male, Female 65, 150
Mean (SDc) of agedin years 62.47 (13.6)
Association No. of samples (affected, unaffected) 790 (450, 340)
Male, Female 280, 510
Mean (SD) of age in years 66.8 (10.9)
aDUEC: Duke University Eye Center; JHU, Johns Hopkins University.
bASPs: affected sibpairs (ASP) count is based on n-1 for n siblings per familycSD:
standard deviation.
dAge: age at the time of study enrollment.
cies, and none were observed. A threshold of 95% genotyping efficiency was required for submission to the analysis database.
Two Illumina (San Diego, CA) SNP linkage panels were used for genome-wide linkage marker genotyping. Seventy-two of the 215 linkage samples were included in our previous linkage study [28], and were genotyped using the Illumina GoldenGate linkage panel IVB, which contains 5,858 SNPs. The remaining 143 samples were genotyped using the Illumina Infinium HumanLink-age-12 platform containing 6,090 SNPs, of which 4,811 overlap with the GoldenGate IVB platform. All genomic DNA samples were prepared at a concentration of 75 ng/mL, in a total volume
of 10mL, and were genotyped in four multiplexed assays according to the manufacturer’s protocols. All DNA samples were extracted from blood using the PureGene system (Gentra Systems, Minneapolis, MN).
Data cleaning for the association dataset
Reproducibility of genotypes was examined for the replicate QC samples located in each 384-well Taqman plate to assess genotyping quality. Reproducibility rates of 100% were observed. The two SNP markers, rs613872 and rs10490775, were examined for possible deviations from Hardy-Weinberg equilibrium (HWE).
Data cleaning for the linkage dataset
We instituted several QC measures to determine the final set of markers for analysis. We first used the Illumina BeadStudio program to check genotype reproducibility rates using the replicated samples, family relationships, gender status of each DNA sample using Y chromosome markers, sample genotype call rates.99%, and the GenCall score which is a quality measure for each genotype used in the Illumina genotyping system. In particular, the GenCall score measures how close a genotype is to the center of the cluster of other samples assigned the same genotype, as compared with the centers of the clusters of the other genotypes, and ranges from 0 to 1. The higher the GenCall score the more reliable the genotype. A set of clean markers was chosen based on GenCall scores$0.15, as well as meeting the other QC measures described previously, for further data cleaning.
For additional data quality assurance, 1000 markers with approximately equal inter-marker distances across the genome were selected to examine family relationships using the RELPAIR [31] and PREST [32] programs. After correcting for family relationship errors, Mendelian inheritance inconsistencies were checked using the PEDCHECK program [33]. Missing genotypes were assigned to the family for those markers with Mendelian inheritance inconsistencies.
All SNPs were tested for deviations from HWE. We randomly chose one affected individual per family to include in an unrelated affected dataset, and one unaffected individual per family was selected to include in an unrelated, unaffected dataset. An exact test implemented in the Genetic Data Analysis (GDA) program was used to test HWE, by performing 3,200 permutations to estimate the empiricalp-value for each marker [34]. We applied a Bonferroni correction (significance threshold = 0.05/total number of markers) to determine significant deviation from HWE. Markers that were out of HWE in the unaffected dataset were excluded in the linkage analysis.
Association Analysis
Genotypes of rs613872 (T and G nucleotide polymorphism) were tested using three genetic models: dominant (DOM), additive (ADD), and recessive (REC). The genotypes of (GG, TG, and TT) were coded as (1, 1, 0) for DOM; (2, 1, 0) for ADD; and (1, 0, 0) for REC where allele G is the rare allele. A logistic regression
association analysis in PLINK [35] was applied with gender as a covariate. We also stratified our association dataset by gender and tested for association of this marker within the males and females. A nominal significance level of 0.05 was applied to declare significant association. The relationship between disease severity (grade level) and genotypes of rs613872 was examined using Fisher Exact test, because some genotype-phenotype has small number of samples, particularly for grade 4.
Linkage analysis
Two-point parametric linkage analyses using the FASTLINK [36] and HOMOG [37] programs (http://linkage.rockefeller. edu/, provided in the public domain by Rockefeller University, New York, NY) were performed to generate heterogeneity logarithm of the odds (HLOD) scores. Since the mode of inheritance is unknown for FECD, both DOM and REC genetic models were assumed in the parametric analysis with disease allele frequencies of 0.001 and 0.01 respectively. The penetrance (chance of an individual being affected if carrying the disease susceptibility genotype) was based on the assumed genetic models, and was consistent with the goal of conducting an affecteds-only parametric linkage analysis.
MERLIN [38] was used to perform both multipoint parametric and non-parametric linkage analyses (NPL). The same DOM and REC models described above were assumed in the MERLIN parametric analysis. It is known that linkage disequilibrium (LD) may inflate the type I error of a multipoint linkage analysis, particularly when parental genotype data are not available—as is the case for most of our families [39]. We set a threshold of the squared Pearson correlation coefficient (r2) between markers at 0.16 in MERLIN to ensure independence between markers for multipoint linkage analysis.
Results
Association results
We tested rs613872 in our case-control association dataset of 450 cases and 340 controls;Table 1summarizes the demographic data of our subjects. We did not observe deviation from HWE in the control group for rs613872 (P= 0.60), indicating high quality genotyping results. However, we found strong deviation from HWE for this marker in the FECD case group (P,0.001). This may be the source of the highly significant association signal we observed in our dataset for all three genetic models (DOM:
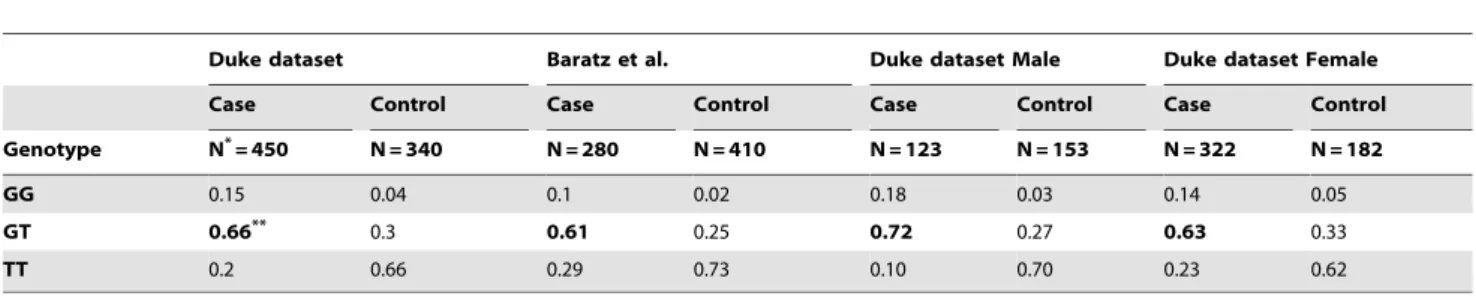
P= 9.33610235; ADD: P= 7.48610230; REC: P= 5.2761026). The effect size of the minor (risk) allele (G) in our dataset was strong: (1) DOM: odds ratio (OR) = 8.01, confidence interval (CI) of OR = (5.80; 11.29); (2) ADD model: OR = 5.35, CI = (4.00; 7.14); (3) REC: OR = 4.06, CI = (2.22; 7.42). These results are consistent with the findings of Baratz and colleagues [29].Table 2 shows the comparison of genotype frequencies between our FECD cases and controls to the genotype frequencies observed in the FECD GWAS cases and controls studied by Baratz and colleagues. Clearly, the FECD case group has excessive hetero-zygous genotypes for rs613872 compared to the controls in both datasets, which is consistent to the observation of deviation from HWE in FECD cases. As for rs10490775 in PTPRG on chromosome 3, we did not detect significant association with FECD (DOMP= 0.98; ADDP= 0.96; RECP= 0.92).
When we examined gender-specific groups, we observed the same elevation of the heterozygous (GT) genotype in cases relative to controls in both genders (Table 2). The SNP rs613872 is still significant in both genders (male P= 3610226; female
level of association due to the small sample size, particularly for males. Furthermore, the results between genders should not be compared due to the unbalanced sample sizes. Among our 450 cases, we have 235 cases with grading information. We did not find the correlation between disease severity and genotypes of rs613872 (P = 0.13). However, more samples may be needed to make a solid conclusion.
Linkage scan samples and markers
After implementing QC measures for the linkage dataset we removed five individuals from three families due to relationship errors that could not be resolved and five individuals due to low sample call rates (,95%). In total, we analyzed 215 individuals in 64 families (Table 1), including 41 ASPs from 64 families, making this the largest dataset used in a genome-wide linkage scan for FECD to date. We noted a high proportion of females in both our linkage and association
datasets, likely because of the known gender imbalance among FECD patients [8].
A total of 7,291 markers were genotyped between the two SNP genotyping platforms, with 4,551 markers overlapping between the two chips. Of those, 4,533 markers met our QC criteria for linkage analyses, which included having a GenCall score$0.15, a genotype call frequency$95%, and no significant deviation from HWE. Eleven markers produced Mendelian inheritance inconsis-tencies within three families and were assigned missing genotypes within those families. In the multipoint analysis using MERLIN, 3,927 markers met our LD criteria and were analyzed.
Linkage regions
Eighteen SNPs on ten chromosomes gave two-point HLOD scores $2 in either the DOM or REC models (Table 3). In particular, three markers produced HLOD scores above 3: rs1889974 (chromosome 10, 119.34 cM, HLOD = 3.37) and Table 2.Comparison of genotype frequencies between Duke dataset and dataset used in Baratz et al. (2010), and between male and female in Duke dataset for rs613872.
Duke dataset Baratz et al. Duke dataset Male Duke dataset Female
Case Control Case Control Case Control Case Control
Genotype N*= 450 N = 340 N = 280 N = 410 N = 123 N = 153 N = 322 N = 182
GG 0.15 0.04 0.1 0.02 0.18 0.03 0.14 0.05
GT 0.66** 0.3 0.61 0.25 0.72 0.27 0.63 0.33
TT 0.2 0.66 0.29 0.73 0.10 0.70 0.23 0.62
*N: total sample size.
**Heterozygous frequencies are elevated in all datasets and are highlighted in bold. doi:10.1371/journal.pone.0018044.t002
Table 3.Markers with HLOD.2 in either dominant (DOM) or recessive (REC) model from the FASTLINK/HOMOG two-point linkage analysis.
Chromosome SNP marker deCODE map (cM) DOM HLOD score REC HLOD score
1 rs726344 52.86 1.57 2.20
1 rs491603 56.95 1.64 2.54
5 rs476569 64.08 1.64 2.02
5 rs1301475 78.25 2.22 0.61
5 rs998876 194.22 2.00 1.59
8 rs2466216 40.75 2.65 0.51
8 rs9797 46.84 2.06 1.37
8 rs1380229 88.89 2.26 0.41
9 rs1407392 113.18 1.14 2.62
9 rs1923433 113.20 1.86 2.34
10 rs1889974 119.34 3.37 1.83
15 rs235512 61.47 3.53 1.84
18 rs4941043 78.82 1.99 3.00
19 rs7937 66.65 0.80 2.19
19 rs893186 110.25 1.30 3.56
20 rs674630 30.36 2.17 1.41
X rs1207480 73.97 1.46 2.70
X rs1990383 166.56 2.08 0.07
rs235512 (chromosome 15, 61.47 cM, HLOD = 3.53) under the DOM model and rs893186 (chromosome 19, 110.25 cM, HLOD = 3.56) under the REC model. Among all markers listed in Table 3, only rs998876 on chromosome 5 (194.22 cM) overlaps with a previously identified FECD linkage locus, FCD3
[27].Table 4summarizes the eight linkage regions that produced peak multipoint LOD scores$1.5 in any of the three multipoint linkage analyses, the nonparametric (NPL) and parametric (DOM and REC) analyses. The boundaries of a linkage region outlined in Table 4are based on the chromosomal interval that covers one LOD score below the peak marker’s LOD score. Two separate regions of linkage were found on chromosomes 16 (28.27– 36.15 cM and 56.82–96.27 cM) and X (59.18–83.83 cM and 98.35–124.34 cM), implying that multiple genes on the same chromosome could be influencing FECD.
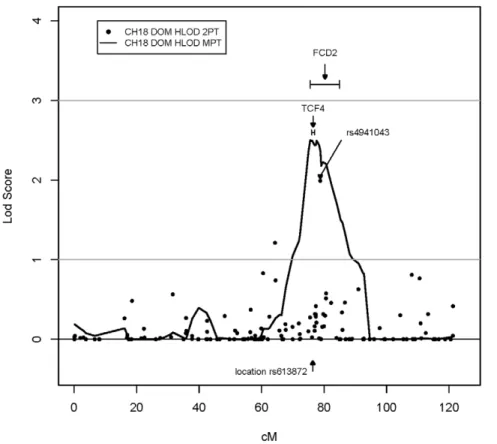
The most promising multipoint linkage region was on chromo-some 18 from 69.94 cM to 85.29 cM with a peak multipoint HLOD = 2.5 at rs1145315 (75.58 cM) under the DOM model. The nonparametric analysis showed consistent results for this region with a peak multipoint HLOD = 1.48 at the same peak marker (Table 4). In addition, rs4941043 within this same interval produced a HLOD score = 1.99 under the two-point DOM model (Table 3). This multipoint linkage peak on chromosome 18 overlaps with theFCD2peak reported by Sundinet al.[26] and with
the most significant GWAS hit, rs613872 in TCF4, reported by Baratzet al.[29] (Figure 1). The SNP rs613872 inTCF4is only 1.4 Mb away from our peak DOM multipoint marker, rs1145315.
Discussion
To date, progress towards identifying the genetic underpinnings of FECD has been limited to a handful of genes, including
COL8A2, SLC4A11, and TCF8 [3,13,20,21,23] that have arisen from candidate gene or genome-wide linkage studies. Linkage scans have additionally identified four genetic loci (FCD1toFCD4) that appear to influence familial FECD [23,25–27]. In spite of these insights, knowledge of the genetic basis of non-familial FECD has remained limited. Recently, Baratz and colleagues identified significant statistical association between a SNP inTCF4
and FECD in the first genome-wide association study carried out for FECD [29]. Their study identified an intronic SNP inTCF4, rs613872, with highly significant allelic and genotypicp-values of 2.34610226 and 1.29610218, respectively, in their combined analysis of their small discovery and replication datasets.
Here, we present a large case-control association dataset that replicates these recent genome-wide association data [29], revealing a highly significant association between rs613872 and FECD with ap -value of 9.33610235(DOM). Additionally, we show that the best
Table 4.Results of the multipoint linkage analysis using MERLIN.
Chr Peak and boundary SNPs deCODE map (cM) NPL (LOD score) DOM (HLOD score) REC (HLOD score)
6 rs1563512 120.96 0.64 0.63 0.00
rs988693 (peak) 127.33 1.29 1.74 0.19
rs1894641 129.27 1.07 1.36 0.28
9 rs4077800 92.50 0.58 0.68 0.37
rs1819730 (peak) 109.99 1.55 1.04 1.16
rs1405 122.92 0.71 0.70 0.02
16 rs887864 28.27 0.25 0.08 1.04
rs734826 (peak) 31.98 0.84 0.39 2.29
rs2384933 36.15 0.73 0.31 1.42
16 rs13143 56.82 0.59 0.14 0.01
rs149156 (peak) 84.70 1.60 1.08 0.19
rs1922604 95.27 0.59 0.41 0.65
18 rs1873191 69.94 0.80 1.05 0.00
rs1145315 (peak) 75.58 1.48 2.50 0.08
rs955427 85.29 0.43 1.50 0.00
19 rs1058511 105.07 0.01 0.00 0.71
rs1542039 (peak) 108.49 0.12 0.00 1.71
rs893179 109.90 0.08 0.00 1.51
X rs2024917 59.18 0.87 0.00 0.68
rs1155699 (peak) 67.14 1.56 0.25 1.37
rs979605 (peak) 67.42 1.56 0.25 1.36
rs1327476 83.83 0.88 0.23 0.05
X rs897918 98.35 0.69 0.24 0.17
rs1558022 (peak) 115.73 1.70 0.56 0.11
rs9856 124.34 0.73 0.85 0.20
Note: All linkage regions with a LOD score.1.5 at the peak marker in at least one of the multipoint analyses, nonparametric (NPL), dominant (DOM), or recessive (REC), are presented. The upper and lower bounds of each linkage peak interval presented were selected based on covering all markers with a LOD or HLOD score within one LOD score unit of the peak marker’s LOD score. The peak LOD scores are indicated withbold text. Chr, chromosome; SNP, single nucleotide polymorphism; LOD, logarithm of the odds; HLOD, heterogeneity logarithm of the odds.
multipoint linkage region from our family dataset is also located on chromosome 18 (68.94 cM to 85.29 cM), with a peak multipoint HLOD = 2.5 at rs1145315, 1.5 Mb away from rs613872 in TCF4. The consistent findings in both our linkage and association studies for an association of rs613872 with FECD together with the findings of Baratzet al. suggest that the association is probably not spurious but, rather, is due to certain recombination events in this region that may increase susceptibility to FECD. Additionally, the excess of heterozy-gous genotypes at rs613872 in both our cases and those of Baratzet al.
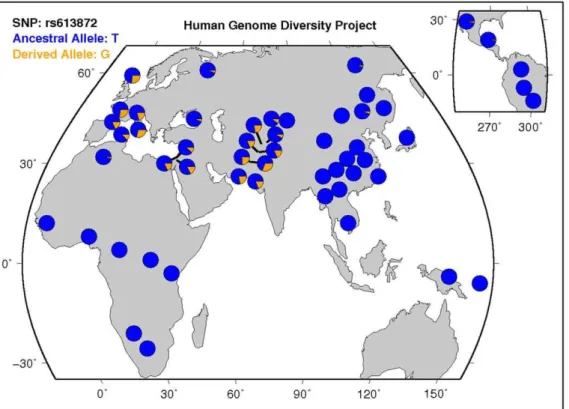
warrants further investigation. Although we replicated the association of rs613872 with FECD in our dataset, we failed to replicate the association with rs10490775 inPTPRG. Since we also did not detect evidence of linkage to chromosome 3, we hypothesize that either this locus does not influence FECD risk or its effect on FECD risk is small. It is of great interest to know if rs613872 genotypes can predict disease severity. Our 235 cases with grading information did not show significant correlation to the genotypes of rs613872, which is consistent to the finding from Riazuddin et al. [40], where 180 cases were used. Although both studies obtained the same observation, the limited sample sizes are the drawback for making a solid conclusion. Many of our early samples were given disease status diagnosis rather than detailed grading information. As our recruitment of FECD cases moving forward, we will be able to increase the number of cases with grading. The disease severity vs. genotypes of any target marker will be able to be evaluated properly. According to data from the Human Genome Diversity Project, the minor (risk) allele, G, of rs613872 is rare to nonexistent in populations from Africa, Eastern Asia, and Central and South
America, yet is more frequent in European, Middle Eastern, and Southern Asian populations (Figure 2, [41]). Given that the FECD cases analyzed by our group and by Baratzet al. are of European descent, it will be important to examine whether the association between rs613872 and FECD risk replicates in other ethnic and racial populations. It is possible that alternativeTCF4
risk alleles may be associated in other ethnic and racial populations, which would argue for this locus being functionally important in FECD pathogenesis. Alternatively, if the true FECD disease variant is in LD with rs613872, a lack of association in other ethnic and racial populations may help explain why the disorder has a lower prevalence in other populations like African, East Asian, and South American populations.
GWAS studies commonly raise the question of how to interpret the biological significance of statistically associated SNPs, which may be located in intronic or intergenic regions with no obvious connection to the disease phenotype. Baratz and colleagues did not find any coding variations within theTCF4gene that might help explain the functional mechanism behind the association of rs613872 with FECD, so clearly further studies are needed to detect such variations if they exist. AlthoughTCF4is an attractive candidate gene within theFCD2locus, much remains unknown. If
TCF4plays a role in familial FECD, further research is needed todiscover the mutation(s) withinTCF4that segregate with disease in families that show evidence of linkage toFCD2. l. Until such a causative mutation(s) is identified, restraint needs to be exercised in not drawing premature conclusions that a causal link between the TCF4 protein and FECD has been identified.
Figure 1. Plot of the top multipoint linkage peak on chromosome 18.SNP markers are plotted along the x-axis by their deCODE map position, and the LOD/HLOD scores for each marker are plotted along the y-axis. The results of the FASTLINK/HOMOG dominant two-point analysis are indicated with black circles, and the results of the MERLIN dominant multipoint analysis are indicated with a black line. The SNP rs4941043 is the peak marker from the two-point analysis (seeTable 3). The location of theFCD2peak (Sundinet al., 2006) and the most significantly associated SNP,
Expression data have indicated thatTCF4 is expressed in eye tissues, particularly in the corneal endothelium [29,42–46], However,Tcf4mutant mice do not appear to contain vision/eye abnormalities as a phenotypic feature [47,48]. Additionally, ENCODE data on the UCSC genome browser [49] (March 2006 assembly) shows that rs613872 is contained within the chromatin immunoprecipitation sequence (ChIP-seq)-purported binding site for two transcription factors,Ini1(SMARCB1) andBrg1(SMARCA4). These are both components of the SWI/SNF chromatin remod-eling complex that is required for transcriptional regulation of genes normally repressed by chromatin [50,51]. Given that TCF4is a transcription factor, it is possible that variation at this site might have an effect on the spatiotemporal expression ofTCF4and, in turn, affect the expression of some of its targets. Further studies are required to investigate the veracity this hypothesis.
Our study provides supporting evidence of a linkage signal to the strong association results of rs613872. This not only further confirms the importance of a locus on chromosome 18 in influencing FECD risk, but also indicates that a causal variant for FECD may be identified within this locus. It is highly possible that rs613872 is tagging a rare variant within this locus that plays a
role in the etiology of FECD. Additional sequencing studies using family datasets that are highly linked to this locus is a potential strategy to identify the biological mechanisms underlying how this locus influences FECD pathogenesis.
Acknowledgments
The authors would like to thank the patients and their family members who generously agreed to participate in these studies, and the Corneal Dystrophy Foundation.
Author Contributions
Conceived and designed the experiments: Y-JL MAM SGG GKK NAA. Performed the experiments: MAM. Analyzed the data: Y-JL JR. Contributed reagents/materials/analysis tools: BZ EB MAH RRA AOE SAR NK JDG. Wrote the paper: Y-JL MAM SGG. Collection and organization of samples and data: BZ EB AOE SAR. Clinical examinations and collection of samples: RRA JDG NAA. Provided control samples for association study: MAH RRA. Provided samples for linkage study: AOE SAR NK JDG. Revised intellectual content of manuscript: JR BZ EB MAH RRA AOE SAR NK JDG GKK NAA.
References
1. Fuchs E (1910) Dystrophia epithelialis corneae. Albrecht von Graefes Arch Klin Exp Ophthalmol 76: 478–508.
2. Krachmer JH, Purcell JJ, Jr., Young CW, Bucher KD (1978) Corneal endothelial dystrophy. A study of 64 families. Arch Ophthalmol 96: 2036–2039. 3. Gottsch JD, Sundin OH, Liu SH, Jun AS, Broman KW, et al. (2005) Inheritance of a novelCOL8A2mutation defines a distinct early-onset subtype of fuchs corneal dystrophy. Invest Ophthalmol Vis Sci 46: 1934–1939.
4. Borboli S, Colby K (2002) Mechanisms of disease: Fuchs’ endothelial dystrophy. Ophthalmol Clin North Am 15: 17–25.
5. Klintworth GK (2009) Corneal dystrophies. Orphanet J Rare Dis 4: 7. 6. Lorenzetti DW, Uotila MH, Parikh N, Kaufman HE (1967) Central cornea
guttata. Incidence in the general population. Am J Ophthalmol 64: 1155–1158. 7. Mannis MJ, Holland EJ, Beck RW, Belin MW, Goldberg MA, et al. (2006) Clinical profile and early surgical complications in the Cornea Donor Study. Cornea 25: 164–170.
8. Afshari NA, Pittard AB, Siddiqui A, Klintworth GK (2006) Clinical study of Fuchs corneal endothelial dystrophy leading to penetrating keratoplasty: a 30-year experience. Arch Ophthalmol 124: 777–780.
Figure 2. Worldwide distribution of the minor (risk) allele, G, of rs613872 inTCF4. Data from the Human Genome Diversity Project, available online through the UCSC genome browser at http://genome.ucsc.edu/trash/hgc/hgdpGeo_rs613872.png. Note the higher prevalence of the risk allele in sample populations from Europe, the Middle East, and Southern Asia and the absence of the risk allele in sample populations from Africa, Eastern Asia, and Central and South America.
9. Cross HE, Maumenee AE, Cantolino SJ (1971) Inheritance of Fuchs’ endothelial dystrophy. Arch Ophthalmol 85: 268–272.
10. Rosenblum P, Stark WJ, Maumenee IH, Hirst LW, Maumenee AE (1980) Hereditary Fuchs’ Dystrophy. Am J Ophthalmol 90: 455–462.
11. Magovern M, Beauchamp GR, McTigue JW, Fine BS, Baumiller RC (1979) Inheritance of Fuchs’ combined dystrophy. Ophthalmology 86: 1897–1923. 12. Chang S, Tuli, S, Azar, D (1998) Corneal dystrophies. In: Traboulsi EI, ed.
Genetic diseases of the eye: a Textbook and Atlas. New York: Oxford University Press.
13. Biswas S, Munier FL, Yardley J, Hart-Holden N, Perveen R, et al. (2001) Missense mutations inCOL8A2, the gene encoding the alpha2 chain of type VIII collagen, cause two forms of corneal endothelial dystrophy. Hum Mol Genet 10: 2415–2423.
14. Liskova P, Prescott Q, Bhattacharya SS, Tuft SJ (2007) British family with early-onset Fuchs’ endothelial corneal dystrophy associated with p.L450W mutation in theCOL8A2gene. Br J Ophthalmol 91: 1717–1718.
15. Mok JW, Kim HS, Joo CK (2009) Q455V mutation inCOL8A2is associated with Fuchs’ corneal dystrophy in Korean patients. Eye (Lond) 23: 895–903. 16. Kobayashi A, Fujiki K, Murakami A, Kato T, Chen LZ, et al. (2004) Analysis of
COL8A2gene mutation in Japanese patients with Fuchs’ endothelial dystrophy and posterior polymorphous dystrophy. Jpn J Ophthalmol 48: 195–198. 17. Aldave AJ, Rayner SA, Salem AK, Yoo GL, Kim BT, et al. (2006) No
pathogenic mutations identified in the COL8A1 and COL8A2 genes in familial Fuchs corneal dystrophy. Invest Ophthalmol Vis Sci 47: 3787–3790. 18. Hemadevi B, Srinivasan M, Arunkumar J, Prajna NV, Sundaresan P (2010)
Genetic analysis of patients with Fuchs endothelial corneal dystrophy in India. BMC Ophthalmol 10: 3.
19. Vithana EN, Morgan P, Sundaresan P, Ebenezer ND, Tan DT, et al. (2006) Mutations in sodium-borate cotransporter SLC4A11 cause recessive congenital hereditary endothelial dystrophy (CHED2). Nat Genet 38: 755–757. 20. Vithana EN, Morgan PE, Ramprasad V, Tan DT, Yong VH, et al. (2008)
SLC4A11mutations in Fuchs endothelial corneal dystrophy. Hum Mol Genet 17: 656–666.
21. Riazuddin SA, Vithana EN, Seet LF, Liu Y, Al-Saif A, et al. (2010) Missense mutations in the sodium borate co-transporterSLC4A11cause late onset Fuchs corneal dystrophy. Hum Mutat.
22. Krafchak CM, Pawar H, Moroi SE, Sugar A, Lichter PR, et al. (2005) Mutations in TCF8 cause posterior polymorphous corneal dystrophy and ectopic expression of COL4A3 by corneal endothelial cells. Am J Hum Genet 77: 694–708.
23. Riazuddin SA, Zaghloul NA, Al-Saif A, Davey L, Diplas BH, et al. (2010) Missense mutations inTCF8cause late-onset Fuchs corneal dystrophy and interact withFCD4on chromosome 9p. Am J Hum Genet 86: 45–53. 24. Mehta JS, Vithana EN, Tan DT, Yong VH, Yam GH, et al. (2008) Analysis of
the posterior polymorphous corneal dystrophy 3 gene, TCF8, in late-onset Fuchs endothelial corneal dystrophy. Invest Ophthalmol Vis Sci 49: 184–188. 25. Sundin OH, Jun AS, Broman KW, Liu SH, Sheehan SE, et al. (2006) Linkage of
late-onset Fuchs corneal dystrophy to a novel locus at 13pTel-13q12.13. Invest Ophthalmol Vis Sci 47: 140–145.
26. Sundin OH, Broman KW, Chang HH, Vito EC, Stark WJ, et al. (2006) A common locus for late-onset Fuchs corneal dystrophy maps to 18q21.2-q21.32. Invest Ophthalmol Vis Sci 47: 3919–3926.
27. Riazuddin SA, Eghrari AO, Al-Saif A, Davey L, Meadows DN, et al. (2009) Linkage of a mild late-onset phenotype of Fuchs corneal dystrophy to a novel locus at 5q33.1-q35.2. Invest Ophthalmol Vis Sci 50: 5667–5671.
28. Afshari NA, Li YJ, Pericak-Vance MA, Gregory S, Klintworth GK (2009) Genome-wide linkage scan in fuchs endothelial corneal dystrophy. Invest Ophthalmol Vis Sci 50: 1093–1097.
29. Baratz KH, Tosakulwong N, Ryu E, Brown WL, Branham K, et al. (2010) E2-2 protein and Fuchs’s corneal dystrophy. N Engl J Med 363: 1016–1024. 30. Liu Y, Liu W, Crooks K, Schmidt S, Allingham RR, et al. (2010) No evidence of
association of heterozygous NTF4 mutations in patients with primary open-angle glaucoma. Am J Hum Genet 86: 498–499; author reply 500.
31. Epstein MP, Duren WL, Boehnke M (2000) Improved inference of relationship for pairs of individuals. Am J Hum Genet 67: 1219–1231.
32. McPeek MS, Sun L (2000) Statistical tests for detection of misspecified relationships by use of genome-screen data. Am J Hum Genet 66: 1076–1094. 33. O’Connell JR, Weeks DE (1998) PedCheck: a program for identification of genotype incompatibilities in linkage analysis. Am J Hum Genet 63: 259–266. 34. Zaykin D, Zhivotovsky L, Weir BS (1995) Exact tests for association between
alleles at arbitrary numbers of loci. Genetica 96: 169–178.
35. Purcell S, Neale B, Todd-Brown K, Thomas L, Ferreira MA, et al. (2007) PLINK: a tool set for whole-genome association and population-based linkage analyses. Am J Hum Genet 81: 559–575.
36. Cottingham RW, Jr., Idury RM, Schaffer AA (1993) Faster sequential genetic linkage computations. Am J Hum Genet 53: 252–263.
37. Ott J (1986) Linkage probability and its approximate confidence interval under possible heterogeneity. Genet Epidemiol Suppl 1: 251–257.
38. Abecasis GR, Cherny SS, Cookson WO, Cardon LR (2002) Merlin—rapid analysis of dense genetic maps using sparse gene flow trees. Nat Genet 30: 97–101.
39. Boyles AL, Scott WK, Martin ER, Schmidt S, Li YJ, et al. (2005) Linkage disequilibrium inflates type I error rates in multipoint linkage analysis when parental genotypes are missing. Hum Hered 59: 220–227.
40. Riazuddin SA, McGlumphy EJ, Yeo WS, Wang J, Katsanis N, et al. (2011) Replication of the TCF4 Intronic Variant in Late-Onset Fuchs Corneal Dystrophy and Evidence of Independence from the FCD2 locus. Invest Ophthalmol Vis Sci.
41. Kent WJ, Sugnet CW, Furey TS, Roskin KM, Pringle TH, et al. (2002) The human genome browser at UCSC. Genome Res 12: 996–1006.
42. Wu C, Orozco C, Boyer J, Leglise M, Goodale J, et al. (2009) BioGPS: an extensible and customizable portal for querying and organizing gene annotation resources. Genome Biol 10: R130.
43. Lattin JE, Schroder K, Su AI, Walker JR, Zhang J, et al. (2008) Expression analysis of G Protein-Coupled Receptors in mouse macrophages. Immunome Res 4: 5.
44. Visel A, Thaller C, Eichele G (2004) GenePaint.org: an atlas of gene expression patterns in the mouse embryo. Nucleic Acids Res 32: D552–556.
45. BioGPS website. San Diego, CA: Genomics Institute of the Novartis Research Foundation.
46. Mouse Genome Database (MGD) at the mouse Genome Informatics website. Bar Harbor, ME: The Jackson Laboratory.
47. Bult CJ, Eppig JT, Kadin JA, Richardson JE, Blake JA (2008) The Mouse Genome Database (MGD): mouse biology and model systems. Nucleic Acids Res 36: D724–728.
48. Mouse Genome Database (MGD) at the mouse Genome Informatics website. Bar Harbor, ME: The Jackson Laboratory.
49. Rosenbloom KR, Dreszer TR, Pheasant M, Barber GP, Meyer LR, et al. (2010) ENCODE whole-genome data in the UCSC Genome Browser. Nucleic Acids Res 38: D620–625.
50. Phelan ML, Sif S, Narlikar GJ, Kingston RE (1999) Reconstitution of a core chromatin remodeling complex from SWI/SNF subunits. Mol Cell 3: 247–253. 51. Kwon CS, Wagner D (2007) Unwinding chromatin for development and