ORIGIN
AL RESEAR
CH
Corresponding address: Shamyr Sulyvan de Castro – Rua José Vilar, 520, ap. 801, Meireles, Fortaleza (CE) – Zip-code: 60125-000 – Phone: (85) 98138-1112 – E-mail: shamyrsulyvan@ gmail.com – Finance source: None – Conlict of interest: Nothing to declare – Presented: Aug. 20, 2016 – Accepted for publication: July 23, 2017 – Since it comprises an ecological study design, with data already available online, this study does not require the approval of the Research Ethics Committee.
Study developed in the Department of Applied Physical Therapy of the Universidade Federal do Triângulo Mineiro (UFTM) – Uberaba (MG), Brazil.
1Physical therapist, Master’s in Physical Education by the Universidade Federal do Triângulo Mineiro (UFTM) – Uberaba (MG), Brazil. 2Physical therapist, Master’s in Health Care by the Universidade Federal do Triângulo Mineiro (UFTM) – Uberaba (MG), Brazil. 3Physical therapist, PhD in Public Health. Assistant professor at the Department of Physical therapy of the Universidade Federal do
Ceará (UFC) – Fortaleza (CE), Brazil.
ABSTRACT | This study aims to describe the proile of public investments in physical therapy and to verify the correlation between these investments and the health insurance coverage rate in major Brazilian regions and Federation units, between 2010 and 2015. Data concerning the approved public investments by region and Federation units according to physical therapy attendance were obtained in the Outpatient Information System of the Uniied Health System, in the website of the Department of Informatics of the Uniied Health System (Datasus). The information corresponding to the health insurance coverage rate was obtained in the Supplementary Health Information sector, available on the National Supplementary Health Agency website. Data were analyzed and the Spearman correlation test was held with a signiicance level of 5.00% to show a correlation between investment distribution and health insurance coverage rate. The mean per capita application in Brazil, in Brazilian Reais, of inancial resources in physical therapy attendances, over the ive years analyzed, was R$ 117.16 (±3.52). Among the regions, and for the same period, the South region presented the highest mean per capita (R$ 129.95±5.30), followed in descending order by the Southeast (R$ 124.22±3.69), Northeast (R$ 118.98±7.53), North (R$ 89.43±3.01), and Midwest (R$ 77.09±6.54) regions. The mean coverage by private health insurance varied from 6.20% (Acre) to 43.35% (São Paulo). Apparently, no correlation
280
exists between private health insurance coverage and public investment in physical therapy services.
Keywords | Physical Therapy Specialty; Supplemental Health, Health Economics; Secondary Care.
RESUMO | Este estudo tem o objetivo de descrever o perfil dos investimentos públicos em fisioterapia e verificar a correlação desses investimentos com a taxa de cobertura de plano de saúde, nas grandes regiões brasileiras e nas unidades de federação, entre 2010 e 2015. Os dados referentes aos investimentos públicos aprovados por região e unidades de federação do país segundo atendimento em fisioterapia foram obtidos no setor de Sistema de Informações Ambulatoriais do Sistema Único de Saúde, no site do Departamento de Informática do Sistema Único de Saúde (Datasus). As informações correspondentes à taxa de cobertura por plano de saúde foram obtidas no setor de Informações de Saúde Suplementar, disponível no site da Agência Nacional de Saúde Suplementar. Os dados foram analisados, e, para verificar a correlação entre a distribuição dos investimentos e a taxa de cobertura por plano de saúde, realizou-se o teste de correlação de Spearman, com nível de significância de 5,00%. A média de aplicação per capita em reais no Brasil de recursos financeiros em atendimentos em fisioterapia ao longo dos cinco anos
Distribution of public investment in physical therapy
and supplementary health coverage in Brazil:
historical series from 2010 to 2015
Distribuição dos investimentos públicos em isioterapia e cobertura da saúde suplementar no
Brasil: série histórica de 2010 a 2015
Distribución de las inversiones públicas en isioterapia y cobertura de la salud suplementaria en
Brasil: serie histórica de 2010 a 2015
foi de R$ 117,16 (±3,52). Dentre as regiões e para o mesmo período, a região Sul apresentou a maior média per capita (R$ 129,95 ± 5,30), seguida em ordem decrescente pelas regiões Sudeste (R$ 124,22±3,69); Nordeste (R$ 118,98±7,53); Norte (R$ 89,43±3,01) e Centro-Oeste (R$ 77,09 ± 6,54). A média de cobertura de plano privado de saúde variou de 6,20% (Acre) a 43,35% (São Paulo). Parece não haver relação entre a cobertura por plano de saúde privado e o investimento público em atendimento em fisioterapia.
Descritores | Fisioterapia; Saúde suplementar; Economia da Saúde; Atenção Secundária à Saúde.
RESUMEN | Este estudio tiene el objetivo de describir el peril de las inversiones públicas en isioterapia y certiicar la correlación de esas inversiones con la tasa de cobertura de seguro de salud, en las grandes regiones brasileñas y en las unidades de federación, entre 2010 y 2015. Los datos referentes a las inversiones públicas aprobadas por región y unidades de federación del país según la atención en isioterapia fueron obtenidos en el sector de Sistema de Informaciones Ambulatorias del Sistema Único de Salud, en el sitio del Departamento de Informática del Sistema Único de
Salud (Datasus). Las informaciones correspondientes a la tasa de cobertura por seguro de salud fueron obtenidas en el sector de Informaciones de Salud Suplementaria, disponible en el sitio de la Agencia Nacional de Salud Suplementaria. Los datos fueron analizados, y, para certiicar la correlación entre la distribución de las inversiones y la tasa de cobertura por seguro de salud, se realizó la prueba de correlación de Spearman, con nivel de signiicancia del 5,00%. Y el promedio de aplicación per cápita en reales en Brasil de ingresos inancieros en atenciones en isioterapia a lo largo de los cinco años fue de R$ 117,16 (± 3,52). De entre las regiones y para el mismo período, la región Sur presentó el promedio más grande per cápita (R$ 129,95 ± 5,30), luego en orden decreciente por las regiones Sudeste (R$ 124,22 ± 3,69); Noreste (R$ 118,98 ± 7,53); Norte (R$ 89,43 ± 3,01) y Centro Oeste (R$ 77,09 ± 6,54). El promedio de cobertura de seguro privado de salud varió del 6,20% (Acre) al 43,35% (São Paulo). Parece no haber relación entre la cobertura por seguro de salud privado y la inversión pública en atención en isioterapia.
Palabras clave | Fisioterapia; Salud Complementaria; Economía de la Salud; Atención Secundaria de Salud.
INTRODUCTION
he Brazilian Uniied Health System (SUS) was regulated in 1990, aiming to guarantee the right to health to citizens and make it a State duty1. he creation of SUS
brought a new proposal, which involves the rupture from an attention model centered on tertiary and secondary attention and on diseases to an integral model, directed to health promotion and disease prevention2. The
epidemiological transition to a predominant proile of non-communicable chronic diseases (NCD) and the population aging due to longevity increase implies in consequent increments in health expenditure, with increased allocation for primary healthcare and prevention actions3.
Another SUS characteristic is the complementarity of the private sector, i.e. private institutions can provide services to SUS patients (1). Currently, the supplementary health presents a national coverage rate of 26% of the population4. Physical therapy, in turn, is the
science that “studies, prevents and treats the functional kinetic disorders intercurrent in organs and systems of the human body, generated by genetic changes, traumas, and acquired diseases; in basic, medium and
high complexity care”5. As the deinition itself shows,
physical therapists can act at all health care levels6. hus,
investments in physical therapy should be the subject of attention to area professionals, public administrators, and the public in general.
he delimitation of investment proile in physical therapy and the veriication of its correlation with the health insurance coverage rate might guide the administration, by ofering a diagnosis of this type of public investment. his information would also be interesting for policies planning and functional health programs. Besides, it would also work for the design of physical and human resources. To physical therapists, an investment proile could be evidence of states or regions where public investment in physical therapy is more stimulated, leading to possibilities of job market insertion. For SUS patients, the information would be useful to prove payment inequalities in physical therapy services, providing solid elements to investment increment claims in appropriated population services.
rate in major Brazilian regions and the Federation units, in the period from 2010 to 2015.
METHODOLOGY
his was an ecological descriptive study, carried out with data from 2010 to 2015. Data relating to approved public investments for physical therapy services, by region and Federation units, were obtained in the Outpatient Information System of the Uniied Health System (SIA/SUS)7. he information corresponding to
the health insurance coverage rate were obtained in the Supplementary Health Information sector, available on the National Supplementary Health Agency (ANS)4
website. Population data were obtained according to the 2010 census and population projections by the Brazilian Institute of Geography and Statistics (IBGE)8.
he information on physical therapy investment were collected in the Information Access tab – TABNET – Healthcare, of the SIA/SUS website. Within the section “Outpatient Production (SIA/ SUS)” the selected option was “Place of residence – from 2008,” and within the section “Geographical Range” the selected option was “Brazil per Region and Federation Unit.” In the section “Line” was selected “Region/Federation Unit”; in the section “Column”, we selected “Procedure subgroup”, and in the option “Content” the “Approved value” was selected. he available period for analysis was from 2010 to 2015. Finally, in the “Available Selections” tab, we opted by the code corresponding to physical therapy (0302), which is under the item “Procedure subgroup.”
Data on health insurance coverage rate was collected on the ANS website, from the tab “Sector Proile – Data and Sector Indicators”. In the item “Beneiciaries of private health plans” we opted for the section “services coverage rate” “Region/State” was selected in the option “Line”; in “Column” we selected “Not active” in the option “Content” “Healthcare” was selected, and in “Available periods” the years between 2010 and 2015 were separately selected. he other items presented in “Available selections” (state, capital, countryside, metropolitan area, region, sex, and age group) remained with the option “All categories” selected.
he mean value spent on each Region and Federation unit was calculated through the division of the total amount spent by the population on each region or Federation unit, then multiplying it by 100.
Data were analyzed and the Spearman correlation test was held with a signiicance level of 5% to establish a correlation between investment distribution and health insurance coverage rate, in conformity with the non-parametric nature of data, which was tested with the Shapiro-Wilk test. For the comparison of means and investment by region and Federation unit, the conidence interval (95%CI) was calculated.
RESULTS
Regarding outpatient production, for the period between 2010 and 2015 there was an allocation of little more than R$ 97 billion. Of this total, 1.45% was destined for physical therapy attendance payments, which corresponds to a gross value of approximately R$ 1.40 billion, distributing R$ 68 million to the Midwest region, R$ 89.50 million to North region, R$ 221 million to South region, R$ 384 million to Northeast region, and R$ 610.50 million to Southeast region.
Over the years, no default behavior was found in the per capita allocation to physical therapy attendances, with reduction to all regions in 2015. he mean per capita application in physical therapy attendances over the period was of R$ 115.98 (± 4.30). Among the regions, and for the same period, the South region presented the highest mean per capita (R$ 130.19 ± 4.78), followed in descending order by the Southeast (R$ 122.63 ± 5.17), Northeast (R$ 116.99 ± 8.33), North (R$ 89.65 ± 2.76) and Midwest (R$ 77.17 ± 5.86) regions (Table 1). A statistical diference of the mean investment per capita was found between Brazil and North, South, and Midwest regions. In the North region, there was diference in the states of Acre, Amazonas, Amapá and Tocantins; within the Northeast region: Maranhão, Piauí, Rio Grande do Norte, Paraíba, Pernambuco, Alagoas, and Sergipe; in the Southeast, the diference was found in the states of Rio de Janeiro and São Paulo; and in the Midwest region there was diference only in the Federal District (Table 1).
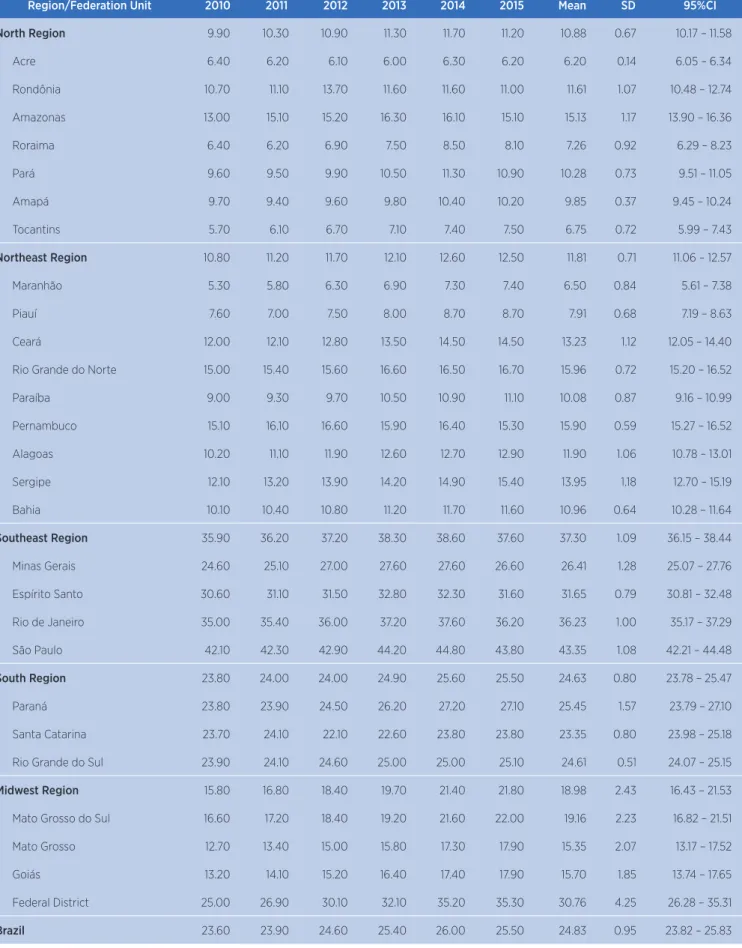
Northeast (11.81±0.71) and North (10.88±0.67), with national mean of 24.83 (±0.95). A signiicant statistical diference can be observed in the distribution percentage between Brazil (25.83 ‒ 23.82) and the Midwest (16.43 ‒ 21.53), Northeast (11.06 ‒ 12.57), North (10.17 ‒ 11.58) and Southeast (36.15 ‒ 38.44) Regions.
When verifying the relation between public investments in physical therapy and private health plan coverage rate in the major Brazilian regions and Federation units (Table 3), we observed a positive correlation for Pará and Goiás (both r = 0.94). On the other hand, Bahia showed a great negative correlation (r = -0.94)
Table 1. Investment distribution (per 100 people), their means, standard deviations, and conidence intervals, in Reais (R$), in physical therapy services in diferent regions and states of the nation, 2010-2015
Region/Federation Unit 2010 2011 2012 2013 2014 2015 Mean SD 95%CI
North Region 87.80 91.38 89.76 85.27 93.08 90.58 89.65 2.76 86.74 – 92.54
Acre 42.48 44.50 42.27 40.07 44.91 38.26 42.08 2.55 39.39 – 44.76 Rondônia 90.08 76.24 67.95 71.74 108.69 113.32 88.00 19.38 67.66 – 108.34 Amazonas 74.83 83.69 74.79 64.82 52.79 56.45 67.89 11.94 55.35 – 80.43 Roraima 313.11 257.91 212.95 64.16 143.66 123.12 185.82 92.35 88.89 – 282.73 Pará 96.35 103.60 109.31 114.20 121.52 117.81 110.47 9.35 100.65 – 120.28 Amapá 32.14 43.23 38.32 42.60 48.66 44.29 41.54 5.67 35.58 – 47.49 Tocantins 48.61 54.53 54.65 49.75 56.65 46.20 51.73 4.11 47.40 – 56.06
Northeast Region 120.99 125.38 126.43 110.35 111.80 106.96 116.99 8.33 108.24 – 125.72
Maranhão 94.43 92.25 98.71 98.41 95.51 98.70 96.34 2.70 93.49 – 99.17 Piauí 138.95 161.51 166.24 175.46 182.53 193.35 169.67 18.87 149.86 – 189.48 Ceará 124.27 123.95 117.26 94.62 96.79 77.95 105.81 18.89 85.98 – 125.62 Rio Grande do Norte 62.44 64.29 65.08 61.36 70.35 67.37 65.15 3.29 61.68 – 68.61 Paraíba 69.82 78.31 80.28 74.46 70.91 59.77 72.26 7.34 68.21 – 78.83 Pernambuco 80.27 84.75 87.78 94.57 102.39 100.44 91.70 8.86 82.39 – 101.00 Alagoas 175.15 203.16 234.00 218.35 220.21 193.81 207.45 21.13 185.26 – 229.63 Sergipe 75.59 77.41 73.42 73.36 79.17 75.18 75.69 2.27 73.99 – 78.15 Bahia 174.66 175.66 170.84 122.82 119.76 120.42 147.36 28.94 116.99 – 177.72
Southeast Region 122.01 128.52 127.97 121.37 121.49 114.42 122.63 5.17 117.19 – 128.02
Minas Gerais 114.39 111.46 108.95 104.49 98.23 91.55 104.85 8.63 95.78 – 113.90 Espírito Santo 101.22 107.32 115.47 81.72 81.03 72.24 93.17 17.19 75.11 – 111.21 Rio de Janeiro 181.47 204.26 203.59 198.49 207.99 196.14 198.66 9.43 188.76 – 208.55 São Paulo 104.37 109.06 108.76 103.91 103.66 98.45 104.70 3.91 100.6 – 108.80
South Region 120.94 131.10 134.97 130.66 132.08 131.38 130.19 4.78 125.16 – 135.20
Paraná 110.84 117.72 120.80 117.57 117.19 118.33 117.07 3.31 113.59 – 120.55 Santa Catarina 115.15 133.58 140.58 126.79 125.64 120.95 127.12 9.01 117.65 – 136.57 Rio Grande do Sul 134.19 142.73 145.57 145.86 150.68 150.65 144.95 6.12 138.52 – 151.36
Midwest Region 86.22 71.54 70.24 77.19 80.36 77.44 77.17 5.86 71.01 – 83.31
Mato Grosso do Sul 83.79 88.51 94.70 87.11 81.12 73.95 84.86 7.06 77.45 – 92.27 Mato Grosso 180.94 103.26 85.64 92.07 86.79 79.20 104.65 38.23 64.52 – 144.77 Goiás 58.74 65.15 71.17 88.29 102.30 100.65 81.05 18.63 61.49 – 100.60 Federal District 40.87 32.93 26.81 25.43 22.25 26.02 29.05 6.75 21.96 – 36.14
Brazil 116.09 120.69 121.04 113.30 114.82 109.95 115.98 4.30 111.46 – 120.50
Table 2. Percentage distribution, means, standard deviations and conidence intervals of private health plan coverage in diferent regions and states of the nation, 2010-2014
Region/Federation Unit 2010 2011 2012 2013 2014 2015 Mean SD 95%CI
North Region 9.90 10.30 10.90 11.30 11.70 11.20 10.88 0.67 10.17 – 11.58
Acre 6.40 6.20 6.10 6.00 6.30 6.20 6.20 0.14 6.05 – 6.34
Rondônia 10.70 11.10 13.70 11.60 11.60 11.00 11.61 1.07 10.48 – 12.74 Amazonas 13.00 15.10 15.20 16.30 16.10 15.10 15.13 1.17 13.90 – 16.36
Roraima 6.40 6.20 6.90 7.50 8.50 8.10 7.26 0.92 6.29 – 8.23
Pará 9.60 9.50 9.90 10.50 11.30 10.90 10.28 0.73 9.51 – 11.05
Amapá 9.70 9.40 9.60 9.80 10.40 10.20 9.85 0.37 9.45 – 10.24
Tocantins 5.70 6.10 6.70 7.10 7.40 7.50 6.75 0.72 5.99 – 7.43
Northeast Region 10.80 11.20 11.70 12.10 12.60 12.50 11.81 0.71 11.06 – 12.57
Maranhão 5.30 5.80 6.30 6.90 7.30 7.40 6.50 0.84 5.61 – 7.38
Piauí 7.60 7.00 7.50 8.00 8.70 8.70 7.91 0.68 7.19 – 8.63
Ceará 12.00 12.10 12.80 13.50 14.50 14.50 13.23 1.12 12.05 – 14.40 Rio Grande do Norte 15.00 15.40 15.60 16.60 16.50 16.70 15.96 0.72 15.20 – 16.52
Paraíba 9.00 9.30 9.70 10.50 10.90 11.10 10.08 0.87 9.16 – 10.99
Pernambuco 15.10 16.10 16.60 15.90 16.40 15.30 15.90 0.59 15.27 – 16.52 Alagoas 10.20 11.10 11.90 12.60 12.70 12.90 11.90 1.06 10.78 – 13.01 Sergipe 12.10 13.20 13.90 14.20 14.90 15.40 13.95 1.18 12.70 – 15.19 Bahia 10.10 10.40 10.80 11.20 11.70 11.60 10.96 0.64 10.28 – 11.64
Southeast Region 35.90 36.20 37.20 38.30 38.60 37.60 37.30 1.09 36.15 – 38.44
Minas Gerais 24.60 25.10 27.00 27.60 27.60 26.60 26.41 1.28 25.07 – 27.76 Espírito Santo 30.60 31.10 31.50 32.80 32.30 31.60 31.65 0.79 30.81 – 32.48 Rio de Janeiro 35.00 35.40 36.00 37.20 37.60 36.20 36.23 1.00 35.17 – 37.29 São Paulo 42.10 42.30 42.90 44.20 44.80 43.80 43.35 1.08 42.21 – 44.48
South Region 23.80 24.00 24.00 24.90 25.60 25.50 24.63 0.80 23.78 – 25.47
Paraná 23.80 23.90 24.50 26.20 27.20 27.10 25.45 1.57 23.79 – 27.10 Santa Catarina 23.70 24.10 22.10 22.60 23.80 23.80 23.35 0.80 23.98 – 25.18 Rio Grande do Sul 23.90 24.10 24.60 25.00 25.00 25.10 24.61 0.51 24.07 – 25.15
Midwest Region 15.80 16.80 18.40 19.70 21.40 21.80 18.98 2.43 16.43 – 21.53
Mato Grosso do Sul 16.60 17.20 18.40 19.20 21.60 22.00 19.16 2.23 16.82 – 21.51 Mato Grosso 12.70 13.40 15.00 15.80 17.30 17.90 15.35 2.07 13.17 – 17.52 Goiás 13.20 14.10 15.20 16.40 17.40 17.90 15.70 1.85 13.74 – 17.65 Federal District 25.00 26.90 30.10 32.10 35.20 35.30 30.76 4.25 26.28 – 35.31
Brazil 23.60 23.90 24.60 25.40 26.00 25.50 24.83 0.95 23.82 – 25.83
Table 3. Correlation between per capita expenditure (per 100 people) with physical therapy and private health plan coverage.
Region/Federation Unit r* p
North Region 0.25 0.622
Acre 0.55 0.257
Rondônia -0.63 0.731
Amazonas -0.55 0.257
Roraima -0.71 0.110
Pará 0.94 0.004
Amapá 0.60 0.208
Tocantins -0.02 0.957
Northeast Region -0.60 0.208
Maranhão 0.77 0.724
Piauí 0.81 0.049
Ceará -0.89 0.014
Rio Grande do Norte 0.31 0.544
Paraíba -0.37 0.480
Pernambuco 0.31 0.544
Alagoas 0.25 0.682
Sergipe -0.08 0.871
Bahia -0.94 0.008
Southeast Region -0.08 0.871
Minas Gerais -0.63 0.173
Espírito Santo -0.54 0.265
Rio de Janeiro 0.25 0.622
São Paulo -0.65 0.156
South Region 0.46 0.354
Paraná 0.14 0.787
Santa Catarina -0.46 0.354
Rio Grande do Sul 0.89 0.014
Midwest Region 0.02 0.975
Mato Grosso do Sul -0.60 0.208
Mato Grosso -0.82 0.041
Goiás 0.94 0.004
Federal District 0.82 0.016
Brazil -0.60 0.208
r*: correlation coeicient calculated with the Spearman test (non-parametric data).
DISCUSSION
Regarding the gross value of SUS outpatient production for physical therapy care payment, between 2010 and 2015, we highlight the Southeast region, notable when compared with the Midwest, which featured the smallest investment transfer. In turn, the mean funding applicationpercapita in physical therapy
over these six years was higher in the South Region and smaller in the Midwest. hese data diverge from another study9 that observed outpatient investments
in physical therapy from 2000 to 2006, obtaining a larger per capita investment in the Northeast Region and the lowest in the North Region. his information may stand for a change in the investment proile of physical therapy treatment at SUS in the last few years. In addition, smaller investments in the Midwest can be justiied by the lower concentration of population in this region when compared with the other. Due to its considerable territorial size, Brazil ofers regional diversities in the demographic and economic scope. his aspect inluences health status and population proile10-12, relecting directly in resources distribution
among regions10,12.
According to Giacomelli et al.13, financing
administration in public health should consider age structure segments and the democratic transition process13.
he Brazilian population has grown over the years, even though we are in a process of population decrease8. Within
the period investigated in our study, physical therapy services investments also increased, but the per capita distribution did not grow at the same pace. Concerning this fact, we should relect if, for this distribution, the diferences between Federation units were considered regarding demographic, epidemiological, social and inance proiles12, to maintain the equity of service ofer.
hat is because the literature points to the maintenance of a historical conduct, in which the inancial resources of the Brazilian public system are based not on the patient necessity, but on service production12,14. hus, a distortion
is generated in health care, since the equity advocated by SUS consists in addressing the population needs instead of the service providers’economic interests13-15.
Besides, another issue to consider about the diferences between the amounts paid to physical therapists in diverse Brazilian regions is the distribution of physical therapists themselves. In the study by Tavares et al.16, a
research on these professionals’ distribution according to the National Register of Health Establishments (CNES)16 was carried out. he results showed that, of a
percentage of professionals was found in capitals and big cities16. he research major conclusion refers to the
investments needed to expand the presence of physical therapy more equitably in all Brazilian regions, and in medium and small size municipalities16. Such indings
corroborate our research results about the discrepancies of values invested in physical therapy care in distinct Brazilian regions. In Tavares et al.16, the South region
presented the highest number of physical therapists per 1,000 inhabitants and the highest amount spent on physical therapy per 100 inhabitants16. Paradoxically, in
our research, the Midwest region presented the smallest amount spent on physical therapy, even being only behind the South and Southeast regions in number of physical therapists per 1,000 inhabitants16. Such a
result can prove that values spent on physical therapy have other determining factors besides professionals’ availability, being, in any case, an indicative of the lack of equity in the distribution of these resources.
On supplementary health, our indings show an increase over the years of private health plans coverage for all Federation units. here was an increase in the number of health plan beneiciaries, perhaps due to economic and employment growth and to the new market rules by health insurance operators17, which
might justify the results found.
heoretically, public investments in health and supplementary health coverage are complementary. hat is, when the public transfer to health increases, the supplementary health coverage decreases18. his
pattern is not conirmed in our research, and there is even contradiction in the results of Pará and Goiás, which presented a positive correlation between per capita expenses with physical therapy and private health insurance coverage. his might be generated by attendance duplication: the same individual being beneited by both supplementary health and SUS17-19.
Furthermore, the population growth in those two states, the implementation of policies, programs and physical resources in health could also explain the results. As an explanatory hypothesis for the data found, there is still the possibility of own resources funding, which is also a current payment mode for health services in our system20.
Our research results show the inequalities of Brazilian regions regarding physical therapy expenditures in SUS, in parallel with the non-linearity of such expenditures on supplementary health coverage in the same six-year period. For health public administrators, these results ofer a more in-depth look on the need for a
more fair and eicient expense distribution in physical therapy, and the complementarity of supplementary health, encouraging the action development in this sense. Physical therapy professionals should beware of such regional diferences, the importance of public expenditure in physical therapy monitoring, and professional union. Overall, for public administrators, physical therapists, area scholars and the population itself, a main point emerges from the research results: the importance of physical therapy actions for the health in Brazil, whether in promotion or disease prevention; and the need to ight for SUS1 universality and equity
principles, seeking to lead, in an equal manner, the entire country and all the Brazilians to physical therapy.
he absence of studies that discuss this content limits a greater scope of discussion. We emphasize the need to encourage new research in this area, given the importance in administrating investments in physical therapy for the planning of policies and functional health programs.
CONCLUSION
Public investments in physical therapy from 2010 to 2015 varied between Brazilian regions and Federation units. he correlation between the health insurance coverage rate and public investments has a distinct behavior, depending on the state studied, showing no consistent correlation pattern between them.
REFERENCES
1. Brasil. Conselho Nacional de Saúde, Lei nº 8080, de 19 de setembro de 1990. Lei orgânica da saúde. Dispõe sobre as condições para promoção, proteção e recuperação da saúde, a organização e o funcionamento dos serviços correspondentes e dá outras providências. Diário Oicial da União [Internet]. 20 set. 1990 [acesso em 16 ago. 2017];Seç. 1:18055. Disponível em: https://goo.gl/gUXEUd 2. Fertonani HP, Pires DEP, Bif D, Scherer MDA. Modelo
assistencial em saúde: conceitos e desaios para a atenção básica brasileira. Ciênc Saúde Coletiva. 2015;20(6):1869-78. doi: 10.1590/1413-81232015206.13272014.
4. Agência Nacional de Saúde Suplementar [Internet]. Rio de Janeiro. ANS Tabnet: informações em saúde suplementar; c2013 [acesso em 16 ago. 2017]. Disponível em: https://goo. gl/B9JAe5
5. Conselho Federal de Fisioterapia e Terapia Ocupacional. Fisioterapia: deinição [Internet]. 2017 [acesso em 16 ago. 2017]. Disponível em: https://goo.gl/yWkfZt
6. Bispo JP Jr. Fisioterapia e saúde coletiva: desaios e novas responsabilidades proissionais. Ciênc Saúde Coletiva. 2010;15(Supl. 1):1627-36. doi: 10.1590/ S1413-81232010000700074.
7. Sia.datasus.gov.br [Internet]. Brasília, DF: Sistema de Informações Ambulatoriais do Sistema Único de Saúde; c1992-2017 [acesso em 16 ago. 2017]. Disponível em: https:// goo.gl/EJ5Dgx
8. Instituto Brasileiro de Geograia e Estatística. Censo 2010 [Internet]. Rio de Janeiro: Instituto Brasileiro de Geograia e Estatística; 2010 [acesso em 16 ago. 2017]. Disponível em: https://goo.gl/kmZP5N
9. Castro SS, Barbosa GR, Aguiar RG. Distribuição do investimento público na assistência isioterapêutica ambulatorial, Brasil, 2000 a 2006. Fisioter Mov. 2013;26(3):639-45. doi: 10.1590/ S0103-51502013000300018.
10. Ministério da Saúde [Internet]. Brasília, DF: Departamento de Informática do Sistema Único de Saúde: Indicadores de mortalidade – taxa de mortalidade especíica por doenças do aparelho circulatório. 2006 [acesso em 16 ago. 2017]. Disponível em: http://bit.ly/2vJ3kVC
11. Villa VM, Aranda MP. The demographic, economic, and health proile of older Latinos: implications for health and long-term care policy and the Latino family. J Health Hum Serv Adm. 2000;23(2):161-80.
12. Mendes Á, Leite MG, Marques RM. Discutindo uma metodologia para a alocação equitativa de recursos federais
para o Sistema Único de Saúde. Saude Soc. 2011;20(3):673-90. doi: 10.1590/S0104-12902011000300013.
13. Giacomelli GS, Chiapinoto FV, Marion PJ Filho, Vieira KM. Transição demográica e gasto público: uma análise comparativa de diferentes contextos. Rev Estudos Soc. 2016;37(18):164-81.
14. Castro SS, Andrade PMO, Stone J. Prevalência de deiciências motoras e sua relação com o gasto federal com próteses, órteses e outros equipamentos nos estados brasileiros em 2010. Fisioter Pesq. 2015;22(3):261-7.
15. Mendes ÁN, Marques RM. Os (des)caminhos do inanciamento do SUS. Saúde Debate. 2003;27(65):389-404.
16. Tavares LRC, Costa JLR, Oishi J, Driusso P.Distribuição territorial de isioterapeutas no Brasil: análise do Cadastro Nacional de Estabelecimentos de Saúde CNES/2010. ConScientiae Saúde,. 2016;15(1):53-61.
17. Castanheira CHC, Pimenta AM, Lana FCF, Malta DC. Utilização de serviços públicos e privados de saúde pela população de Belo Horizonte. Rev Bras Epidemiol. 2014;17(Supl. 1): 256-66. doi: : 10.1590/1809-4503201400050020.
18. Noronha JC, Santos IS, Pereira TR. Relações entre o SUS e a saúde suplementar: problemas e alternativas para o futuro do sistema universal. In: Santor NR, Amarante PDC, organizadores. Gestão pública e relação público privado na saúde. Rio de Janeiro: Cebes; 2010. p. 152-79.
19. Santos IS, Ugá MAD, Porto SM. O mix público-privado no Sistema de Saúde Brasileiro: inanciamento, oferta e utilização de serviços de saúde. Ciên Saúde Coletiva 2008;13(5):1431-40. doi: 10.1590/S1413-81232008000500009.