Gamification in Skills Management
Personal Profile Monitor ingJosé Car los Marques Araújo
Master of I nfor mation Systems for Managemen t
Thesis Advisor:
Acknowledgements
I start by thanking my biggest source of strength and passion: my family. Without them, I could never find the willness, courage and stamina throughout this tough Master Thesis journey. The truth is that there are so many people that I would like to thank for a huge variety of reasons along this Master Thesis journey:
To my SAP colleagues: Khaled Musilhy, my dearest Egyptian friend, for all his trust in my capabilities during the time that we worked together for the MENA region and his very laudatory words, which incentivated me to embrace this new challenge; Simon Anstey, for all his commitment and availability during these 8 years, in addition to his enthusiastic words in the recommendation letter; Michael Depner, my mentor, for all his guidance and wise advises, besides his listening and coaching skills; Andreas Wirth, my Line Manager, for believing in my talent potential and encouraging my behavioral techniques and methods changes, to become a better professional. Last, but not least, Paul Taylor, my trusted research advisor, always available to help with additional material and his valuable help, and patience, on reviewing some texts.
To my UE colleagues: Manuel, Jorge, João and Bruno, for all their friendship and partnership at all times, helping me moving on and achieve my goals. I would also like to thank all the staff of Universidade Europeia for their cooperation, support and understanding, throughout my study years
My grateful appreciation to my enthusiastic advisor, Professor Dr. Gabriel Pestana. I am very grateful for his persistence and guidance, where his knowledge, inspiration and unsurpassed guidance have showed me other perspectives in doing research. His encouragement, patience and care have been invaluable.
Table of Contents
Acknowledgements ... ii
Table of Contents ... iii
List of Figures ...v
List of Tables ... vii
List of Acronyms ... viii
Abstract ... ix
1. Introduction ...1
1.1. Context ...1
1.2. Overview ...2
1.3. Objectives ...3
1.4. Motivations ...4
1.5. Design Science Research Methodology ...9
1.6. Report Organization ... 10
2. State of the art ... 10
2.1. Revised Framework for Design Science Research Activities... 10
2.2. Visual Analytics Framework ... 16
2.3. Talent Management from the Skills perspective ... 21
2.4. Gamification ... 25
3. Skills Management Awareness Model... 29
3.1. The role of Active@Work in Skills Management ... 29
3.2. Workforce Skills Analysis ... 31
3.3. Metadata Info-Structures ... 35
3.3.1. Skills Metadata Management ... 35
3.3.2. Mockups configuration of Metadata ... 39
3.3.3. Domain model ... 45
4. Results ... 50
4.1. Skills Development module ... 50
4.2. Case Study – Active@Work ... 52
4.2.1. List of actors and roles participating in the specified scenarios ... 54
4.2.2. Generic scenarios ... 55
4.3. Case Study – Conceptual Framework to the Mockups Design... 58
5.1. Conclusions ... 60
5.2. Future Challenges ... 61
References ... 62
Annex A – Skills Management Metadata Framework ... 66
Annex B – Skills Development Module Requirements ... 74
Annex C – Skills Development Module Mockups ... 80
Annex D – Skills Development Module Indicators & Metrics ... 84
List of Figures
Figure 1. Decomposition of the population by age-groups (source: European Commission,
2015) ...5
Figure 2. Demographic old-age dependency ratio (65+/(15-64)) (source: European Commission, 2015)...6
Figure 3. Historical participation rates: workers aged 55 to 64 (source: European Commission, 2015) ...7
Figure 4. Share of population aged 55-64 years with education level below upper secondary (source: OECD, 2014) ...8
Figure 5. General Model for Generating and Accumulating Knowledge (source: Owen, 1997) ... 12
Figure 6. DSR Model & Cognitive Processes (adapted from: Dasgupta, 1996; Purao, 2002; Takeda et al., 1990; V. Vaishnavi & Kuechler, 2004) ... 13
Figure 7. Visual Analytics process (source: Daniel A. Keim et al., 2010) ... 17
Figure 8. Mockup of the Personal Skills Dashboard layout ... 32
Figure 9. Mockup of the Personal Skills – Certification layout ... 33
Figure 10. Mockup of the Training Catalogue Dashboard layout... 34
Figure 11. Mockup of the Personal Skills Dashboard Indicators layout ... 36
Figure 12. Mockup of the Personal Skills – Education layout... 38
Figure 13. Skills Management – Metadata configuration interface ... 41
Figure 14. Metadata Configuration - Parameters ... 42
Figure 15. Metadata Configuration - Metrics ... 43
Figure 16. Metadata Configuration - Indicators ... 44
Figure 17. Skills Management domain model using the UML Notation (with Mxxx type classes) ... 47
Figure 18. Skills Management domain model using the UML Notation (with Mxxx and Vxxx type Classes) ... 49
Figure 14. Virtual Assistant Tool Architecture ... 53
Figure 17. Metadata Configuration - Lists... 66
Figure 18. Metadata Configuration – Parameters ... 67
Figure 19. Metadata Configuration – Parameters Expanded ... 68
Figure 22. Metadata Configuration – Metrics Expanded ... 70
Figure 24. Metadata Configuration – Indicators ... 71
Figure 25. Metadata Configuration – Indicator Expanded ... 72
Figure 26. Metadata Configuration – Types of Thresholds ... 73
Figure 22. Mockup of the Staff Profile Dashboard layout ... 80
Figure 23. Mockup of the Staff Profile – Staff Experience Skills layout ... 81
Figure 24. Mockup of the Target Profile Dashboard layout ... 82
Figure 25. Mockup of the Target Profile – Search Results layout ... 83
Figure 32. Skills Management domain model – Phase I ... 95
Figure 33. Skills Management domain model – Phase II ... 96
Figure 34. Skills Management domain model – Phase III ... 97
List of Tables
Table 1. Comparison of DSR Steps According to Literature (source: adapted from Rocha,
Formoso, Tzortzopoulos-Fazenda, Koskela, & Tezel, 2012) ... 11
Table 2. Curriculum Vitae Evaluation - CE (Description, Formula and Example) ... 37
Table 3. Academic Qualifications - AQ (Factor, Weight and Description) ... 39
Table 4. List of components identified for the SDM... 53
Table 5. List of actors identified for the SDM ... 55
Table 6. List of Generic Scenarios ... 55
Table 7. Requirements assigned to the SDM ... 74
Table 8. Curriculum Vitae Evaluation - CE (Description, Formula and Example) ... 84
Table 9. Peer Average - PA (Description, Formula and Example) ... 85
Table 10. Assessment - AS (Description, Formula and Example)... 85
Table 11. Ranking - RK (Description, Formula and Example) ... 86
Table 12. CV Composition - CC (Description, Formula and Example) ... 86
Table 13. Academic Qualifications - AQ (Factor, Weight and Description) ... 87
Table 14. General Professional Experience - GPE (Factor, Weight and Description) ... 88
Table 15. Specific Professional Experience – SPE (Factor, Weight and Description) ... 88
Table 16. General Professional Qualification - GPQ (Factor, Weight and Description) ... 89
Table 17. Specific Professional Qualification - SPQ (Factor, Weight and Description) ... 89
Table 18. Language Qualification - LQ (Factor, Weight and Description) ... 90
Table 19. Endorsements Qualification - EQ (Factor, Weight and Description) ... 90
List of Acronyms
AAL Active and Assisted Living
CV Curriculum Vitae
DSR Design Science Research
DSRM Design Science Research Methodology DSS Decision Support system
EC European Commission
EM Extrinsic Motivation
ERD Entity Relationship Diagram
EU European Union
GPE General Professional Experience GUI Graphical User Interface
HCM Human Capital Management
HR Human Resources
HRMS Human Resource Management System
IA Intelligent Agent
IM Intrinsic motivation
IS Information System
ISCED International Standard Classification of Education ITIL Information Technology Infrastructure Library NIESR National Institute of Economic and Social Research
OECD Organization for Economic Co-operation and Development
PC Personal Computer
PMBOK Project Management Body of Knowledge R&D Research and Development
SDM Skills Development Module
SE Self-esteem
SPE Special Professional Experience
TM Talent Management
UK United Kingdom
UI User Interface
Abstract
Employees are the human capital which, to a great extent, contributes to the success and development of high-performance and sustainable organizations. In a work environment, there is a need to provide a tool for tracking and following-up on each employees' professional progress, while staying aligned with the organization’s strategic and operational goals and objectives.
The research work within this Thesis aims to contribute to improve employees' self-awareness and auto-regulation; two predominant research areas are also studied and analyzed: Visual Analytics and Gamification. The Visual Analytics enables the specification of personalized dashboard interfaces with alerts and indicators to keep employees aware of their skills and to continuously monitor how to improve their expertise, promoting simultaneously behavioral change and adoption of good-practices. The study of Gamification techniques with Talent Management features enabled the design of new processes to engage, motivate, and retain highly productive employees, and to foster a competitive working environment, where employees are encouraged to be involved in new and rewarding activities, where knowledge and experience are recognized as a relevant asset. The Design Science Research was selected as the research methodology; the creation of new knowledge is therefore based on an iterative cycle addressing concepts such as design, analysis, reflection, and abstraction.
By collaborating in an international project (Active@Work), funded by the Active and Assisted Living Programme, the results followed a design thinking approach regarding the specification of the structure and behavior of the Skills Development Module, namely the identification of requirements and the design of an innovative info-structure of metadata to support the user experience. A set of mockups were designed based on the user role and main concerns. Such approach enabled the conceptualization of a solution to proactively assist the management and assessment of skills in a personalized and dynamic way. The outcomes of this Thesis aims to demonstrate the existing articulation between emerging research areas such as Visual Analytics and Gamification, expecting to represent conceptual gains in these two research fields.
1. Introduction
This chapter provides an introduction to the research work performed within the scope of this Master’s Thesis, outlining Gamification and Visual Analytics as the main research areas. The research challenge can be expressed as how to efficiently manage and monitor events using graphical interfaces such as personalized interactive Dashboards, enabling employees to access relevant information and simultaneously to promote self-awareness and auto-regulation. These self-awareness and auto-regulation behaviors are supported by the Skills Development Module (SDM). This module intends to encourage employees to upskill their competencies as well as their career progress, enriching in this way their Curriculum Vitae (CV), matching in a more proficient way the increasing demands of business needs in extremely competitive environments. The section also considers the formulation of the problem to which the work will cope and the main concepts to investigate. Innovative achievements were attained by showing that Gamification and Visual Analytics are correlated and complement each other, based on a methodological approach developed with the knowledge acquired through the study of Design Science Research Methodology (DSRM). Finally, it ends by describing the structure of the document.
1.1. Context
Thus, the existing solutions should provide appropriate skills management recommendations that tap into the specific motivations and needs of each employee, using Gamification techniques to challenge them for competitiveness, or by acquiring new skills/competencies or by investing in career progression as determinants to meet business demands.
The aim to create innovative paradigm-changing solutions and the opportunity to collaborate in the Active@Work project (http://www.activeatwork.eu/), an European Union (EU) funded R&D project with a duration of 30 months starting in December 2015, was strengthened with the interest on research predominant areas such as Visual Analytics, Gamification and Talent Management, combined with the challenge to design an innovative solution for the SDM.
1.2. Overview
The research work within this Thesis consists on the following requirements:
· Define an info-structure of metadata to support dynamic creation of indicators, taking into
consideration the user profile and/or role/function, without any need of intervention from the IT department.
· Develop the SDM solution to maintain employees’ self-conscious and informed about their
assessment and the need for CV adjustments, to meet organizations skills & competencies demands.
· Autonomous management mechanism of CV in a standardized way (another SDM feature),
enabling employees to have information on what are the most valued skills for the organization (through the training catalogue).
strategic and operational goals and objectives 1. Goals and objectives are often used interchangeably, but the main difference comes in their level of concreteness. Objectives are
very concrete, whereas goals are less structured. The solution had to comply with
multi-platform and mobility requirements (e.g., PC, tablets or smartphones), capable to interact with the end-user in a very seamless and personalized way. Usability requirements are therefore a major concern to dynamically adjust interaction and notifications in conformity to the end-user needs.
1.3. Objectives
The SDM intends to provide a contribution to the functionalities to be provided by the Virtual Assistant tool (VAT) that is a core component within the software architecture of the Active@work project. This integration intends to create a highly motivating and rewarding environment that makes it easy for employees to manage and develop their skills, promoting engagement and motivation to fit into organization needs and expectations. Within this context, the SDM addresses the following research areas: Visual Analytics, Gamification and Talent Management.
· Visual Analytics, this interactive technique of information visualization, enables enables
the employee to get access, in real-time and based on metadata characterizing the user profile and/or role/function, to some relevant information through interactive dashboards. These dashboards provide employees a clear perception of their strengths and weaknesses, by means of indicators (e.g. CV Evaluation, ranking and CV composition) and events (alerts, warnings and recommendations) which are dynamically triggered by an Intelligent Agent (IA). Developing self-awareness helps the employees to have the opportunity to make changes in behavior and motivation aspects, which may be extremely important in case the employee's CV (i.e., perceived skills or expertise) start to lose relevance, in an increasing competitive working environment.
· Gamification, by adopting data-driven elements and techniques that game designers use to
engage employees, reward and recognize individuals and keep people motivated to achieve - sometimes extremely - ambitious results, adding value to business and promoting loyalty. Organizations are continuously being challenged to effectively encourage employees to
achieve basic business goals and develop working environments driven by healthy competitive practices. If serious gaming techniques become part of the Organizations' working culture, it will encourage employees to continuously seek to improve their CV. In such working environment, self-awareness can be seen as a way to "play" with alerts and recommendations triggered dynamically by an Intelligent Agent (IA), which motivates employees to constantly invest effort in auto-regulation to improve their performance (e.g., rank classification, career development, encourage ambition and self-achievement).
· Talent Management, by adopting processes designed to engage, motivate and retain highly
productive employees, it is possible to combine Skills Management & monitoring related critical capabilities with information visualization techniques, helping organizations to maximize potential use of Talent Management technology. Through a training catalogue with specific skills offering, employees can search and manifest interest in some training(s) offers or seek for career options. In some cases, a workflow approval is required (e.g., training courses requiring a fee payment), these requests are sent to the employee supervisor for further approval/rejection.
1.4. Motivations
According to a research (Altmann, 2015) requested by the United Kingdom (UK) National Institute of Economic and Social Research (NIESR), if UK workers over 50 y/old were kept for just one more year in the workforce, an extra 1% of UK GDP - £18BN in 2014 – would be generated. In addition, by 2022 the UK will have 700,000 fewer people aged 16-49, but 3,7 million more people aged between 50 and state pension age (Ray Barrell, Kirby, & Orazgani, 2011). But this is not UK specific, according to the HR Consultancy company Mercer, it is expected that “by 2050, the number of people over 65 y/old will triple and the number of those over 80 will quadruple. Some countries will be more affected than others, but the labor force across the world will change: will be older and smaller”2.
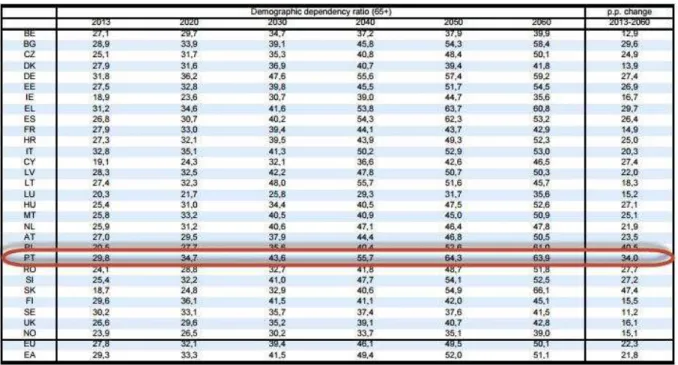
According to the 2015 Ageing Report (European Commission, 2015b), people aged 65+ will become a much larger share (rising from 18% to 28% of the population), and those aged 80+ (rising from 5% to 12%) will almost become as numerous as the young population in 2060, as illustrated in Figure 1. In Portugal, the projection is even higher, since people aged 65+ will
rise from 20% to 35% of the population and those aged 80+ will become more numerous than the young population in 2060 (16% versus 11%).
Figure 1. Decomposition of the population by age-groups(source: European Commission, 2015)
Because of these different trends among age groups, the demographic old-age dependency ratio (people aged 65 or above relative to those aged 15- 64) is projected to increase from 27.8% to 50.1% in the EU as a whole over the projection period (from 2013 to 2060), as illustrated in Figure 2. Demographic old-age dependency ratio (65+/(15-64)) (source: European Commission, 2015). In Portugal, people aged 65+ relative to those aged 15-64 is projected to increase from 29,8% to 63%, significantly above the average projected for the EU in 2060. This implies that the EU would move from having four working-age people for every person aged over 65 years to only two working-age persons.
The expectable impacts of these projections are especially relevant for this Thesis, for two main reasons:
· Foreseeable raise of the retirement age in the mid/long term;
· Greater demand/consciousness for active aging policies (organizations will need to keep
Figure 2. Demographic old-age dependency ratio (65+/(15-64)) (source: European Commission, 2015)
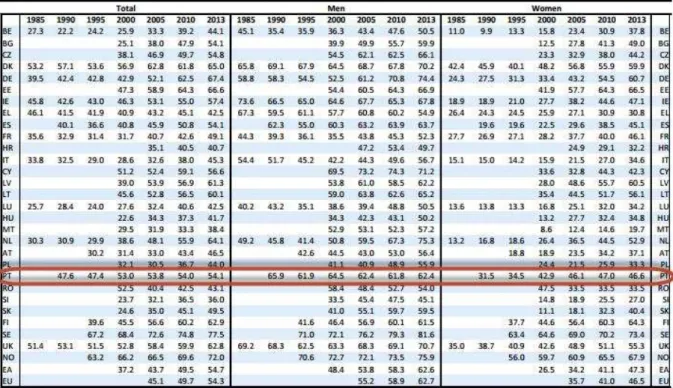
Figure 3. Historical participation rates: workers aged 55 to 64(source: European Commission, 2015)
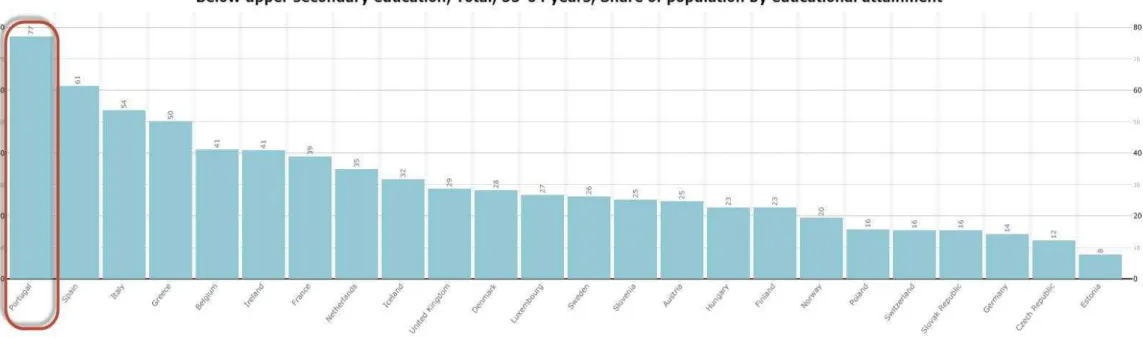
In addition to the aging and demographic challenges and how will this affect the labor force across the world, sustained by the projections from the 2015 Ageing Report illustrated above, it's equally important to evaluate the Education qualifications level, as well as the skills/competencies from these senior employees.
Figure 4. Share of population aged 55-64 years with education level below upper secondary (source: OECD, 2014)
1.5. Design Science Research Methodology
Design science research (DSR) is a set of analytical techniques and perspectives for performing research in Information System (IS). DSR involves the creation of new knowledge through the design of novel and innovative artifacts. It also helps the analysis of such artifacts to improve and understand the behavior of aspects related to Information Systems (Kuechler & Vaishnavi, 2008). A designed artifact is an object with material and/or immaterial characteristics that is designed and created intentionally by one or more human beings, such as algorithms, human/computer interfaces, and system design methodologies or languages.
In the last century, natural sciences almost drove out ‘design’ from professional school curricula in all professions, with the exception of management, computer science and chemical engineering (Simon, 1996). To bring the design activity back to the an intellectual level, (Simon, 1996) makes a clear distinction between “natural science” and “science of the artificial” (design science), where design science is seen as knowledge in the form of constructs, techniques and methods for creating artifacts that satisfy given sets of functional requirements. DSR is the research that creates this type of missing knowledge using design, analysis, reflection, and abstraction.
The main goal of DSR is to develop knowledge that professionals can use to design solutions for their area of research/concern (i.e., a problem domain). This mission can be compared to the one of the ‘explanatory sciences’, like the natural sciences and sociology, which is to develop knowledge to describe, explain and predict (van Aken, 2005). Hevner states that the main purpose of DSR is to achieve knowledge and understanding of a problem domain by building and application of a designed artifact (A. R. Hevner, March, Park, & Ram, 2004).
1.6. Report Organization
This Thesis is structured as follow. The second chapter presents a literature review of the state-of-the-art regarding the three predominant research areas, it analyzes and discusses the information published about the Thesis subject. This chapter introduces the DSR, Visual Analytics Framework, Talent Management from the Skills perspective and Gamification. The third chapter focus on the research challenges, namely how it started, what was achieved and how it can be improved. It details how the research study was conducted, including the theoretical framework reference and assumptions. The forth chapter presents the expected results that support the proposed solution to the identified problem. Finally, the Thesis structure ends with the fifth chapter presenting the main conclusions and a reflection on the results obtained from the research work with some guidelines regarding future work.
2. State of the art
This chapter presents a literature review of the current state-of-the-art, which seeks to gather, analyze and discuss information published around the subjects covered within this Thesis. It provides a theoretical foundation to the research objectives and refers what has already been researched or published in topics similar to the one approached in this Thesis.
2.1. Revised Framework for Design Science Research Activities
Design can be thought of a mapping from function space - a functional requirement constituting a point in this multidimensal space - to attribute space, where an artifact satisfying the mapping constitutes a point in that space (Takeda, Veerkamp, Tomiyama, & Yoshikawa, 1990). Design Science is then knowledge in the form of constructs, techniques and methods for performing this mapping, models, theory - the know-how for creating artifacts that satisfy a given sets of functional requirements. DSR is research that creates this type of missing knowledge using design, analysis, reflection and abstraction.
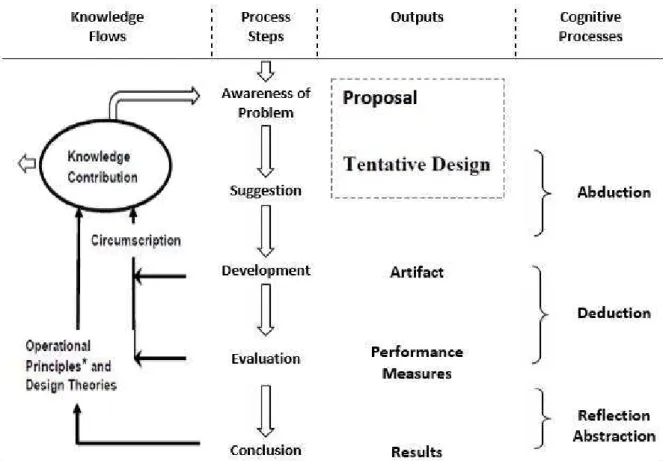
1) EstablishingAwareness of Problem – as highlighted in blue colour;
2) DSR (Development of the Artifacts and Evaluation) – as highlighted in green colour;
3) Theory building/Conclusions – as highlighted in purple colour.
Table 1. Comparison of DSR Steps According to Literature(source: adapted from Rocha, Formoso, Tzortzopoulos-Fazenda, Koskela, & Tezel, 2012)
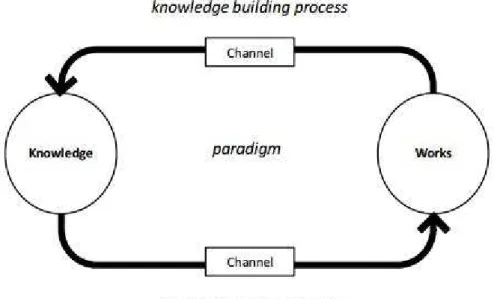
Figure 5. General Model for Generating and Accumulating Knowledge(source: Owen, 1997)
As presented by Qwen, “Knowledge is generated and accumulated through action. Doing something and judging the results is the general model. The process is shown as a cycle in which knowledge is used to create works, and works are evaluated to build knowledge” (Owen, 1997). Indeed, DSR will contribute to the production of new knowledge. In general, it's recommendable to produce a new product using state-of-practice application of techniques and available components. In most cases, product design efforts are preceded by many discussions, alignments and meetings to check out the risks, probability and evaluation of the design effort. The risks identified "we don't know how to do this yet" areas that are precisely the targets of DSR efforts (V. K. Vaishnavi & Kuechler, Jr., 2007).
A typical DSR workflow is summarized in Figure 6. It combines the approach from (Dasgupta, 1996; Purao, 2002; V. Vaishnavi & Kuechler, 2004), which focus on the DSR process model, with the approach from (Takeda et al., 1990), which focus on the Cognitive processes.
inputs or contribute to redesign some services that will also be considered as a relevant information in achieving a better understanding about the problem domain, as well as the identification of stakeholders concerns and interests in the system. A description of the five process steps (Awareness of Problem, Suggestion, Development, Evaluation and Conclusion) are presented in Figure 6.
Figure 6. DSR Model & Cognitive Processes(adapted from: Dasgupta, 1996; Purao, 2002; Takeda et al., 1990; V. Vaishnavi & Kuechler, 2004)
* An operational principle can be defined as “any technique/frame/reference about a class of artifacts or its
characteristics that facilitates creation, manipulation and modification of artifactual forms” (Dasgupta, 1996; Purao,
2002)
· Awareness of the Problem -DSR is often referenced as "Improvement Research" and this
self-awareness and auto-regulation. In addition, and by collaborating in an international project (Active@Work), there is also a strong focus on promoting active aging measures in the workplace, at the same time that improves senior employees’ life quality, due to the lack of innovative paradigm-changing solutions.
· Suggestion - The Suggestion phase follows immediately behind the proposal and it’s
intimately connected with it as the dotted line around Proposal and Tentative Design (the output of the Suggestion phase) indicates. This is an essential creative step wherein new functionality is envisioned based on a novel configuration of either existing or new and existing elements. “Suggestions for a problem solution are abductively drawn from the existing knowledge base for the problem area, which may or not be adequate for the problem identified, depending on possible knowledge gaps” (Peirce, 1931). An attempt is made at creatively solving the problem, based on the existing knowledge. The SDM addressed in this Thesis intends to provide a set of functionalities to create a highly motivating and rewarding environment that makes it easy for employees to manage/develop their skills, promoting engagement and motivation. To achieve it, the proposal is to explore two predominant research areas: Visual Analytics, Gamification and Talent Management. · Development -The Tentative Design is further developed and implemented in this phase.
The techniques for implementation will, of course, vary depending on the artifact to be created, such as algorithms, human/computer interfaces, and system design methodologies or languages. An expert system embodying assumptions about human cognition in emergent areas like the ones described in this Thesis: Gamification and Visual Analytics, will require innovation paradigm-changing solutions, in order to meet business needs. The implementation itself can be very straightforward and may not involve novelty, beyond the state-of-practice for the given artifact. The solution - a tentative design - is used to implement an artifact. Partially or fully successful implementations are then evaluated according to a functional specification during the Evaluation stage. The main objectives of this Thesis are outlined on events management/monitoring through Visual Analytics dynamic/personalized dashboard interfaces, where the generated artifacts corresponds to a set of mockups (see Chapter 3 for more details).
feedback another round of Suggestion (circumscription arrows of the Figure above). This leads to a new design, frequently preceded by new literature research in directions suggested by deviations. In this Thesis, the preliminary mockups were presented as a baseline for discussion with the Active@Work project team members, to check if it satisfies user needs and intended uses. The outcome of these discussions lead to another round of Suggestion, where proposed adjustments to the design were made based on deviations. Development, Evaluation and further Suggestion are frequently iteratively performed in the course of the research effort. The basis of the iteration, the flow from partial completion of the cycle back to the Awareness of Problem, is indicated by the Circumscription arrow. The Circumscription process is especially important to understanding design science research process because it generates understanding that could only be gained from the specific act of construction. Circumscription is a formal logical model method (McCarthy, 1980) that assumes that every fragment of knowledge is valid only in certain situations. Discovering that things don't work "according to theory" is part of the DSR learning process. This is part of the incomplete nature of any knowledge base and it contributes with valuable constraint knowledge to the understanding of the "always incomplete theories" that abductively motivated the original research.
The credibility of the research findings is an important aspect of any research work success and is influenced with the appropriate selection of research methodology. Research methodology is the overall approach to be used in the research work process from the theoretical foundations of the research object to the collection and analysis of the data. In this context, DSRM has been presented and justified as the research methodology adopted for this Thesis using design, analysis, reflection and abstraction for achieving a better understanding about the problem scope, environment and in the identification of stakeholders concerns and interests in the system. A typical DSR workflow, which combines the DSR process model-focus with the Cognitive process-focus can be defined in five process steps (Awareness of Problem, Suggestion, Development, Evaluation and Conclusion), the same approach was followed in the specification and development of the SDM in this Thesis.
2.2. Visual Analytics Framework
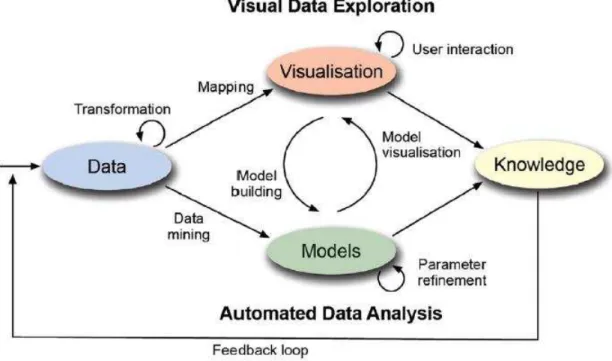
Visual analytics is an emerging research discipline that intends to ensure the best possible use of enormous loads of information in a wide variety of applications by combining typical methods of Business Intelligence with the visual perception and analysis capabilities of the human user.
Figure 7. Visual Analytics process(source: Daniel A. Keim et al., 2010)
The guiding principle of the visual analytic framework is to visually explore the information based on “Overview first, zoom/filter, details on demand”, (Shneiderman, 1996) describes how data should be presented on screen. In this Thesis, information is perceived as basic (or source) data complemented with spatio-temporal context information characterizing the basic data, eventually with additional characterization aspects related to the user profile and/or role/function (generically defined as metadata). With massive datasets at hand, it is extremely difficult to get an overview visualization without losing relevant patterns, which makes filtering techniques useless, taking in consideration the little amount of information given to users to examine further.
In many application scenarios, heterogeneous data sources need to be integrated before visual or automatic analysis methods can be applied (e.g., data cleaning, normalisation, grouping, integration). Therefore, the first step is often to preprocess and transform the data to derive different representations for further exploration (as indicated by the Transformation arrow in Figure 7).
analyst with the automated methods, to modify the settings or choosing other algorithms. The goal is to refine and assess the appropriateness of the knowledge generated when implementing the selected models.
Overall, this process intends to speed up the generation of knowledge, through the analysis of data according to its value and interest (semantic context), highlighting the most relevant aspects of data, while providing models of interaction which allows the user to get more details about data, in their process of search and understanding of data. The Visual Analytics framework includes a set of concepts, all essential for effective analysis (D. Keim et al., 2008), the ones considered as the most relevant for this Thesis are:
· Visualization – this is a core concept that can be classified as "Scientific Visualization"
(Friendly, 2009) when it refers to abstract data visualization where there is the need to infer spatio-temporal context (e.g., numbers and alphanumeric data with timestamps and georeferenced data). A visual analytics approach, with spatio-temporal regions, to forecast hotspots is presented in (Maciejewski et al., 2011). A typical interactive spatio-temporal visualization system is also presented in BirdVis (Ferreira et al., 2011) with geographic data views to understand bird populations. The capability to interact with this information is extremely important and, as such, different approaches using automatic data analysis techniques such as clustering or size reduction have been studied.
· Data Analysis (also known as Data Mining or Knowledge Discovery)- the inclusion of
the concept of data analysis in this paradigm is due to the need for automatic extraction of knowledge from raw data and streamline the entire Visual Analytics process. There are several approaches to the development of computational methods that automatically analyze and extract useful information. The supervised learning approach requires a data sample so that the solution can "learn" from there and use, for example, deterministic and probabilistic algorithms, decision trees and neural networks. The unsupervised approach requires no prior knowledge of information, meaning that data are automatically grouped based on similarity criteria. The clustering algorithms are an example of a technique used in this approach.
· Data Management - Efficient management of data from different sources of information
databases capable of storing and cataloging all types of received data (numeric, text, audio , video, semi-structured data, semantic representations, etc.). Some approaches using data fusion techniques have been used in order to automate this process (Naumann & Bleiholder, 2006). The use of data management techniques, based on intelligent methods of data analysis and visualization techniques, optimize the entire process of data acquisition and storage.
· Data analysis Space-Time - the Visual Analytics process should also consider the
existence of spatial data (e.g., geographic measures, GPS data) and temporal data (information normally varies with time). Finding or establishing relationships between these two data types brings challenges (Andrienko et al., 2007) both in terms of the complexity of the scales as the level of uncertainty associated with the often incomplete information collection and acquired at different times.
· Human Perception and Cognition - this Visual Analytics element is associated with the
human aspect in the analysis of the data. While perception is the ability of humans to interpret what surrounds it (i.e., the reported information), cognition is the ability to understand what the visualization means and make inferences based on prior apprenticeship. Effective Visual Analytics-based system should be provided with Dashboard type interfaces, to optimize human-machine interactions (Sears & Jacko, 2007).
The Visual Analytics process combines methods of visual and automated analysis through interactive visual interfaces (e.g., Interactive Dashboards), synergistically combined with database operations and computational processing. Dashboards are a particular type of Decision Support Systems (Arnott & Pervan, 2005) and can be defined as “a visual and interactive performance management tool that displays on a single screen the most relevant information to address individuals and/or organizational goals, allowing the user to identify, explore, and communicate problem areas that need corrective action” (Yigitbasioglu & Velcu, 2012).
objectives. In this Thesis, the approach to the concept of interactive and personalized Dashboards advocated in the SDM was designed to incorporate the following concepts:
· Self-Awareness, capacity of introspection and the ability to recognize where the employee
currently is, in comparison with his peers, objectives and commitments. Through building self-awareness, the employee will have a clearer understanding of the areas of behaviour that he needs to manage more effectively. In this Thesis, this self-awareness culture, supported by the SDM, is promoted by addressing employees' needs to access relevant information, encouraging them to career development and progress, enriching their CV to match the increasing business needs of an extremely competitive employment environment. · Auto-Regulation, compliance with goals and inference deviations from the objectives and
commitments. In this area, the incorporation of progress monitoring techniques, combined with Gamification techniques, presents additional stimulus in overcoming the challenges. In this Thesis, the analysis of auto-regulation in collaborative environments brings incentives resulting from teamwork, mutual support and share of experiences, possibly complemented with mentoring actions by more experienced colleagues (e.g., senior employees) or upper rated in the ranking. The visibility and risk exposure triggered by events (e.g., certification is about to expire, employee interests in the current position or where the employee plans to move in the short / medium term) according to the user model (e.g., user profile and/or role/function) tend to monitor the adoption of desired behaviors and therefore an overall improvement of the results.
· Data analytics, science of examining raw data with the purpose of extracting knowledge
from that information. In this Thesis, the analysis of raw data, according to its value and interest (context), is key to support the user's decision process. The SDM is a Decision Support System (DSS), intended to help decision makers (i.e. employees), by providing them all the relevant information, regarding the actions that must be performed. The timestamp data reported, together with the information representation of data (e.g., context and semantics) define the metadata info-structure of support to the data characterization/business model.
and Cognition (via Self-Awareness and Auto-Regulation). Through intuitive interactive/personalized Dashboards, most relevant information is displayed according to different perspectives of different analysis and levels of granularity, enabling it to be used by different users and allowing them to identify, explore, and communicate problem areas that need corrective action, in order to achieve one or several individual and/or organizational goals.
2.3. Talent Management from the Skills perspective
Talent management (TM) is the science of using strategic human resource planning to improve business value and to make it possible for companies and organizations to reach their goals. Everything done to recruit, retain, develop, reward, engage and make people perform forms a part of talent management as well as strategic workforce planning. A talent-management strategy needs to link to business strategy to make sense.
For supporting an organization's need to plan, attract, retain, develop, reward and engage talent, an integrated set of applications is required. Such applications include workforce planning, talent acquisition/onboarding, performance appraisal/assessment, goal management, learning management, competency management, and career development, among others. These functional components align with the key human capital management (HCM) processes of plan to source, acquire to onboard, perform to reward and assess to develop. A further boost to the TM market is offered with functionalities to improve workforce engagement and collaboration, as well as to provide greater analysis and even predictive insights to improve decision making around workforce actions.
According to “Critical Capabilities for Talent Management Suites” report (Gartner, 2015), “providers of TM solutions are aggressively adding new features to keep up with demand for workforce effectiveness in the digital workplace, but offerings still vary significantly”. For this reason, “HR leaders should focus on a product's critical capabilities when evaluating the evolving vendor landscape”.
In this Thesis, from these seven critical capabilities presented in this report, the most relevant ones, from a Skills Management & monitoring perspective, are: Onboarding, Performance and Goals, Learning Management, Career and Succession and Reporting and Analytics Tools, which are described below.
· Onboarding, bridges the gap between candidates and employees. Involves form and task
completion, integration to a core Human Resource Management System (HRMS) for hiring process management, integrated talent processes and support newcomers in their first working day - "Day 1". In this domain, what is addressed in this Thesis is that senior employees can take part on the Onboarding process. The reason for this is that the experience and the knowledge of the organization culture detained by senior employees are valuable assets to be shared with newcomers. Such approach would provide a relevant role for older employees to be involved in onboarding tasks of new employees, providing at the same time a strong message of recognition where their knowledge and experience are considered as important information to share.
· Performance and Goals, tools to align the workforce with organization and team strategic
and operational goals and objectives, establish individual and team goals, evaluate performance, and provide periodic feedback. Performance appraisals, goal management, competency/skill assessments, development planning, and manager and peer feedback are common elements. In this Thesis, the Visual Analytics Dashboards are defined as a visual and interactive performance management tool that displays on a single screen, by means of indicators, the most relevant information needed to achieve one or several individual and/or organizational goals, allowing the user to identify, explore, and identify which areas require the user attention and action.
· Learning Management, includes tools to develop, offer and track learning, create/manage
content, manage skills and competency development, and engage in multimodal learning (e.g., class, video, mobile, offline, social, and discussions). In this Thesis, it's described an interactive training environment (Training Catalogue), which enables the employee to enroll in the advised training offers, increasing their skills, abilities and the overall CV Evaluation, in order to stay aligned with the organization’s strategic and operational goals and objectives.
· Career and Succession, how employees and organizations can together build career and
review/assessment, and impact analysis. In this Thesis, the Visual Analytics Dashboards enables visibility and risk exposure triggered by events (e.g., certification is about to expire) and provides specific skills trainings and career options (e.g., employee interests in the current position or where the employee plans to move in the short / medium term) according to the user model (e.g., user profile and/or role/function), in order to increase employees' skills and abilities and carry out their responsibilities into the company.
· Reporting and Analytics Tools, this value is the average product satisfaction rating from
customer reference feedback on the full range of reporting and analytic tools, including standard reports, ad hoc report tools, metrics dashboards, and embedded analytics in business application processes or predictive analytics. In this Thesis, through Visual Analytics Dashboard interfaces alert mechanisms and indicators, employees are enabled to perform a monitoring progress of their skills and performance, promoting an immediate behavioral change and adoption of best-practices.
This Critical Capabilities report analysis differentiates each vendor's solution based on the four most common use cases for TM, where the importance of specific functionality depends of the business context.
· Attract and Retain Talent - Organizations embracing a TM approach prioritize
Recruiting/onboarding, performance/goals management, career/succession management and learning management over other criteria. In this use case, organizations focus on attracting, evaluating and selecting candidates for available openings, reinforcing their employment brand with a smooth and effective onboarding, and retaining top performers with a broad set of performance management, talent review and career development processes. Organizations embracing this use case tend to be growing within their market segments and/or expanding into other segments and geographies.
The SDM addressed in this Thesis follows a similar approach, it also intends to stimulate the user interest in improving his/her skills and to keep the user engaged, informed and motivated to keep using the SDM. The main goal is to help organizations to retain their most productive and talented employees. The combination of these functionalities with Gamification techniques like reputation and recognition induction, will foster a healthy competitiveness and create high-performance and sustainable organizations that meets their strategic and operational goals and objectives.
· Develop the Workforce - Organizations embracing a TM approach prioritize learning
other criteria. In this case, the focus is on improving and measuring the capabilities of the employee, not only for enhanced worker performance in current positions, but also to fit with other roles or even job opportunities. These organizations career promotions tend to be from inside (as opposed from outside recruitment), this is a typical recognition of the value of long-term workers as opposed to sort-terms workers who easily leave the organization in the first opportunity they find attractive. As a result, providing personalized learning plans and measure employees’ learning effectiveness are top priorities.
Through the combination of Gamification and information visualization mechanisms and indicators, the SDM addressed in this Thesis intends to keep employees aware about their skills and performance and encourage them to upskill their competencies and invest on career progress. These new skills can be selected through dynamic events triggered by an IA and based on metadata from the user profile and/or role/function, or via a training catalogue which has an enormous and diverse skills offering, where employees can search and submit their skill(s) request(s). Based on the reported interests, career ambition or role needs, the system is able to provide recommendations regarding which soft and hard skills are more adjusted to the employee interests, in order to increase employees' skills and abilities and carry out their responsibilities into the company.
· Pay for Performance - Organizations embracing a TM approach prioritize performance/goals management, and compensation planning functionality, trying to strengthen the link between workforce pay and performance. In this use case, organizations focus on attempting to strengthen the link between perceived performance and the various forms of compensation (base pay, bonuses, incentives and equities, for example) paid to workers by deploying such processes as goals management, robust performance appraisal, and comprehensive compensation planning.
· High-Volume Talent Management -Organizations embracing a TM approach are in
high-volume/high-turnover industries and stress efficient recruiting/onboarding, performance/goals management and learning management over other criteria. In this use case, organizations tend to employ large numbers of workers (often hourly/low-level salaried) in substantively similar roles, and the focus is on maintaining headcount levels by hiring and deploying workers as quickly and efficiently as possible. A straightforward and effective assessment of the employee's ability to meet current job responsibilities is key, with a short-term learning focus on getting staff trained quickly and ready for immediate and next roles.
The SDM addressed in this Thesis intends to improve and strengthen employee skills. In order to provide adaptive and personalized learning plans and recommendations, it will be necessary the combination of immersive advanced learning capabilities in order to obtain highly personalized learning experiences. This is particularly true for key learning indicators and indicators about the employee skilled level. Machine learning techniques and algorithms can help improve the quality of the diagnostic information presented by TM, in order to provide recommendations more adjusted to the profile / role of each user.
The “Critical Capabilities for Talent Management Suites” report (Gartner, 2015), demonstrates that Critical Capabilities analysis differentiates the appropriateness of each vendor's solution based on the four most common use cases for TM. In this Thesis, the incorporation of TM will explore the combination of information visualization techniques with Skills Management & monitoring related critical capabilities like Onboarding, Performance and Goals, Learning Management, Career and Succession and Reporting and Analytics Tools against the most common use cases for TM like Attract and Retain Talent, Develop the Workforce, Pay for Performance and High-Volume Talent Management. Thus, the SDM addressed in this Thesis, by adopting processes designed to engage, motivate, and retain highly productive employees, intends to help organizations to maximize potential use of TM technology, creating a high-performance and sustainable working environment that meets their strategic and operational goals and objectives.
2.4. Gamification
therefore a consensual definition has not yet been agreed on. One of the definitions that found widespread acceptance defines Gamification as the use of game-thinking and game mechanics in non-game contexts in order to engage users and solve problems (Huotari & Hamari, 2012).
Another relevant definition for Enterprise Gamification, as an empathy-based process of introducing, transforming and operating a service with affordances for gameful experiences to teach, engage, entertain, and measure to support players’ overall value creation for indirectly supporting an entity’s overall value creation (Herger, 2014).
In simple terms, it is a fun, outcome-based process of using “game” elements techniques that game designers use to engage employees, reward and recognize individuals and keep people motivated to achieve - sometimes extremely - ambitious results, adding value to business and promoting loyalty. Organizations continuously encourage employees to achieve business goals and are challenged to promote working environments driven by healthy competitive practices. Using gaming techniques (e.g. scoring, rewards, badges, etc.) can encourage employees to constantly invest effort to improve their performance (e.g. rank classification, career development, encourage ambition and self -achievement) and stay aligned with the organization’s strategic and operational goals and objectives. This is seen as a powerful 21st century way of stoking the competitive nature of human beings — particularly millennials (i.e., a person reaching young adulthood around the year 2000) who have grown up in a digital world where gaming is often the rule not the exception (Senthil Rajamarthandan, 2015).
To properly leverage Gamification, organizations must first understand basic game mechanics that successfully engage employees. A company willing to explore and apply Gamification activities should start by identifying ways to encourage participants to achieve key goals — and those goals should be aligned with the organization’s strategic and operational goals and objectives. Gamification can be adopted by organizations for internal (workforce) or external (customers and/or partners) initiatives. In this thesis, the focus will be on internal initiatives.
transparency; rewards and recognition are rarely given to participants who consistently exceeds expectations across all dimensions throughout the year.
Organizations need to change their working mindset and establish small wins, with intermediate milestones and guidelines to master new skills, keeping employees motivated to continuously contribute to add value to business, meaning to be a valuable asset to the organization. To increase competitive advantage, the organization should adopt tools to enable employees to earn rewards and respect/recognition within their peer groups, as well as to monitoring their skills and compere each competency with the ones required by the organization or detained by the peer group or even by relevant competitors. The key is to create competition in a scalable and automated way that can be used to drive repeatable results in a sustainable manner. Driving competition, cooperation, networking and knowledge-sharing among employees is critical to achieve short and long-term organization’s strategic and operational goals and objectives.
Under this Thesis, motivation, challenges and competitiveness are seen as key elements for the construction of a successful organizational network, eager to interact with the tools to recognize their added value and above all to become promoters in using the SDM. This strategy is based on the principle that motivation is a key pillar to retain and attract employees. Building trust in relationships increases retention, engagement and rewarding of these employees, gradually creates a motivated community committed to success factors relevant to both the employee and the organization. In the literature it is possible to find two driving forces: intrinsic motivation related to inner strength (Mekler, Brühlmann, Tuch, & Opwis, 2015) and extrinsic motivation related to the surrounding context (i.e., with external factors).
· Intrinsic motivation (IM) drives behaviors that result in internal rewards, like enjoyment,
positive feelings and happiness. With increasing IM, people have a genuine desire for the activity, leading to an increase of their self-esteem (SE), and therefore a greater propensity to complete tasks, predisposal to cooperate and eagerness to learn. As a consequence, significant improvements in the process of learning / using the SDM leads to a deeper understanding and the creation of fitness. In other words, greater willingness to look at the SDM as a personal tool set for themselves without third-party interference, addressing their concerns, needs and interests.
· Extrinsic Motivation (EM) involves doing something for its external rewards, like money
implementation of a particular activity or adoption of a new technology (i.e. a typical behavior of resistance to change). In this scenario, the introduction of reward mechanisms can promote behavior change by encouraging / challenging the user. These rewards should be allocated for compensation of progress and should be directly linked to the performance of a specific behavior. In the context of the SDM, employees may not enjoy learning new competencies, yet they are motivated to continue doing so because of the possibility of something tangible (e.g., monetary compensation, promotion) at the end of the process.
Gamification uses an approach based on empathy (with origins in Interaction Design and DSR), introducing concepts built on observation of the experiences, needs and preferences of the users. It provides a search process for determining an appropriate solution for a given problem, for a number of iterative cycles over which the solution is incrementally refined, ultimately resulting in a successful implementation and improving the human-machine interface. In the scope of the SDM, the following Gamification techniques were analyzed and considered to be applied within the Active@Work project:
· Merit & Leadership Board - an emerging practice in the prospective organizations to
assign leaderboards in different areas of knowledge. The presence in the top-performers board will be a diffusion mechanism of leadership and mastery of assigned functions and goals (over)achieved. The connection to an organizational networks represents a leverage to create competition through levels of excellence and will contribute to the enhancement of the CV.
· Levels and Reputation (Scoring & Ranking) - techniques that induce feelings of pride,
professionalism and therefore of greater responsibility in the user-subscribed challenges. These techniques stimulate commitments in terms of engagement and involvement of the user in his career progress, to improve its ranking in order to match or exceed those with a rating better and therefore to a better position in the league table (i.e., ranking).
· Competition - this technique intends to stimulate behaviors of healthy competition,
promoting group dynamics and therefore stimulate cooperation between employees or employees' groups. In a pragmatic approach, this technique is used to describe a situation in which success is measured in terms of results.
· Points (Point System) - common technique in loyalty systems, it intends to incorporate
In this Thesis, the incorporation of Gamification will explore paradigms based on game theory and take advantage of technological advances to benefit employees and organizations. Thus, the SDM will make use of concepts like Merit Boards (via Assessments), Levels & Reputation (via Scoring & Ranking) for, through a Skills Management interface (see section 3.3.2 for more details) using data analysis techniques expressed in indicators (i.e. Dashboards type interfaces), provide information to the employee regarding their skills, recognition of their efforts, stimulating competition and motivation to improve their CV.
3. Skills Management Awareness Model
This chapter describes how the research challenges were conducted, including the research work related to theoretical frameworks and assumptions. The chapter also provides a description to the assessment of the suitability of the proposed method, reliability of the expected outcomes and validity of the model flexibility and applicability to other TM domains. The proposed solution for the problem identified in Chapter 1 is also presented.
3.1. The role of Active@Work in Skills Management
The theoretical framework associated to the research work that supports this Thesis aims to contribute to improve employees' self-awareness and auto-regulation, through the specification of the SDM, a software component that is part of the overall architecture of the Active@Work project (see chapter 4 for more details). In this Thesis, two predominant research areas are object of great interest: Visual Analytics and Gamification. The Visual Analytics provided the theoretical foundation to specify personalized dashboard interfaces with a set of indicators defined in an innovative way. Based on an info-structure, each indicator can be specified dynamically by the business user at run time without requiring the intervention of any programmer. Associated to each indicator a set of thresholds will trigger notifications whenever those thresholds are exceeded keeping the user aware whenever their intervention is required.
motivation for auto-regulation, in order to keep the CV aligned with the expertise required or valorized by the organization, benefiting both parts.
Through the combination of Gamification techniques with Talent Management, processes designed to engage, motivate, and retain highly productive employees were adopted, to foster a sustainable and competitive working environment, where employees are encouraged to develop new skills or invest in career options. The SDM addressed in this Thesis provides a way to assist employees in keeping their CV aligned with what is required from the employer point-of-view as well as from an academic or professional perspective keeping the employee aware about recommendation to improve the skills level so that the CV assessment is kept at higher rates.
Within the scope of the Active@Work project, the management of employees skills is foreseen as a critical requirement in promoting a healthy but competitive and demanding work environment where each employee is encourage to continuously improve his/her knowledge and expertise. This effort is publically recognized by the organization through the adoption of a solution with the capabilities defined for the SDM. Such approach is particularly adjusted in the area of Consulting and IT Service Delivery (White-collar workers3) with a focus on promoting active aging initiatives in the workplace. By encouraging senior employees to share their valuable skills and expertise with less experienced employees or newcomers, the theoretical foundation is to keep them motivated, increasing at the same time team spirit. The Active@Work architecture consists on the following modules (see Chapter 4 for more details): · A Cognitive module, this module is responsible to represent the conditions of the work
environment providing a catalogue of services to assist the user in their daily work, avoiding critical clinical situations (i.e., surveillance of clinical parameters by periodically collecting data from wearable bio-sensors and by analyzing data related to the quality of the work space environment, data collected through environmental sensors), assuring in this way workers well-being at the work environment;
· A Collaborative module, to promote active participations and interactions between
employees, sharing of experiences amongst senior and younger employees. Provide a collaborative environment to endorse innovative ideas as well as the establishment of mentoring services;
· ASkills Development module, intends to provide support for the employees to engage in
new and rewarding activities, where senior employee’s knowledge and expertise can be an important asset. The major goal of this module is to provide a user-friendly environment for employees to manage/develop their skills within the organization. This is the module addressed in this Thesis.
3.2. Workforce Skills Analysis
In the scope of the SDM, the Visual Analytics Framework provides a combination of automated analysis techniques with interactive techniques of information visualization. The objective aims to enhance comprehension of large data sets (i.e., Big Data) for analysis through interactive visual interfaces (i.e., Dynamic Dashboards). The incorporation of Gamification techniques will explore paradigms based on game theory and take advantage of technological advances to benefit employees. The objective aims to make use of techniques like Merit Boards (i.e., Assessments), Levels & Reputation (i.e., Scoring & Ranking) and Points (i.e., CV Evaluation) to provide relevant information to the employee regarding their skills through data analysis techniques expressed in indicators. The articulation of these scientific research areas intends to improve employees’ self-awareness and auto-regulation:
· Self-Awareness, the interactive/dynamic Dashboard interfaces are presented as a
Figure 8. Mockup of the Personal Skills Dashboard layout
By accessing this relevant information, by means of alert mechanisms and indicators, the interface capabilities of the Personal Skills Dashboard enables employees to promote changes in their behavior, which may be extremely important in cases where the employee's CV may lose significant relevancy (e.g., acknowledged competencies versus required skills for the current position), in an increasing competitive working environment. The Skills Management interface (see section 3.3.2 for more details) enables the business user to configure the most relevant indicators, according to the organization’s strategic and operational goals and objectives.
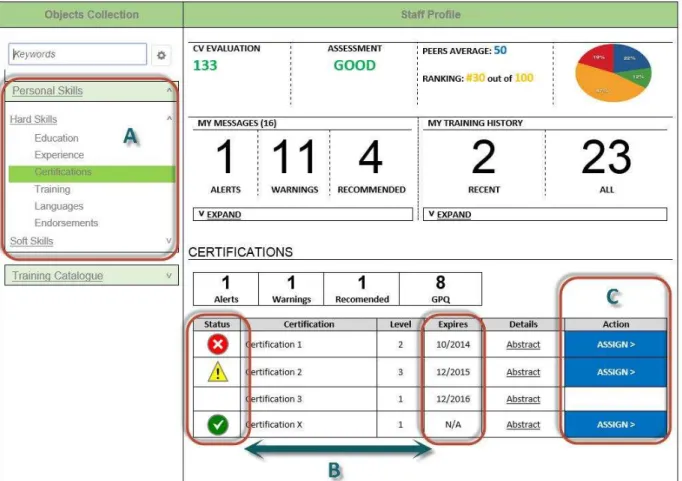
Figure 9. Mockup of the Personal Skills – Certification layout
As presented in Figure 9, the interface is composed by two sections: header and detail. In the header section, the employee can check the messages (alerts, warnings and recommendations) triggered by an IA, based on the information available in the detail section, where the employee can monitor the status (error, warning or recommendation) of each certification or expand the heather to check for addition details. In addition, and whenever there is a Skill with status "Alert" or "Recommendation" (status "Warning" is optional) the button "ASSIGN" is shown/activated, enabling the user to trigger an action. In the mockup presented in Figure 9, by pushing the "ASSIGN" button, it will trigger a workflow that submits a request to renew a certification (in case of status "Alert"), or to get a certification (in case of status "Recommendation"). In some cases (normally when the subscription of the training action has a cost/payment fee), a workflow approval is required, these requests are sent to the employee supervisor for further approval/rejection.
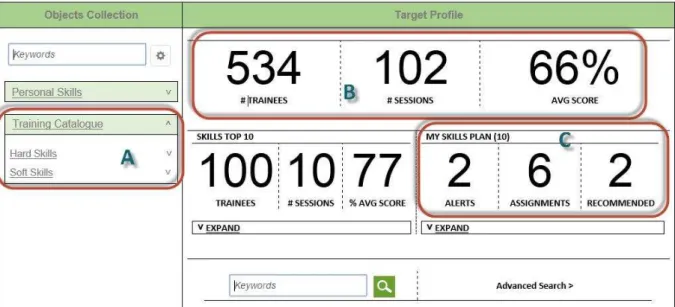
with this, to increase the corresponding overall CV Evaluation indicator. Figure 10 provides an overview of the employees’ Training Catalogue Dashboard - the section mapped with the A letter. This graphical interface presents the information structured into sections to streamline and enable the reading of the information in an eye-blink. For instance, the section mapped with the B letter, provides information related to indicators such as: total number of trainees, total number of sessions and average score for the attended trainings. The section mapped with the C letter, provides information related to “My Skills Plan” area, where the employee can check, per Skill Type (e.g., Hard Skills) and Category (e.g., Certifications) and with different levels of relevance – Alerts, Assignments and Recommendations - the list of Training sessions already scheduled and assigned to his/her name (Alerts), the list of Training sessions approved by the business user (Assignments), or the list of Training sessions dynamically recommended by the SDM, based on the user profile and/or role/function.
Figure 10. Mockup of the Training Catalogue Dashboard layout
The dynamic/personalized Training Catalogue Dashboard interfaces enables employees to access the information of the most requested training offers, and choose the skills training offers that most contributes for enriching their CV according to current business needs.
more efficiently classify and organize information, as well as to yield deeper insight into the actions taking place across the organization, providing more intelligence and higher quality information to fuel big data initiatives, automation, compliance, data sharing and collaboration.
3.3. Metadata Info-Structures
Metadata is "data that provides information about other data"4. While the metadata application is manifold covering a large variety of fields, there are specialised and well-accepted
models to specify types of metadata. These can be distinguished between three distinct types:
Descriptive, Structural and Administrative (“Understanding Metadata,” 2004). Descriptive
metadata describes a resource for purposes such as discovery and identification. It can include
elements such as title, abstract, author and keywords. Structural metadata is used to characterize
the structure of database objects such as tables, columns, keyword (from a business point of
view) and indexes. Administrative metadata provides information to help manage a resource,
such as when and how it was created, file type and other technical information.
The SDM addressed in this Thesis is aligned with a solution based on structural and
descriptive metadata, which allows a business user to dynamically characterize the data
structure of the objects used by the software components of the proposed solution (e.g., Personal
Skills, Training Catalogue and the corresponding Dashboards), composed by indicators with
different types of assessment. This approach provides a full flexibility, enabling business user
to maintain the structure of attributes that characterize each of the parameters available on the system, in addition to complete flexibility in configuring the layout (i.e., dynamic specification
of descriptive attributes) according to their information needs, without any intervention from
the IT department.
3.3.1.Skills Metadata Management
The maintenance of the structure of attributes that characterize each of the parameters available on the system needs to be kept up-to-date and an appropriate approach for managing metadata needs to be set. In this Thesis the management of Metadata corresponds to an end-to-end process and governance framework for creating, controlling, enhancing, attributing, defining and managing a metadata schema, model or other structured aggregation system, either
independently or within a repository and the associated supporting processes (often to enable the management of content).
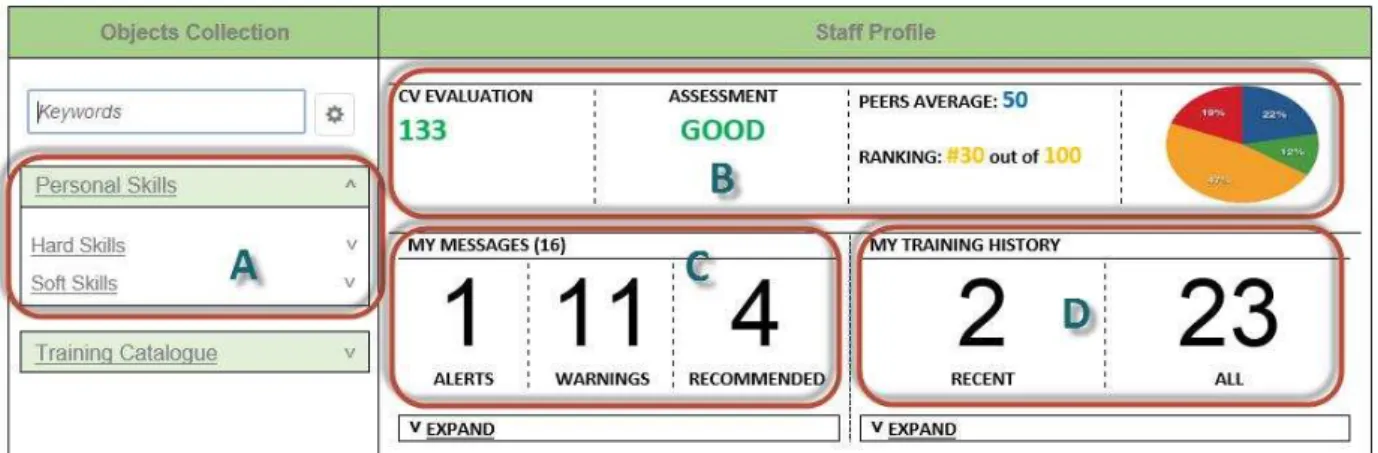
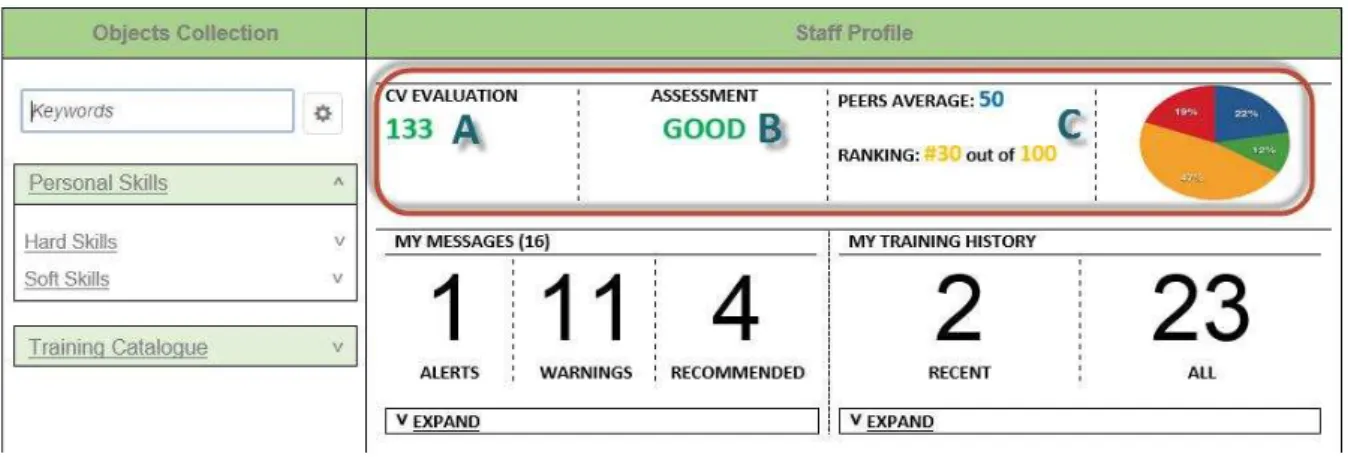
In the SDM, the Personal Skills Dashboard illustrated in Figure 11 presents a set of indicators providing measurements related to skills monitoring from different perspectives, structured into sections to streamline and assist the reading of the information. For instance, the indicator “CV Evaluation” is represented in the section mapped with the A letter, the indicator “Assessment” is represented in the section mapped with the B letter and the indicators “Peers Average”, “Ranking” position and “CV composition” are represented in the section mapped with the C letter.
Figure 11. Mockup of the Personal Skills Dashboard Indicators layout
The values of each indicator are fed through Gamification techniques. For instance, the value 133 shown for the indicator “CV Evaluation”, expressed as CE for simplification, is obtained through a quantitative calculation of all the employee Hard & Soft Skills metrics, by a means of a formula defined by the business user. This means that, the more skills/competencies the employee has, the higher the “CE” indicator value will be. The complete expression of the CE formula is presented in Table 2.