*Correspondence: M. D. Malesuik. Faculdade de Farmácia, Universidade Federal do Pampa - UNIPAMPA, BR 472 – Km 592, Caixa Postal 118, 97500-970 - Uruguaiana – RS, Brasil. E-mail: [email protected]
A
vol. 51, n. 1, jan./mar., 2015 http://dx.doi.org/10.1590/S1984-82502015000100022
Stability-indicating liquid chromatographic and UV
spectrophotometric methods for the quantification of ciprofibrate
in capsules and tablets
Fernanda Macke Hellwig, Rafael Henrique Dias Reis, Suzana Del Rosso Barbosa, Marcelo Donadel
Malesuik
*School of Pharmacy, Federal University of Pampa, UNIPAMPA, Uruguaiana, RS, Brazil
This study describes the development and evaluation of stability-indicating liquid chromatographic (LC) and UV spectrophotometric methods for the quantiication of ciproibrate (CPF) in tablets and capsules. Isocratic LC separation was achieved on a RP18 column using a mobile phase of o-phosphoric acid (0.1% v/v), adjusted to pH 3.0 with triethylamine (10% v/v) and acetonitrile (35:65 v/v), with a low rate of 1.0 mL min-1. Detection was achieved with a photodiode array detector at 233 nm. For the spectrophotometric analysis, ethanol and water were used as the solvent and a wavelength of 233 nm was selected for the detection. The methods were validated according to International Conference on Harmonization (ICH) guidelines for validating analytical procedures. Statistical analysis showed no signiicant difference between the results obtained by the two methods. The proposed methods were successfully applied to the CPF quality-control analysis of tablets and capsules.
Uniterms: Ciprofibrate/tablets/quality control. Ciprofibrate/capsules/quality control. UV Spectrophotometry/quantitative analysis. Liquid chromatography/stability study. Medicines/quality control.
Este estudo descreve o desenvolvimento e avaliação de método indicativo da estabilidade por cromatograia líquida (LC) e método por espectrofotometria UV para quantiicação de ciproibrato (CPF) em comprimidos e cápsulas. No método por cromatograia líquida as análises foram realizadas isocraticamente em coluna de fase reversa C18, utilizando fase móvel composta por ácido o-fosfórico (0.1% v/v) pH 3.0, ajustado com trietilamina (10% v/v), e acetonitrila (35:65 v/v), com luxo de 1,0 mL min-1. A detecção foi realizada em detector de arranjo de diodos a 233 nm. Na análise espectrofotométrica, etanol e água foram utilizados como solventes e o comprimento de onda de 233 nm foi selecionado para a detecção do fármaco. Os métodos foram validados de acordo com as diretrizes do International Conference on Harmonization (ICH). A análise estatística não mostrou diferença signiicativa entre os resultados obtidos pelos dois métodos. Os métodos foram aplicados com sucesso para análises de controle de qualidade do ciproibrato em comprimidos e cápsulas.
Unitermos: Ciproibrato/comprimidos/controle de qualidade. Ciproibrato/cápsulas/controle de qualidade. Espectrofotometria UV/análise quantitativa. Cromatograia líquida/estudo da estabilidade. Medicamentos/ controle de qualidade.
INTRODUCTION
Ciprofibrate (CPF, Figure 1) is a hypolipidemic drug that is widely used to treat hypertriglyceridemia.
Its chemical name is 2-(4-(2,2-dichlorocyclopropyl) phenoxy)-2-methylpropanoic acid and its mechanism of
action is based on the activation of speciic transcription
CPF is commercially available as both tablets and capsules (100 mg). An official method for the determination of this drug in oral formulations has not yet been described. Publications concerning the quantitative detection of CPF are relatively limited. However, there are
studies describing the quantiication of this drug in bulk
and tablet forms by UV and visible spectrophotometry (Nascimento et al., 2011),high-performance thin-layer chromatography (HPTLC) (Jain et al., 2011) and LC– UV (Jain et al., 2012); LC/MS/MS has also been used to quantify CPF in human plasma (Mendes et al., 2011). Several of these methods present methodologies based on techniques with high sensitivity and accuracy, but they require the use of hazardous and expensive chemicals, which make the process not only dangerous for the environment but also complex and time consuming. Moreover, there are no publications concerning UV spectrophotometric or stability-indicating LC methods for
the quantiication of CPF in capsules and tablets, and there
is also no comparison study of the two methods.
The aim of this study was to develop and validate a simple stability-indicating LC method and a simple, fast and environmentally friendly UV spectrophotometric method for routine CPF analysis in tablets and capsules. The results obtained by these methods were statistically compared using two one-sided test (TOST). In addition, the reliability and feasibility of the results were evaluated, focusing on routine quality-control analysis.
MATERIAL AND METHODS
Chemicals and reagents
The CPF reference substance (Purity Grade Standards, Durham, USA) was kindly provided by Multilab (São Jerônimo, Brazil). The pharmaceutical formulations, capsules and tablets containing CPF were obtained commercially. The tabletswere labelled as containing 100 mg of CPF and the following inactive ingredients: starch, microcrystalline cellulose, silicon dioxide, hypromellose, lactose monohydrate, sodium
lauryl sulfate, hydrogenated vegetable oil and puriied
water. The capsuleswere labelled as containing 100 mg of CPF and the following inactive ingredients: magnesium stearate, silicon dioxide, microcrystalline cellulose and starch.
LC-grade acetonitrile was purchased from J. T. Baker (USA) and analytical-grade ethanol was obtained from Fmaia (Brazil). All of the chemicals used were of pharmaceutical or analytical grade. All aqueous solutions
were prepared with puriied water, obtained using Milli-Q
apparatus (Millipore®).
LC method
Development
The chromatographic conditions were optimised so
that the performance of the assay was high. In order to ind
the most appropriate mobile phase for CPF determination, different solvent mixtures were analysed. Acetonitrile and methanol are organic solvents commonly used in LC; therefore, various mixtures of acetonitrile, methanol, water and o-phosphoric acid (0.1% v/v) were tested. Before mixing with an organic solvent, the pH value of the o-phosphoric acid was checked over the range pH 2.0–5.0. Different ratios of organic and aqueous phases were used to obtain the best analysis time and system suitability parameters. System suitability testing of the chromatographic system was performed before each
validation run using ive replicate injections of a standard
solution. The number of theoretical plates, tailing factor, and injection repeatability were determined.
Instrumentation and conditions
The LC system consisted of a Shimadzu® instrument equipped with a diode array detector (DAD). The separation was performed using a Shimadzu® Shim-pack CLS-ODS (M) column (250 mm x 4.6 mm, internal diameter: 5 μm) at room temperature, eluted at the low rate of 1.0 mL min-1 with an injection volume of 20 μL, using an isocratic system. The mobile phase consisted of
o-phosphoric acid (0.1% v/v) that was adjusted to pH 3.0 using triethylamine (10% v/v) and acetonitrile (35:65 v/v). The detection of CPF was achieved with a photodiode
array detector at 233 nm. The mobile phase was iltered
through a 0.45 µm-thick nylon ilter and degassed in an ultrasonic bath before use. The data obtained showed that the mobile phase was stable for at least 48 h when stored
in a closed lask at room temperature.
Calibration solutions
A CPF stock solution with a concentration of FIGURE 1 - Chemical structure of CPF (European Pharmacopeia
500 μg mL-1 was prepared in a volumetric flask by dissolving the CPF reference substance (12.5 mg) in ethanol (10 mL) and making it up to a volume of 25 mL
with puriied water. Aliquots of 1, 1.5, 2, 2.5 and 3 mL were transferred to several volumetric lasks and diluted with puriied water to produce inal concentrations of 10, 15, 20, 25 and 30 μg mL-1.
Sample preparation solutions
The average weight of 20 tablets and 20 capsules was determined according to the Farmacopeia Brasileira (2010). The tablets were crushed to form a homogeneous powder and the contents of the capsules were homogenised. An accurately weighed amount of powder, equivalent to
12.5 mg CPF, was transferred to a 25 mL volumetric lask,
extracted with ethanol (10 mL), sonicated for 5 min, and diluted to the 25 mL mark by adding water. An aliquot of this solution (2 mL) was transferred into a 50 mL
volumetric lask, which was diluted with water to give a inal concentration of 20 μg mL-1. The solutions were iltered through a 0.45 μm-thick nylon ilter before LC
analysis.
UV spectrophotometric method
Development
Different solvent media were investigated to develop a suitable UV spectrophotometric method for the analysis of CPF in formulations. In order to select the appropriate media, various criteria were used, including sensitivity of the method, ease of sample preparation, solubility of the drug, time consumption and cost of the solvents. The concentration and absorbance of CPF in the selected medium at the associated wavelengths were also determined.
Instrumentation and conditions
Spectral and absorbance measurements were performed on a Perkin Elmer Lambda 35 UV/Vis spectrophotometer, using quartz cells with a 1.0 cm path length and detection at 233 nm.
Calibration solutions
A CPF stock solution with a concentration of 400 μg mL-1 was prepared in a volumetric flask by dissolving the CPF reference substance (10 mg) in ethanol (10 mL) and making it up to a volume of 25 mL with
puriied water. Aliquots of 1, 1.5, 2, 2.5 and 3 mL were transferred to several volumetric lasks and diluted with puriied water to produce inal concentrations of 8, 12, 16,
20 and 24 μg mL-1.
Sample preparation for the solutions
The average weight of 20 tablets and 20 capsules was determined according to the Farmacopeia Brasileira (2010). The tablets were crushed to form a homogeneous powder and the contents of the capsules were homogenised. An accurately weighed amount of powder, equivalent to
10 mg CPF, was transferred to a 25 mL volumetric lask,
extracted with ethanol (10 mL), sonicated for 5 min, and
diluted to the 25 mL mark by adding water. After iltration,
an aliquot (2 mL) of this solution was transferred into a
50 mL volumetric lask and diluted with water to give a inal concentration of 16 μg mL-1.
Method validation
The developed stability-indicating LC and UV spectrophotometric analytical methods were validated following ICH guidelines and USP requirements (International Conference on Harmonization, 2005; United States Pharmacopeia, 2012).
Linearity
The linearity was evaluated by linear regression analysis, which was calculated using the least-square regression method. The calibration curves were obtained
with ive concentrations for LC (10-30 μg mL-1) and UV methods (8-24 μg mL-1).
Specificity
The UV method was performed by preparing placebo solutions (an in-house mixture of tablet and capsules excipients) of the commercial products. In a separate study, a CPF reference substance with the same concentration was prepared and analysed. Each of the solutions was scanned from a wavelength of 400 to 200 nm, and any interference in the absorbance was checked at all tested wavelengths.
In order to establish if the proposed LC method was in fact stability indicating, the pure CPF active pharmaceutical ingredient was stressed under different conditions as part of the forced degradation studies (Bakshi, Singh, 2002).
and neutralised. An aliquot of each solution was diluted
with water to give a inal concentration of 20 µg mL -1. The stress degradation study with direct UV radiation (254 nm) was performed by exposing the CPF solution in acetonitrile (1 mg mL-1) to the UV beam for 1.5 h at room temperature in a photostability chamber containing mirrors (Malesuik et al., 2009; Garcia et al., 2008). The distance between the lamp and the sample was 10 cm. Afterwards, the solution was diluted to a concentration of 20 µg mL-1 with water. Samples subjected to identical conditions, but protected from light, were used as a control. The oxidative reaction was performed by dissolving CPF in a small volume of ethanol and then diluting with 30% H2O2 (1 mg mL-1) at 80°C for 3 h under relux. An aliquot of this solution was diluted in water to give a inal concentration
of 20 µg mL-1. To verify the stability of the CPF solution in anhydrous ethanol and water, the samples were prepared and analysed after they had been stored for 2, 6, 8 and 24 h at room temperature.
Peak purity tests were performed by the photodiode array detector, which were useful to show that the analyte chromatographic peak did not contain more than one substance.
Precision
The precision of the methods was evaluated by repeatability (intra-day precision) and intermediate precision (inter-day precision) tests. The repeatability was tested by assaying six samples at the same concentration (20 µg mL-1) throughout one day under consistent experimental conditions. The intermediate precision of the method was assessed by carrying out the analysis on three different days and with a different analyst performing the analysis in the same laboratory (between-analyst precision). Data were expressed as a function of the relative standard deviation (RSD%) of a series of measurements.
Accuracy
The accuracy was determined by a recovery test, which consisted of adding aliquots of 1.0, 2.0 and 3.0 mL of the standard CPF solution (LC and UV stock solutions)
to placebo solutions, which gave inal concentrations of the reference standards as 10, 20 and 30 μg mL-1 for LC and 8, 16 and 24 μg mL-1 for UV tests. Each solution was prepared in triplicate.
Robustness
The robustness of the UV method was evaluated by analysing the same samples with small and deliberate modifications to the analytical conditions, such as
changing the sonication time (3 and 7 min), amount of added organic solvent (8 and 15 mL ethanol), manufacturer of the organic solvent and the stability of the CPF solutions for 24 hours at room temperature.
The robustness of the LC method was determined by analysing the same samples but with different method parameters, such as pH of the mobile phase (± 0.2 units),
the low rate (± 0.2 mL min-1), proportion of each solvent in the mobile phase (± 5% organic phase) and the column
(with the same speciication, but acquired from a different
supplier).
RESULTS AND DISCUSSION
LC method development and optimisation
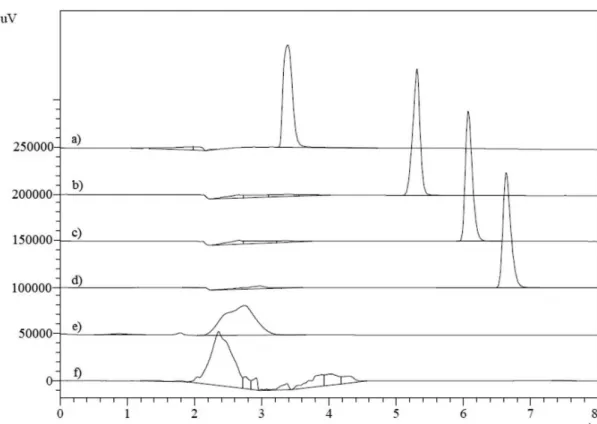
The development of a LC method requires the careful consideration of the polarity of the analyte, stationary phase and mobile phase in order to obtain good separation within a reasonable time. Thus, the LC procedure was optimised to develop a stability-indicating method so that the degradation products from the drug could be resolved. The chromatographic conditions were chosen after testing different mobile phases with different proportions of organic and aqueous solvents (Figures 2 and 3). Acetonitrile and methanol are commonly used solvents in reverse-phase LC, because they have low UV cut-off points of 190 and 205 nm, respectively. These solvents are miscible with aqueous solutions, so reverse-phase chromatography was performed with various mixtures of organic and aqueous solvents. During the development phase, acetonitrile and methanol were used in the mobile phase at different ratios, which resulted in an asymmetric peak with a large tailing factor (T >2) and a very low retention time (Figure 2f). Exchanging methanol with water did not improve the separation, and the peak was still unresolved from the void volume (Figure 2e). To achieve a better separation, the aqueous phase and pH (in the range 2.0–5.0) were changed to optimise the CPF retention time to 6 min (Figures 2a, b, c and d). Different ratios of the organic phase were analysed (Figure 3). Finally, a mobile phase containing
o-phosphoric acid (0.1% v/v), adjusted to pH 3.0 by adding triethylamine (10% v/v) and acetonitrile (35:65 v/v), was adopted because of its low tailing factor, good capacity factor (k´) value, retention time and its ability to separate the degradation products from CPF with good peak parameters (Figure 5). The pH value of 3.0 was
chosen because it showed a better peak proile compared
FIGURE 2. Chromatograms of CPF standard solution in tested mobile phases with 65% of ACN and 35% of a) o-phosphoric acid
0.1% (v/v) pH 5.0, b) o-phosphoric acid 0.1% (v/v) pH 4.0, c) o-phosphoric acid 0.1% (v/v) pH 3.0, d) o-phosphoric acid 0.1%
(v/v) pH 2.0, e) puriied water and f) methanol.
A system suitability test of the chromatographic system was performed before each validation run. The system suitability test is an integrated part of the analytical method, which ascertains the suitability and effectiveness of the operating system. It was carried out to evaluate the reliability and reproducibility of the system for the analysis, using five replicate injections of a reference solution containing 20 µg mL-1 CPF. The approximate results gave the following results: theoretical plates (N = 6800), tailing factor or peak asymmetry (T = 1.2) and injection repeatability (RSD% = 0.36, n = 5). The values for these parameters were satisfactory and in accordance with previously published data (Shabir, 2003). The tests ensure that the LC method generates reliable results. Thus, it was established that the LC system and procedure are capable of providing data of an acceptable quality.
UV method development and optimisation
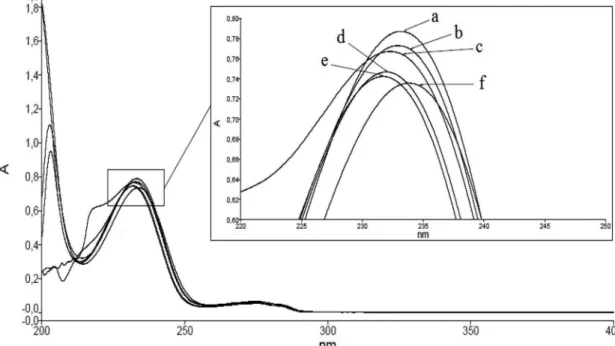
In this study, different solvents were investigated to develop a suitable UV spectrophotometric method for the analysis of CPF in tablets and capsules. For the selection of diluents, the criteria employed were the sensitivity of the method, ease of sample preparation, time consumption and the solubility of the drug.CPF is practically insoluble in water, freely soluble in anhydrous ethanol and soluble in toluene (European Pharmacopeia, 2008). The use of acetonitrile, methanol or sodium hydroxide (0.1 and 0.01 M) as the diluent did not improve the sensitivity of
the method. Thus, anhydrous ethanol was tested as the solvent, after addition of distilled water, in order to reduce organic solvent use. Absorption spectra were obtained by UV spectrophotometry in the range of 200-400 nm for the standard solutions in various solvents, and the overlap is shown in Figure 4.
The inal decision to use ethanol and water as the
analysis medium was based on various criteria, including the sensitivity of the method, cost, ease of preparation and the accuracy of the results.
Method validation
The validation ensures that the procedure is suitable for the intended purpose. The ICH and USP guidelines describe the analytical parameters that should be evaluated in a method validation. The method type and its intended use determine which parameters should be evaluated. It is the responsibility of the analyst to select the parameters that are considered to be relevant for each method (Ermer, 2001). The LC and UV spectrophotometric methods were validated for parameters such as linearity, specificity, precision, accuracy and robustness.
Linearity was established by least-squares linear regression analysis of the calibration curve. The regression equation for CPF was found by plotting the peak absorbance (y) versus the sample concentration (x).
Correlation coeficients of 0.9999 (for the LC method)
and 0.9998 (for the UV method) were considered to be
FIGURE 4. Overlap of the absorption spectra obtained by UV spectrophotometry in the range of 200-400 nm, of the standard
solutions in: a) ethanol and water (diluent); b) sodium hydroxide 0.01M; c) sodium hydroxide 0.1M; d) methanol; e) acetonitrile
TABLE I - Linearity data for UV and LC analyses
LC UV
Correlation coeficient 0.9999 0.9998
Linear equation y = 49069x – 17753 y = 0.0462x – 0.0282
Linear regression* Fcalculated = 22746 > Fcritical = 4.96 Fcalculated = 17081 > Fcritical = 4.96
Linearity deviation* Fcalculated = 1.4 < Fcritical = 3.71 Fcalculated = 2.4 < Fcritical = 3.71
* p < 0.05
TABLE II - Results of CPF stability under force degradation conditions and regular conditions
Condition Time (h) Degradation (%)
Acid hydrolysis (1 N HCl) 4 60.47
Basic hydrolysis (1 M NaOH) 7 70.87
Oxidation (H2O2) 3 60.14
Photolysis 1.5 55.64
Regular conditions (ethanol:water, room temperature)
2
no degradation 6
8 24
highly signiicant. The validity of the assays was veriied
by means of ANOVA analysis (SAS 6.11 for windows, SAS Institute Inc. CARY, NC, USA), which demonstrated
signiicant linear regression and no signiicant linearity
deviation (Table I).
The speciicity test demonstrated that there was no
interference in the UV spectrophotometric determination of the drug. All solutions were scanned from 400 to 200 nm and checked for any change in the absorbance at the respective wavelengths. The UV spectrophotometric
method proves to be speciic for the determination of drugs
present in tablet and capsule matrices, because there is no interference caused by excipients at the wavelength of the drug maximum absorption (λ
max 233). Forced degradation studies for the determination of the speciicity
of the direct UV method were not performed. Owing to
speciicity/selectivity limitations (e.g., in general terms,
the degradation products present functional groups that absorb at the same wavelength of the intact drug), there are very few reports on the use of UV spectrophotometry for stability assays. However, there are some reports involving derivative spectroscopy that have been published recently (Abbas et al., 2012; Cielecka-Piontek, Lunzer,
Jelińska, 2011). LC methods have taken precedence over
conventional analysis methods; reverse-phase LC coupled with ionic suppression probably accounts for over 85% of stability-indicating methodologies for
low-molecular-weight pharmaceutical entities. Other than the separation of multiple components, the advantage of LC methods is that they possess greater accuracy and sensitivity for even small quantities of degradation products (Bakshi, Singh, 2002; Shabir, 2003).
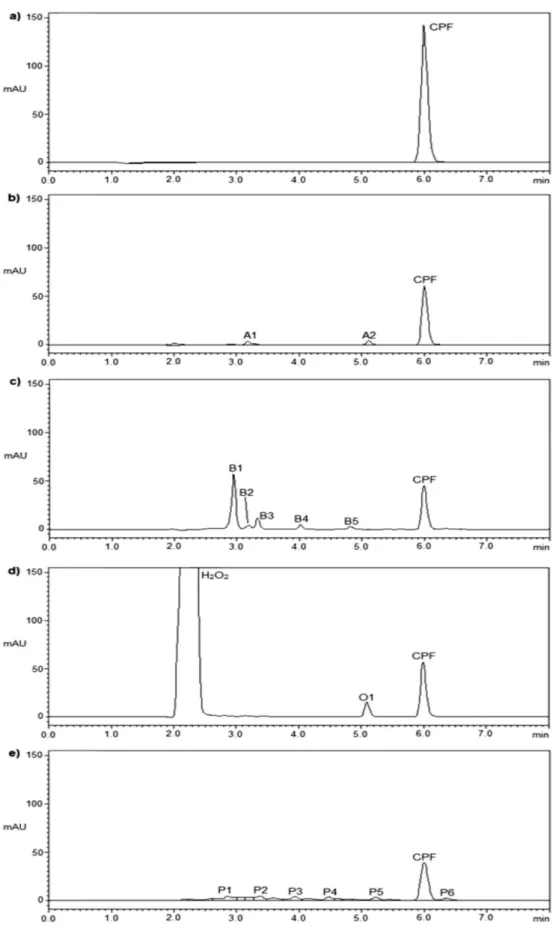
The forced degradation studies were conducted to evaluate the stability-indicating capability and selectivity of the proposed LC method using the CPF reference substance. Table II presents the extent of CPF degradation under both stress conditions and regular conditions, and Figure 5 shows the chromatograms of the untreated solution and the forced degradation samples.
It is important to note that although several degradation product peaks can be observed, the peak for CPF remains resolved. The chromatographic peak purity tool was applied to verify the CPF peak, showing that it
was 100% pure in all cases, indicating the speciicity of
any spontaneous degradation could occur between sample preparation and analysis. The data obtained showed that sample solutions were stable for at least 24 h when stored at room temperature (Table II).
The precision of the methods was determined by studying the repeatability and the intermediate precision.
The experimental values obtained for the quantiication
of CPF in various samples are presented in Table III. The variability of the results was low, with RSD% values less than 1.8 for repeatability and 1.4 for intermediate-precision analysis. The RSD% values that were obtained for the
analytical methods were within the acceptable range, indicating that these methods have great repeatability and intermediate precision.
With regards to the accuracy of the two methods, the excellent mean percentage recovery values and
their low RSD% (≤ 1.5) were found to be satisfactory.
At each CPF concentration, three determinations were performed for each method. The mean recovery for the UV spectrophotometric method was 99.15% (RSD% = 0.81) and 102.59% (RSD% = 0.77) for the tablets and capsules, respectively, and the LC mean recovery was 100.54% (RSD% = 1.15) and 99.64% (RSD% = 1.44). These results revealed that any small change in drug concentration in these solutions could be accurately determined by the proposed analytical methods.
The robustness of each method was demonstrated by small variations in the analytical conditions, which are cited above. The obtained results (Table IV) show that
there are no important effects on the analysis, conirming
the robustness of the proposed methods.
Comparison of the UV spectrophotometric method and the LC method
The analytical methods were compared using statistical analysis. The two one-sided test (TOST) (XLSTAT Version 2014.1.07 for windows) was used as an equivalence test to compare the experimental values TABLE III - LC and UV assay precision results for CPF in tablets
and capsules
Tablets mean ± RSD%
Capsules mean ± RSD%
LC
1 day (n=6) 102.54 ± 1.20 97.90 ± 1.03
2 day (n=6) 100.73 ± 0.74 98.67 ± 0.61
3 day (n=6) 99.62 ± 1.76 98.89 ± 1.59
Inter-daya 100.96 ± 1.13 98.49 ± 0.43
UV
1 day (n=6) 102.41 ± 0.78 99.83 ± 0.56
2 day (n=6) 100.52 ± 0.50 96.84 ± 0.83
3 day (n=6) 100.44 ± 0.69 97.32 ± 0.25
Inter-daya 101.12 ± 0.90 98.00 ± 1.31
a Data expressed as the mean of 3 days.
TABLE IV - Experimental values for the robustness testing, obtained from UV and LC analysis of CPF in tablets and capsules
Analysis conditions
CPF content
Tablets mean* ± RSD%
Capsules
mean*± RSD%
LC
Column (different supplier) Temperature 30 °C
Flow rate 0.8 mL min-1
Flow rate 1.2 mL min-1
70% acetonitrile 60% acetonitrile
pH 2.7 pH 3.3 Regular conditions
98.75 ± 0.67 102.91 ± 2.28
98.86 ± 0.59 101.28 ± 1.12
99.16 ± 0.38 99.16 ± 0.38 99.26 ± 0.31 98.72 ± 0.69 99.70 ± 0.86
95.78 ± 0.58 96.87 ± 0.22 95.72 ± 0.62 97.76 ± 0.87 95.43 ± 0.83 95.28 ± 0.94 95.43 ± 0.83 94.93 ± 1.20 96.57 ± 0.77
UV
Addition of 8 mL ethanol Addition of 15 mL ethanol
Sonication for 3 min Sonication for 7 min 24 h at room temperature (25 °C)
Different ethanol manufacturer Regular conditions
100.27 ± 0.90 99.92 ± 1.70 101.18 ± 0.30 101.37 ± 0.37 101.71 ± 0.48 100.32 ± 0.54 100.04 ± 0.71
98.65 ± 0.42 99.99 ± 0.53 98.27 ± 0.43 99.06 ± 0.56 98.58 ± 0.47 99.69 ± 0.73 99.00 ± 0.16
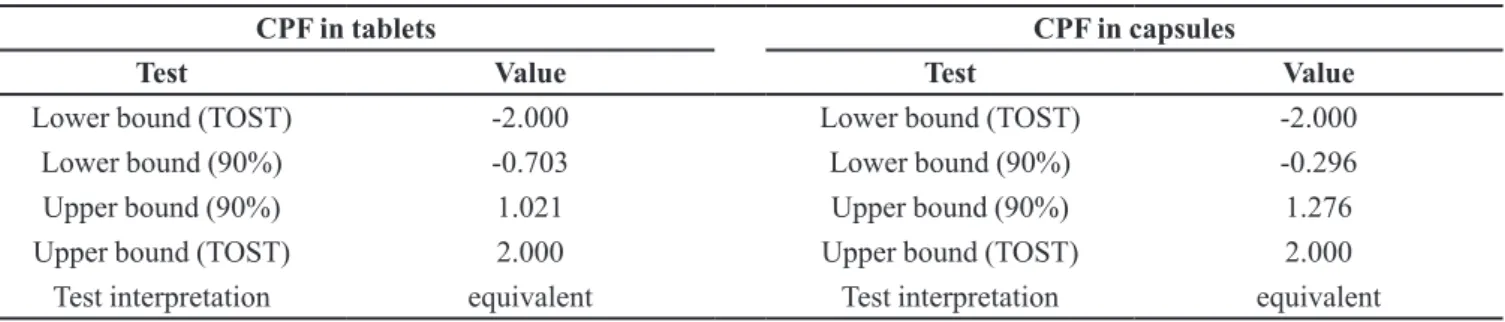
TABLE V - TOST results for the comparison of the LC and UV methods
CPF in tablets CPF in capsules
Test Value Test Value
Lower bound (TOST) -2.000 Lower bound (TOST) -2.000
Lower bound (90%) -0.703 Lower bound (90%) -0.296
Upper bound (90%) 1.021 Upper bound (90%) 1.276
Upper bound (TOST) 2.000 Upper bound (TOST) 2.000
Test interpretation equivalent Test interpretation equivalent
α = 0.05
(Table III) that were obtained from the analysis of samples with the two different methods. Equivalence was tested by determining 90% confidence intervals, based on the experimental values obtained in the precision test. We could accept the null hypothesis and declare that the analytical methods were equivalent when the 90% confidence interval for the difference was completely contained within the defined range considered to be
scientifically trivial (± ∆). We defined ∆ = 2 as an
appropriate range for the equivalence testing, based on the
speciications of the precision test (RSD% ≤ 2). TOST was applied and showed equivalence, at the 5% signiicance
level, between the experimental values obtained in the sample analysis when using the different methods, as shown in Table V.
The developed and validated methods provide similar results for CPF quantitation, and can be applied directly and easily to oral preparations of the pharmaceutical drug. The direct UV method is a useful tool for routine analysis, but when it is necessary to prove the stability and to identify and/or quantify the degradation products, the chromatographic methods are a better choice, owing to the stability-indicating capability and superior sensitivity and selectivity. However, the time and cost of the analyses cannot be disregarded in routine analysis, and the spectrophotometric method is clearly less expensive, easier to use, requires a shorter analysis time and generates fewer residues.
CONCLUSION
This study presents two simple methods for the
determination and quantiication of CPF in pharmaceutical
formulations. The methods were validated, showing satisfactory data for all of the tested parameters. There were no significant differences between the stability-indicating LC and UV spectrophotometric methods. As both of these methods are fast and simple, they may be successfully applied to quality-control analyses, with the
aim of quantifying and identifying CPF in pharmaceutical products.
ACKNOWLEDGMENTS
The authors thank CAPES and CNPq (Brazil) for
the inancial support.
REFERENCES
ABBAS, S. S.; ELGHOBASHY, M. R.; SHOKRY, R. F.; BEBAWY, L. I. Stability indicating HPLC and spectrophotometric methods for the determination of bupropion hydrochloride in the presence of its alkaline
degradates and related impurity. Bull. Fac. Pharm, Cairo
Univ., v.50, n.1, p.49-59, 2012.
BAKSHI, M.; SINGH, S. Development of validated
stability-indicating assay methods – critical review. J. Pharm.
Biomed., v.28, p. 1011-1040, 2002.
BIGHETTI, E. J. B.; PATRÍCIO, P. R.; CASQUERO, A. C.; BERTI, J. A.; OLIVEIRA, H. C. F. Ciproibrate increases
cholesteryl ester transfer protein gene expression and the
indirect reverse cholesterol transport to the liver. Lipids
Health Dis., v.8, n.1, p.50-58, 2009.
BERMÚDEZ-PIRELA, V.; SOUKI, A.; CANO-PONDE, C.; BERMÚDEZ-ARIAS, F.; MENGUAL-MORENO, E.; LEAL-GONZALEZ, E.; LEMUS-ANTEPAZ, M.; CABRERA, M. B.; AMELL, D. A.; LEAL, P. N.; CANO- PEÑALOZA, R.; PUCHE-MEDINA, G.; RAMIREZ, I.; CONTRERAS, F.; VELASCO, M. Ciprofibrate diminishes NON-HDLc and improves HDLc in patients
with Frederickson type IV dyslipidemia phenotype. AVFT,
CIELECKA-PIONTEK, J.; LUNZER, A.; JELIŃSKA, A.
Stability-indicating derivative spectrophotometry method for the determination of biapenem in the presence of its
degradation products. Cent. Eur. J. Chem, v.9, n.1,
p.35-40, 2011.
FARMACOPEIA BRASILEIRA. 5.ed. Brasília: ANVISA,
2010. Available at: <http://www.anvisa.gov.br/hotsite/ cd_farmacopeia/index.htm >. Accessed on: 10 Jan 2012.
ERMER, J. Validation in pharmaceutical analysis. Part I: An
integrated approach. J. Pharm. Biomed., v.24, n.5-6,
p.755-767, 2001.
European Pharmacopeia. 6.ed. Strasbourg: Council of Europe, 2008. p.1547-1548.
GAR C I A, C . V. ; NUDE L MAN, N. S. ; ST E PPE , M. ; SCHAPOVAL, E. E. S. Structural Elucidation of
Photodegradation Products of Rabeprazole Sodium. J.
Pharm.. Biomed., v.46, n.1, p.88-93, 2008.
ICH HARMONISED TRIPARTITE GUIDELINE. Validation
of analytical procedures: text and methodology Q2(R1). Available at: <http://www.ich.org/ileadmin/Public_Web_ Site/ICH_Products/Guidelines/Quality/Q2_R1/Step4/ Q2_R1_Guideline.pdf>. 2005. Accessed on: 18 Jun 2012.
JAIN, P. S.; JIVANI, H. N.; KHATAL, R. N.; SURANA, S. J. Development and validation of stability-indicating high-performance thin-layer chromatography method for
estimation of ciproibrate in bulk and in pharmaceutical
formulation. Acta Chromatogr., v.23, n.3, p.469-482, 2011.
JAIN, P. S.; JIVANI, H. N.; KHATAL, R. N.; SURANA, S. J.
Stability-indicating HPLC determination of ciproibrate
in bulk drug and pharmaceutical dosage form. Chem. Ind.
Chem. Eng.Q., v.18, p.95-101, 2012.
MALESUIK, M. D.; PAIM, C. S.; GONCALVES, H. M.; SCHAPOVAL, E. E. S.; STEPPE, M. LC: Analysis of photodegradation kinetics of nitazoxanide in pharmaceutical
formulations. J. Chromatogr. Sci., v.47, p.745-748, 2009.
MENDES, F. D.; CHEN, L. S.; BORGES, A.; BABADÓPULOS, T.; ILHA, J. O.; ALKHARFY, K. M.; MENDES, G. D.; DE
NUCCI, G. Ciproibrate quantiication in human plasma
by high-performance liquid chromatography coupled with electrospray tandem mass spectrometry for pharmacokinetic
studies. J. Chromatogr. B., v.879, p.2361-2368, 2011.
NASCIMENTO, G. N. L.; ROSA, D. L.; NISHIJO, H.; AVERSI-FERREIRA, T. A. Validation of a spectrophotometric
method to determine ciproibrate content in tablets. Braz. J. Pharm. Sci., v.47, n.1, p.23-29, 2011.
SHABIR, G. A. Validation of high-performance liquid chromatography methods for pharmaceutical analysis. Understanding the differences and similarities between validation requirements of the US Food and Drug Administration, the US Pharmacopeia and the International
Conference on Harmonization. J. Chromatogr. A., v.987,
p.57-66, 2003.
UNITED States Pharmacopoeia. 35.ed. Rockville: United States Pharmacopoeia Convention, 2012. 2879 p.
Received for publication on 05th December 2013