www.bjorl.org
Brazilian
Journal
of
OTORHINOLARYNGOLOGY
ORIGINAL
ARTICLE
Hearing
performance
and
voice
acoustics
of
cochlear
implanted
children
夽
,
夽夽
Ana
Cristina
Coelho
a,∗,
Alcione
Ghedino
Brasolotto
b,
Maria
Cecília
Bevilacqua
b,
Adriane
Lima
Mortari
Moret
b,
Fayez
Bahmad
Júnior
a,caHospitalUniversitáriodeBrasília(HUB/UnB),Brasília,DF,Brazil
bDepartmentofSpeech,LanguageandHearingSciences,FaculdadedeOdontologiadeBauru,UniversidadedeSãoPaulo(USP),
Bauru,SP,Brazil
cPost-GraduatePrograminHealthSciences,UniversidadedeBrasília(UnB),Brasília,DF,Brazil
Received8May2014;accepted9December2014 Availableonline2December2015
KEYWORDS Voice; Voicequality; Cochlearimplant
Abstract
Introduction:Thevoiceofhearing-impairedindividualshasbeendescribedextensively,and exhibitsabnormalitiesinquality,articulationandresonance.Havinganunderstandingofthe aspectsthatmayhaveanimpactonvoicecharacteristicsofcochlearimplantusersisimportant forusersandforprofessionalsinthisfield.
Objective:Toverifytheexistenceofcorrelationbetweenage,timeofdeviceuse,voice detec-tionthreshold,hearingcategoryscoreandlanguagecategoryscorewithacousticdataofvoices ofcochlearimplantedchildren.
Methods:Retrospectivestudy.Fifty-onechildren ranginginagefrom3yearsto5yearsand 11monthswhounilaterallyusedcochlearimplantsparticipated.Acousticanalysisofthe sus-tainedvowel/a/,sequentialspeechandspontaneousspeechwasperformed.Theresultswere correlatedwithdemographicdataandhearingtestresults.
Results:Childrenwithworsevoicedetectionthresholdshowedhigherfrequencyinthe sus-tainedvowel(p≤0.001)andinthespontaneousspeech(p≤0.005).
夽
Pleasecitethisarticleas:CoelhoAC,BrasolottoAG,BevilacquaMC,MoretALM,Bahmad JúniorF.Hearing performanceand voice acousticsofcochlearimplantedchildren.BrazJOtorhinolaryngol.2016;82:70---5.
夽夽Institution:UniversidadedeSãoPaulo,FaculdadedeOdontologia deBauru,Bauru,SP, Brazil;Universidadede Brasília,Faculdade
deCiênciasdaSaúde,Brasília,DF,Brazil.
∗Correspondingauthor.
E-mail:anacrisccoelho@yahoo.com.br(A.C.Coelho). http://dx.doi.org/10.1016/j.bjorl.2015.11.002
Conclusion: Therewasacorrelationbetweenthevoicedetectionthresholdandthefrequency valuesofthesustainedvowelandspontaneousspeechofthestudiedpopulation.
© 2015Associac¸ãoBrasileira de Otorrinolaringologiae CirurgiaCérvico-Facial. Publishedby ElsevierEditoraLtda.Allrightsreserved.
PALAVRAS-CHAVE Voz;
Qualidadedavoz; Implantecoclear
Desempenhoauditivoeacústicadavozdecrianc¸ascomimplantecoclear
Resumo
Introduc¸ão: Avozdoindivíduocomdeficiênciaauditivatemsidoamplamentecaracterizada, estando comprometida em termos de tipo de voz,articulac¸ão e ressonância, sendo que o conhecimentodosaspectosquepossamterimpactonascaracterísticasvocaisdeusuáriosde implantecoclearédesumaimportânciaparaosusuárioseprofissionaisdaárea.
Objetivo: Verificaraexistênciadecorrelac¸ãoentreidade,tempodeuso,limiardedetecc¸ão devoz,escoredacategoriadeaudic¸ãoeescoredacategoriadelinguagemcomdadosacústicos devozesdecrianc¸ascomimplantecoclear.
Método: Estudoretrospectivo.Participaram51crianc¸asusuáriasdeimplantecoclearcomidade de3---5anose11meses.Foirealizadaanáliseacústicadavogalsustentada/a/,falaencadeadae conversaespontânea.Osresultadosforamcorrelacionadoscomdadosdemográficoseresultados detestesauditivos.
Resultados: Crianc¸ascompiordesempenhonotestededetecc¸ãodevozapresentamvozmais agudanavogalsustentada(p≤ 0,001)enaconversaespontânea(p≤ 0,005).
Conclusão:Houvecorrelac¸ãoentreoslimiaresdedetecc¸ãodevozeosvaloresdefrequência navogalsustentadaeconversaespontâneanapopulac¸ãoestudada.
©2015Associac¸ãoBrasileiradeOtorrinolaringologiaeCirurgiaCérvico-Facial.Publicado por ElsevierEditoraLtda.Todososdireitosreservados.
Introduction
The vocal behaviorof children canvaryconsiderably, and parameterssuchasresonance,pitchandloudnessare essen-tialfordeterminingthisperformanceandtoidentifyvoice abnormalities.1 The expected vocal standard in childhood includes fundamental frequencyabove250Hz,high pitch, moderatetohighintensityandabruptvocal attack.Slight nasality,hoarsenessandbreathinesscanbeobserved.2
Inthechild withhearingimpairment,especiallyif pre-lingual,thereisaflawinauditorymonitoringofthevoice resultinginseveraldeviationsofvocalproduction,because inadditiontoneuromuscularcontrol,hearingis important forgoodperformanceinoralcommunication.Theauditory systemisabletoregulatevoiceparameterssuchasintensity, extensionandfrequency.3,4Amongothercharacteristics,the mostcommonvocaldisordersinhearingimpairedindividuals include unpleasant quality, strain, resonance imbalance, high frequency, altered breathing pattern and utterance withexcessivevariation.5---7
Especially when performed early in life, the cochlear implant is a most important advancement in the treat-mentofchildrenwithpre-lingualhearingimpairment,and implanted children achieve better auditory perception of speechsounds, incidental appropriation of oral language, and better speech intelligibility and vocal production.8,9 However, despite the marked improvements after the implant, it is possible that users of such devices show a
suboptimal voice quality.10 Therefore, understanding the physiologicalprocessesinvolvedinvoicecontrolofCIusers isamajorchallengeforthespecialistsworkinginthisarea.11 Itis knownthat theresults withcochlearimplants are closelyrelatedtothe ageatwhich thechildreceivedthe device.12Additionally,follow-upofthesechildrenmonitors theperformanceofhearing,languageandspeechinclinical anddailycontexts,andtheperformanceevaluationsupplies datatodefinemoreaccuratelythehearingabilityofeach child,4aswellastheiroralcommunicationwithrespectto voiceandspeech.
In this study we question whether the vocal charac-teristics of cochlear implanted children are related to other demographic and hearing performance characteris-tics. Therefore, the aim of this study was to investigate the correlation between age, time of device use, voice detectionthreshold,hearingcategoryscore13 andlanguage category score14 and acoustic data of voices of cochlear implantedchildren.
Method
This study was approved by the Ethics Committee in Research with Human Beings of the institution where it washeld,underprocessN.131/2010.Allparents/guardians signedthefreeandinformedconsentform.
NucleusFreedomContour,PulsarCI100orSonataTI100cochlear
implants,participatedinthestudy.
The inclusion criteria for participation in the study weresevereorprofound bilateralcongenitalsensorineural hearingloss,nointellectualoremotionalimpairments, par-ticipationinanauditoryhabilitationprograminthecityof origin,cochlearimplantationbefore36monthsofagewith fullinsertionoftheelectrodes anduseoftheCIformore thanayear.
Considering the purpose of the study, speech samples werecollectedfromparticipants,comprisingtheutterance ofthevowel/a/threetimes,sequentialspeech(counting from1to5)andspontaneousspeechforsubsequent acous-ticanalysis. The recording program usedwas SonySound Forge(SonyPicturesDigital Inc8.0)withsamplingrateof 44,100Hz,16Bit,monochannel.Theparticipantremained seatedduringtherecordinginanacousticallytreated audio-metrictestingroom.ThesoundcardM-AudioFastTrackPro and headset microphone AKG C512 positioned at 45◦ and withadistanceof3cmfromthemouthwereused.
Acoustic analysiswasperformed withtheMulti Dimen-sional Voice Program, model 5105, version 2.5.2 (Kay Elemetrics),andRealTimePitch,model5121,version2.5.2 (KayElemetrics).Theselectedacousticparametersfor anal-ysisofthelongvowelwere:
Frequency measurements: fundamental frequency mean (f0)andstandarddeviation;
Long-term and short-term frequency disturbance meas-ures:coefficientofvariationoff0(vf0)andjitter;
Long-term and short-term amplitude disturbance meas-ures: coefficientofvariationoftheamplitude(vAm)and shimmer;
Noise measurements: vocal turbulence index (VTI), soft phonationindex(SPI),harmonics-to-noiseratio(HNR)and degreeofsub-harmonics(DSH).
The selected parameters for analysis of sequential speech and spontaneous speech samples were frequency measurements:frequencymean,frequencyextension mea-sured in Hertz (Hz), minimum frequency, maximum frequency, frequency standard deviation and frequency extensionmeasuredinsemitones.
Dataregardingage,timeofcochlearimplantuse, free-fieldvoicedetectionthreshold(VDT),hearingcategoryscore andlanguage category score were collected onthe same day of the voicerecording, during routine evaluationsby speechtherapistsfromthecochlearimplantserviceofthe institutionwherethestudywascarriedout.
Theselectedvariablesarecontinuousandnormally dis-tributed.Therefore,thestatisticaltestusedfortheanalysis wasPearson’scorrelationwitha5%significancelevel.A clas-sificationscalewasused,wherethecorrelationof0---20%is consideredpoor,20---40%bad,40---60%regular,60---80%good and80---100%excellent.
Results
Thisstudyfoundacorrelationbetweenage,timeofdevice use,voicedetectionthreshold,hearingcategoryscoreand language category score with acoustic data of voices of
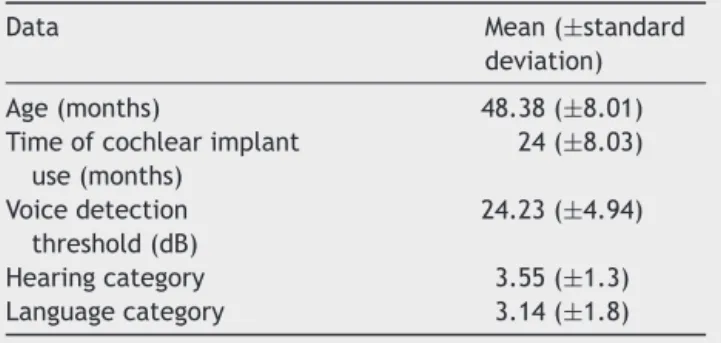
Table 1 Characteristics of the sample regarding the assesseddata.
Data Mean(±standard deviation)
Age(months) 48.38(±8.01) Timeofcochlearimplant
use(months)
24(±8.03)
Voicedetection threshold(dB)
24.23(±4.94)
Hearingcategory 3.55(±1.3) Languagecategory 3.14(±1.8)
SD,standarddeviation;dB,decibel.
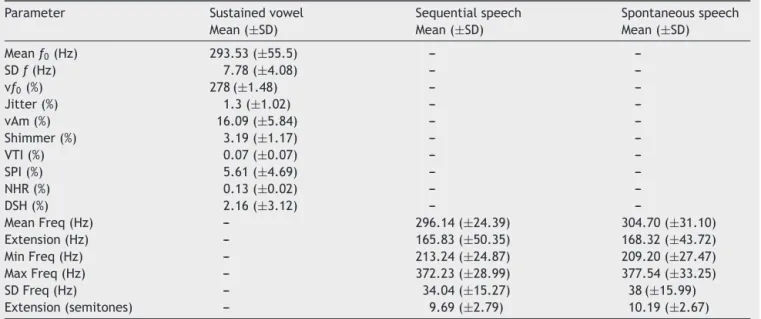
cochlearimplantedchildren.Thedatathatcharacterizethe studypopulationareshowninTable1.Themeanresultsof theacousticanalysisofvoicesignalsoftheparticipantsare showninTable2.Becausenotallchildrenwereableto per-formthe threeutterances,therewasa slightvariationin thetotalnumberofeachutterance.
The results considered for discussion were those with correlation ≥40%, comprising regular, good and excellent correlations.Thus,itwasobservedthatasthevoice detec-tion thresholdincreases,i.e., worsens, the meanof f0 in
thesustainedvowel(p≤0.001)andinspontaneousspeech (p≤0.005)increases(Tables3---5).
Discussion
Acoustic analysis quantifies the soundsignal and provides enough documentationtooutlinethebaselineofthe indi-vidual’s voice; the acoustic parameters of fundamental frequency and their disturbanceindices, along with mea-surements ofnoise, have importantclinical implications.2 Among all analyzed acoustic parameters,only the funda-mental frequency showed a correlation withthe assessed demographicsandhearingaspects.Althoughmoderate,this correlationstandsout,consideringthevalueofp.
Amongmanyotherfeatures,theliteratureshowsatrend in which hearing-impaired individuals have high pitched voices, withthis being theperceptual correlation of high fundamentalfrequency,whichiscausedbythelackof audi-toryfeedbackofone’sownvoice,asthefrequencycontrol isaffectedwhenauditoryfunctionsareimpaired.4,15,16
Thefundamentalfrequencyisgivenbytheglotticcycle numbersoveratimeunit(seconds).Theirdeterminant fac-tors arethe natural length of thevocal folds,stretching, mass vibration and the involved tension.17 A high fun-damental frequency reflects poor laryngeal control, also demonstratedbyelevationofthelarynx,higherphonation effortandincapacitytocontrolthetensionofthevocalfolds andsubglotticpressure.6
Table2 Meanandstandarddeviation oftheacoustic data ofthesustained vowel (n=46),sequential speech (n=45) and spontaneousspeech(n=47).
Parameter Sustainedvowel Mean(±SD)
Sequentialspeech Mean(±SD)
Spontaneousspeech Mean(±SD)
Meanf0(Hz) 293.53(±55.5) ---
---SDf(Hz) 7.78(±4.08) ---
---vf0(%) 278(±1.48) ---
---Jitter(%) 1.3(±1.02) ---
---vAm(%) 16.09(±5.84) ---
---Shimmer(%) 3.19(±1.17) ---
---VTI(%) 0.07(±0.07) ---
---SPI(%) 5.61(±4.69) ---
---NHR(%) 0.13(±0.02) ---
---DSH(%) 2.16(±3.12) ---
---MeanFreq(Hz) --- 296.14(±24.39) 304.70(±31.10) Extension(Hz) --- 165.83(±50.35) 168.32(±43.72) MinFreq(Hz) --- 213.24(±24.87) 209.20(±27.47) MaxFreq(Hz) --- 372.23(±28.99) 377.54(±33.25) SDFreq(Hz) --- 34.04(±15.27) 38(±15.99) Extension(semitones) --- 9.69(±2.79) 10.19(±2.67)
Meanf0,meanofthefundamentalfrequency;SDf0,standarddeviationofthefundamentalfrequency;vf0,coefficientofvariationoff0,
coefficientofamplitudevariation;VTI,voiceturbulenceindex;SPI,softphonationindex;HNR,harmonics-to-noiseratio;DSH,degreeof sub-harmonics;MeanFreq,meanfrequency;MinFreq,minimumfrequency;MaxFreq,maximumfrequency;SDFreq,Standarddeviation offrequency;Hz,Hertz.
hearing-impaired,thatcouldprovideaclearer understand-ingofthecharacteristicsandadjustmentsofthevocaltract thatresultinthevocalchangesdescribedinthispopulation. Inthisstudy,itwasobservedthatbothinthesustained vowel and in spontaneous speech, the participants with worsevoicedetectionthresholdhadthehighestfrequency. Asthehearinglossincreasesorahearingthresholdobtained withahearingaidworsens,thevoiceparameterstendtobe moredeviated.18 However,results fromotherstudies that analyzedthefundamentalfrequencyofCI5,11,19---23usersare controversial.Thus,westresstheimportanceofknowingall
aspectsthatmayhaveanimpactonthevocalcharacteristics ofcochlearimplantusers.
A previous study24 found a correlation between fun-damental frequency values and the result of a speech perceptiontest.Acorrelationhasalsobeenfoundbetween frequencyvaluesandthetimeofrehabilitationandageat surgery.11 A study assessingthe variabilityin fundamental frequency4 showed that as the auditory threshold wors-ens,thevariabilityofthefundamentalfrequencyincreases due to a decrease in auditory signals for the monitoring ofvocal production.Studiescarriedoutamongtheelderly
Table3 Correlationofacousticdataofthesustainedvowelwithage,timeofdeviceuse,voicedetectionthreshold,hearing categoryandlanguagecategory.
Parameter Age Timeofuse VDT Hearingcategory Languagecategory
Corr p-Value Corr p-Value Corr p-Value Corr p-Value Corr p-Value
Meanf0(Hz) −30.70% 0.036 −17.90% 0.23 53.80%a 0.001b −12.80% 0.391 −14.90% 0.317 SDf0(Hz) 5.60% 0.708 19.70% 0.185 23.20% 0.174 −1.00% 0.947 −9.80% 0.513
vf0(%) 13.80% 0.354 21.80% 0.141 2.90% 0.868 19.10% 0.198 0.20% 0.989
27.10% 0.066 33.70% 0.021 −1.10% 0.949 26.50% 0.072 10.40% 0.486 vAmp(%) 9.10% 0.544 2.60% 0.862 −38.20% 0.022 −18.90% 0.202 −5.10% 0.734 Shim(%) 32.10% 0.028 38.10% 0.008 −11.60% 0.499 27.10% 0.065 15.80% 0.288 VTI(%) −11.80% 0.43 3.50% 0.813 35.60% 0.033 −3.60% 0.81 1.00% 0.946 SPI(%) 16.20% 0.277 −3.80% 0.802 −12.20% 0.479 2.50% 0.867 4.50% 0.764 NHR(%) 18.60% 0.211 25.70% 0.081 −11.70% 0.496 25.70% 0.081 16.80% 0.259 DSH(%) 10.60% 0.48 8.90% 0.55 −11.30% 0.513 4.00% 0.792 −0.40% 0.979
VDT,voicedetectionthreshold;Meanf0,meanofthefundamentalfrequency;SDf0,standarddeviationofthefundamentalfrequency;
vf0, coefficientofvariationoff0, coefficient ofamplitudevariation;VTI,voice turbulenceindex; SPI,soft phonation index;HNR,
harmonics-to-noiseratio;DSH,degreeofsub-harmonics;Hz,Hertz.
Table4 Correlationofacousticdata ofsequentialspeechwithage,timeofdeviceuse,voicedetectionthreshold,hearing categoryandlanguagecategory.
Parameter Age Timeofuse VDT Hearingcategory Languagecategory
Corr p-Value Corr p-Value Corr p-Value Corr p-Value Corr p-Value
MeanFreq(Hz) −33.20% 0.026 −19.00% 0.212 26.00% 0.125 −20.20% 0.184 −17.10% 0.26 Extension(Hz) −11.50% 0.451 −14.30% 0.349 −2.20% 0.898 0.90% 0.953 −4.20% 0.783 MinFreq(Hz) −4.10% 0.787 8.30% 0.588 9.10% 0.598 −7.30% 0.634 3.80% 0.806 MaxFreq(Hz) −24.90% 0.099 −23.50% 0.12 10.40% 0.545 −3.80% 0.805 −12.50% 0.412 SDFreq(Hz) −15.40% 0.319 −17.20% 0.264 7.60% 0.664 −9.70% 0.532 −23.60% 0.123 Extensionsemitones −12.20% 0.425 −20.70% 0.173 2.40% 0.887 0.20% 0.989 −11.80% 0.438
VDT,voicedetectionthreshold;MeanFreq,meanfrequency;MinFreq,minimumfrequency;MaxFreq,maximumfrequency;SDFreq, standarddeviationofthefrequency;Hz,Hertz.
Table5 Correlationofacousticdataofspontaneousspeechwithage,timeofdeviceuse,voicedetectionthreshold,hearing categoryandlanguagecategory.
Parameter Age Timeofuse VDT Hearingcategory Languagecategory
Corr p-Value Corr p-Value Corr p-Value Corr p-Value Corr p-Value
MeanFreq(Hz) −13.40% 0.366 −5.50% 0.711 44.90%a 0.005b −3.80% 0.796 −2.90% 0.846 Extension(Hz) 2.70% 0.857 7.00% 0.635 7.90% 0.642 26.10% 0.073 16.60% 0.26 MinFreq(Hz) −13.20% 0.371 −18.60% 0.206 13.30% 0.433 −20.60% 0.16 −16.10% 0.273 MaxFreq(Hz) −7.40% 0.615 −6.10% 0.681 19.70% 0.243 17.20% 0.241 8.40% 0.569 SDFreq(Hz) −5.40% 0.715 8.10% 0.584 13.40% 0.429 19.60% 0.182 12.50% 0.398 Extensionsemitones 4.60% 0.755 10.00% 0.497 5.00% 0.767 25.00% 0.086 18.10% 0.218
VDT,voicedetectionthreshold;MeanFreq,meanfrequency;MinFreq,minimumfrequency;MaxFreq,maximumfrequency;SDFreq, standarddeviationfrequency;Hz,Hertz.
aCorr≥40%. b p > 0.05
have also shown that as the tone thresholds worsen, f0
increases.3,25
Theimpactofworseninghearingthresholdsonthe funda-mentalfrequencymeasureshasalsobeenshowninstudies thatevaluatedvocalproductionimmediatelyafterremoving theauditoryfeedbackprovidedbytheCI.15
The other acoustic measures, including speech signal disturbances, utterance noise level and stability, did not correlate with the assessed data. Acoustic analysis of cochlear implant users demonstrated alterations of fre-quencyand amplitude measures in shortterm withnoise measurementswithinthenormalrange,andaltered stabil-itymeasures,11,20,23withtheresultsalwaysassociatedwith auditoryfeedback.
Understanding the physiological processes that con-tributetovocaldevelopmentincochlearimplantedchildren allowsus to understand the speech production strategies in this population, attempting to establish goals for an adequatespeechproduction.26 Itisthe auditoryfeedback that regulates the laryngeal musculature and postures of the vocal tract for an adequate phonation.20 Therefore, obtaining audiometric thresholds withinthe normal range for cochlear implant users is criticalfor vocal production control.
Thisstudydemonstratedtheimportanceof understand-ingnot only the vocal characteristics of cochlear implant users,but alsowithwhatfactorsthesecharacteristics are
correlated.Thisinformationisofgreatvalueforcliniciansto increasingly ensureappropriateinterventionregardingthe vocalproductionofCIusers.
Conclusion
Fortheassessedcochlear implantedchildren,therewasa correlationbetweenthevoicedetectionthresholdsandthe frequencyvaluesforthesustainedvowelandalsoin spon-taneous speech. That allows us to affirm that the worse the voice detection threshold is, the more high-pitched is thechild’svoice.Otheracousticparametersdidnot cor-relatewiththeotherassessedvariables.
Conflicts
of
interest
Theauthorsdeclarenoconflictsofinterest.
References
2.Behlau M, Azevedo R, Pontes P. Conceito de voz normal e classificac¸ãodas disfonias.In: BehlauM, editor.Voz:O livro do especialista --- Volume I. Rio de Janeiro: Revinter; 2001. p.53---79.
3.BaraldiGS,CastrodeAlmeidaL,CalaisLL,BorgesAC,Gielow I,RaymundoDeCuntoM.Studyofthefundamentalfrequency inelderlywomenwithhearingloss.Braz JOtorhinolaryngol. 2007;73:378---83.
4.LeeGS.Variabilityinvoicefundamentalfrequencyofsustained vowels inspeakers withsensorineural hearing loss. J Voice. 2012;26:24---9.
5.BaudonckN,D’haeseleerE,DhoogeI,VanLierdeK.Objective vocalqualityinchildrenusingcochlearimplants:a multiparam-eterapproach.JVoice.2011;25:683---91.
6.Wirz SL, Subtelny JD, Whitehead RL. Perceptual and spec-trographic study oftense voice in normal hearing and deaf subjects.FoliaPhoniatr.1981;33:23---36.
7.Hocevar-BoltezarI,VatovecJ,GrosA,ZargiM.Theinfluenceof cochlearimplantationonsomevoiceparameters.IntJPediatr Otorhinolaryngol.2005;69:1635---40.
8.MoretAL, BevilacquaMC,Costa OA.Cochlear implant: hear-ing and language in pre-lingual deaf children. Pro Fono. 2007;19:295---304.
9.de Souza LB, Bevilacqua MC, Brasolotto AG, Coelho AC. Cochlearimplantedchildrenpresentvocalparameterswithin normal standards. Int J Pediatr Otorhinolaryngol. 2012;76: 1180---3.
10.Hsu HW, Fang TJ, Lee LA, Tsou YT, Chen SH, Wu CM. Mul-tidimensional evaluation of vocal quality in children with cochlearimplants:across-sectional,case-controlledstudy.Clin Otolaryngol.2014;39:32---8.
11.GuerreroLopez HA,Mondain M,Amy delaBretèque B, Ser-raferoP,TrottierC,Barkat-DefradasM.Acoustic,aerodynamic, andperceptualanalysesofthevoiceofcochlear-implanted chil-dren.JVoice.2013;27:523e1---317e.
12.FrederigueNB, BevilacquaMC. Otimizac¸ãoda percepc¸ão da falaemdeficientesauditivosusuáriosdosistemadeimplante coclearmulticanal.RevBrasOtorrinolaringol.2003;69:227---33. 13.GeersAE.Techniquesforassessingauditoryspeechperception andlipreadingenhancementinyoungdeafchildren.VoltaR. 1994;96:85---96.
14.NascimentoLT.Umapropostadeavaliac¸ãodalinguagemoral [Monografia de especializac¸ão]. Bauru: Hospital de Pesquisa eReabilitac¸ãodeLesões Lábio-Palatais,Universidadede São Paulo;1997.
15.Poissant SF, Peters KA, Robb MP. Acoustic and perceptual appraisalofspeech productioninpediatric cochlearimplant users.IntJPediatrOtorhinolaryngol.2006;70:1195---203. 16.BehlauM,AzevedoR,RehderMI,ThoméDC.Disfonias
congêni-tas.In:BehlauM,editor.Voz:Olivrodoespecialista---Volume II.RiodeJaneiro:Revinter;2005.p.01---41.
17.BragaJN,DomingosSFO,SampaioTMM.Frequência fundamen-taldavozdecrianc¸as.RevCEFAC.2009;11:119---26.
18.ValeroGarciaJ,RoviraJM,SanvicensLG.Theinfluenceofthe auditoryprosthesistypeondeafchildren’svoicequality.IntJ PediatrOtorhinolaryngol.2010;74:843---8.
19.Campisi P, Low A, Papsin B, Mount R, Cohen-Kerem R, Harrison R. Acoustic analysis of the voice in pediatric cochlearimplantrecipients:alongitudinalstudy.Laryngoscope. 2005;115:1046---50.
20.CampisiP,LowAJ,PapsinBC,MountRJ,HarrisonRV. Multidi-mensionalvoiceprogramanalysisinprofoundlydeafchildren: quantifying frequency and amplitude control. Percept Mot Skills.2006;103:40---50.
21.EvansMK,DeliyskiDD.Acousticvoiceanalysisofprelingually deafadultsbefore andaftercochlearimplantation.JVoice. 2007;21:669---82.
22.AllegroJ, PapsinBC,HarrisonRV, CampisiP.Acoustic analy-sisofvoiceincochlearimplantrecipientswithpost-meningitic hearingloss.CochlearImplantsInt.2010;11:100---16.
23.Ubrig MT,Goffi-GomezMV,Weber R,MenezesMH,NemrNK, TsujiDH,etal.Voiceanalysisofpostlinguallydeafadults pre-andpostcochlearimplantation.JVoice.2011;25:692---9. 24.CoelhoAC,BevilacquaMC,OliveiraG,BehlauM.Relationship
betweenvoiceandspeechperceptioninchildrenwithcochlear implant.ProFono.2009;21:7---12.
25.WeatherleyCC,WorrallLE,HicksonLM.Theeffectofhearing impairmentonthevocalcharacteristicsofolderpeople.Folia PhoniatrLogop.1997;49:53---62.


