COMPARATIVE PHYTOSOCIOLOGY OF TREE SINUSIAE
BETWEEN CONTIGUOUS FORESTS IN DIFFERENT
STAGES OF SUCCESSION
CAVALCANTE, A. de M. B.,1 SOARES, J. J.2 and FIGUEIREDO, M. A.3 1Departamento de Geociências, Universidade Estadual do Ceará, CEP 60740-000, Fortaleza, CE, Brazil 2Departamento de Botânica, Universidade Federal de São Carlos, CEP 13565-905, São Carlos, SP, Brazil
3Departamento de Biologia, Universidade Federal do Ceará, CEP 60455-760, Fortaleza, CE, Brazil Correspondence to: Arnóbio de Mendonça B. Cavalcante, Rua Professor Francisco Gonçalves, 75, CEP 60135-430,
Fortaleza, CE, Brazil, e-mail: [email protected]
Received February 18, 1999 – Accepted January 19, 2000 – Distributed November 30, 2000 (With 3 figures)
ABSTRACT
The Baturité Mountain Range, located in the State of Ceará (BRA), displays on its highest levels a vegetation viewed as a disjunction from the Atlantic Forest in the East of Brazil. Among the vari-ous attributes associated with this vegetation, the abundance of water resources and a high biodiversity have a more outstanding relevance. However, in view of the current accelerated deforestation pro-cess, those attributes may be threatened in a near future. Therefore, the present work is a compara-tive study with its focus on vegetal community organization (tree sinusiae) and the floristic similarity and the phytodiversity of two areas in different successive stages, preserved and deforested 24 years ago. The aim of that intent was to obtain information that could essentially shed light on the defor-estation effects on tree vegetation and which could suggest scientific support regarding urgent projects of habitat reconstruction. The methodology used folowed the model utilized for rain forest, i.e.
con-sisting of a random distribution of 10 × 20 m plots surveying the living woody species with DBH ≥ 5 cm. The results obtained suggest that a possible new physiognomy type is emerging on the Baturite Mountain Range because of deforestation. The Myrtaceae and Mimosaceae families were the ones
that contributed most significantly to species richness, being the most outstanding for Areas 1 and 2, respectively. The deforestation which occurred in Area 2 eliminated 28 species and gave birth to a current densely distinct floristic composition.
Key words: tropical forest, phytosociology, vegetation.
RESUMO
Fitossociologia comparativa da sinúsia arbórea entre florestas contíguas em diferentes estádios de sucessão
seguiu o padrão utilizado para florestas tropicais úmidas, isto é, consistiu em distribuir parcelas retan-gulares com dimensões de 10 × 20 m aleatoriamente nas áreas selecionadas e levantar as espécies lenhosas vivas em pé com DAP ≥ 5 cm. Os resultados obtidos indicaram que uma possível nova ar-quitetura vegetacional esteja surgindo na Serra como decorrência do desflorestamento. As famílias
Myrtaceae e Mimosaceae foram as que mais contribuíram para a riqueza específica, sendo as mais
importantes para as Área 1 e 2, respectivamente. O desflorestamento ocorrido na Área 2 proporcionou 28 espécies a menos e uma composição florística atual densamente distinta.
Palavras-chave: floresta tropical, fitossociologia, vegetação.
INTRODUCTION
The native wooded vegetation cover in the State of Ceará decreased 30% in 12 years (1981-1993) which translates into a rate of deforestation of approximately 360,000 hectares/year. Today, 44% of the continental territory is covered by native wooded vegetation (PNUD/FAO/IBAMA/SEMA-CE, 1994).
The predominant vegetation is caatingas
covering the semi-arid lands that occupy 92% of the State (FUNCEME, 1994). However, the matas úmidas covering only 0.69% or 102,411 hectares
of the continental area of the State (PNUD/FAO/ IBAMA/SEMACE, 1994) and having great economic, social and ecological relevance, are disjoined parts of the Atlantic Forest in the east of Brazil.
Within the areas of the mata úmida, the
Ba-turité Mountain Range stands out principally be-cause of its water provision to various municipalities (including Fortaleza), its considerable biodiversity and because it suffers intense anthropic pressure on its forest cover.
Despite its importance, there are few scientific studies that concern this specific type of vegetation and none that study the phytosociological angle. A phytosociological study enables one to know the distribution of species in vertical and horizontal spaces as well as possible affinities between species or between groups of species, resulting in a valuable momentary evaluation of the vegetation.
Therefore an attempt was made to increase the availability of information as well as emphasize the consequences of human intervention in this phytocenose, emphasizing and comparing phytoso-ciological data from two contiguous forest formations of different ages and histories of uses.
MATERIAL AND METHODS
Site of study and areas investigated
The study was carried out in the Baturité Mountain Range, CE (BRA), in the floresta sub-perenifolia tropical pluvio-nebular with the
geogra-phic coordinates 4o15' lat. S and 38o55' long. W. The climatic characterization of the site in-cludes temperature, precipitation and the water table. The monthly and yearly temperature averages vary between 19 and 22oC, thermal range of appro-ximately 2oC and maximum average temperatures of 27oC registered during the dry period. Pre-cipitation is regularly distributed throughout the year with a yearly average of 1,666.3 mm. However there is a more intense period in March-April-May and a less intense period in September-October-November. Finally, the water table or the coming and going of ground water is characterized by hydro-deficiency starting in August, with a yearly level of about 101 mm. The yearly hydric excedent is always greater than 600 mm with greatest levels verified in March and April when it reaches levels over 200 mm. However the climatic typology of the area falls into the mesothermic type, following Thornthwaite’s classification (1955) apud
FUN-CEME (1994) or in the humid and humid sub-dominions with three to five dry months (Nimer, 1989).
ridges and interfluvial tables of different dimen-sions and widths, and finally the soil shows limi-tations to mechanization, susceptibility to erosion and dominance of podzólico vermelho amarelo e podzólico vermelho amarelo equivalente eutró-fico soils (Leite & Marques, 1998).
With respect to the vegetation and the flo-ra, some studies (e.g., Figueiredo etal., 1995) point
to the similarity between the Atlantic Forest in the east of Brazil, being considered a disjunction of the former, although with specific details due to its geographic isolation and location in a semi-arid environment.
The Area investigated 1 has an area of 13 ha in a mountainous area and is covered by dense vegetation that was constituted by trees that com-monly reached a height of 20 meters with tops that wove together to form a canopy with few trees sticking out. Although they suffered from human activity with the removal of trees (cutting of trails and paths), their original characteristics in structure, physionomy and floristic composition were still preserved. The presence of tree trunks and creepers of thick diameter were observed showing abundant animal life (insects, birds, etc.) among other
ele-ments. Thus according to the classification pro-posed by Gubert-Filho (1993) for forest types, the vegetation present can be considered primary fo-rest. The Area investigated 2 has an area of 2 ha and is contiguous to the first in a mountainous area. In 1974 the middle and bottom thirds of the bank were deforested and cleared for coffee plantations. With the failure of the coffee crops the area was abandoned and a secondary forest established itself. The secondary forest, grown up after the clearing of the primitive forest and finding itself within Gubert-Filho (1993) classification as Capoeirão
type secondary vegetation showed itself to be visibly different when compared to the not formerly deforested upper third.
Phytosociological survey
The plot method (Mueller-Dombois & Ellenberg, 1974) with dimensions of 10 × 20 m was used. The sample sufficiency for the sample areas was deduced through the collector curves of the real order and considering the time-effort-cost trinomial, as well as the discharacterization of the previously required physionomical homo-geneity. Thus, 30 and 15 plots were randomly
plotted respectively in Areas 1 and 2, showing all the live woody vegetables standing whose tops were at the level of the neck situated at the interior of the plot and which presented DBH ≥ 5 cm. In-dividuals that were touching the plastic tape (limit of the plot) were included on only two sides of the plot (one large and one small) and were not included on the other two sides, avoiding an ove-restimate of the sample. Creepers and dead in-dividuals were not included in the selection. All sample individuals following established criteria were tagged, numbered in order of growth, inde-pendent of the numbering of the plots and recorded with the following data: a) number of the indivi-dual; b) popular and scientific name, if possible; c) diameter at breast height in centimeters; d) total height in meters.
Collection and identification of botanical ma-terial
In each plot, unheard of species were collec-ted, and when necessary, not unheard of species with insufficiency of material for a perfect iden-tification. Collections were carried out in the insides as well as the circumferences of the plots. The collection and herborization of reproductive and/ or vegetable botanical material followed specific methodology recommended by Fidalgo & Bononi (1984). The identification of the botanical material was initially carried out by the Department of Biology of the Federal University of Ceará, UFC, following the classic taxonomical standards, i.e.
with a basis in floral morphological characters and using a variety of examples whenever possible. The determinations were done with analytical keys and comparisons with materials deposited in the local herbarium. In the absence of these resources, the material was sent to other specialists for iden-tification.
Organization of vegetation
Each type of vegetation differs from others in function of its combination of attributes and characteristics. Within these attributes is the orga-nization which can be approached in two distinct
ways (Rollet, 1978, apud Rodal, 1992): archi-tectural organization or as all individuals in
vegetation. In order to characterize the architectural organization of the areas investigated, (1) a distri-bution of the individuals by height and diameter, presented with histograms with left closed intervals and right open intervals of 2 m and 6 cm, res-pectively and (2) a quantification of the total density, total dominance, average diameter and height were carried out. To characterize the struc-tural organization, the structure of abundance and size were analyzed. The following structural des-criptions, parameters or phytosociological variables were quantified in relative values to determine the structure of abundance (Mueller-Dombois & Ellen-berg, 1974; Matteucci & Colma, 1982): density, frequency, dominance and the respective value of importance (VI). Graphics were designed for the height and diameter where only the sample po-pulations with at least 12 individuals common to the areas compared were included in the graphics to determine the structure of size. Finally, the architectural and structural organization of the sample Areas 1 and 2 were compared, considering the histograms, graphics and the structural des-criptions cited.
Floral similarity
To determine the floral similarity between the observed areas, Sorensen indices were used (Matteucci & Colma, 1988) for binary data (qua-litative) and Morisita (Felfili et al., 1993) for
quantitative data, based on the presence/absence and the abundance of species, respectively.
Phytodiversity
To estimate the diversity of arboreal species in Areas 1 and 2, the Shannon index (H’) was calculated, accompanied by the respective evenness measure (E) (Stiling, 1996), using the neperian logarithm. The values of the Shannon diversity index vary from 0 to 1.0. For calculations of diver-sity indices as well as similarity, and general processing, FITOPAC (Shepherd, 1995) was used.
RESULTS AND DISCUSSION
Architecture of abundance and size
The absolute values observed evidenced mar-ked architectural differences between Area 1 and 2 (Table 1). The total density verified for Area 1 was 91.2% greater than Area 2, the total
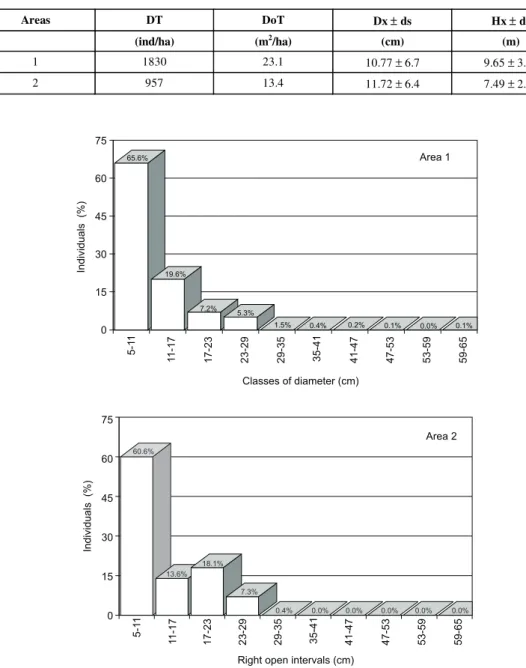
domi-nance, 72.4% greater and the average height 28.8% greater. Area 2 was only greater than Area 1 in average diameter, this being 8.8% greater. The relative distribution of sample individual by dia-meter class in Areas 1 and 2 also showed diffe-rences, presenting similarities only with respect to a higher concentration of trees in the 5-11 cm diameter class (Fig. 1).
Aside from this class, the differences between the two areas were visible. Area 1 presented a scaled reduction of trees due to a diametric increase and a larger diversity of diameters, starting small (5 cm) to large (65 cm). Area 2 in turn showed an increase in the number of trees in the 17-23 cm class, a diametric diversity 50% smaller (only 5 classes) and a maximum diameter limited to the 29-35 cm class.
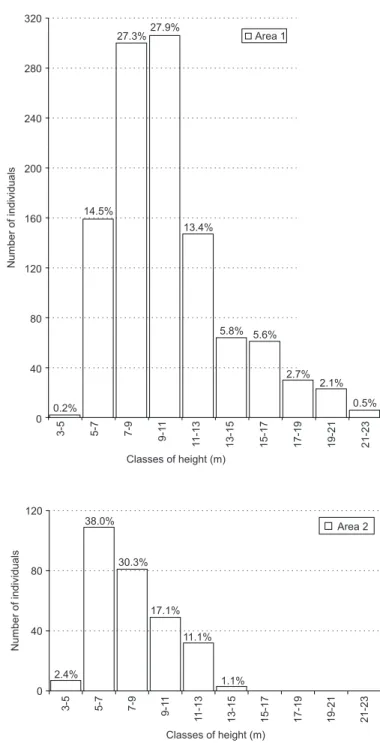
Finally, the absolute and relative distributions of the number of individuals shown by height clas-ses in Areas 1 and 2 also presented differences (Fig. 2). Area 1 showed a greater diversity of heights, varying from 4 to 23 m, tallest individuals (21-23 m) and a larger concentration of its trees in the 7 to 11 m range. Area 2 in turn, with a higher concentration of its individuals (38%) in the 5-7 m range, presented less diversity in sizes (4 to 15 m), smaller maximum height (13-15 m) and showed relative superiority in the smallest height class.
However, one can also observe many simi-larities between the areas: 1) the lack of formation of landings which could evidence and define a clear stratification, 2) the treetops are distributed along an average vertical space and above the forest without any definite standard, resulting in a semi-compact, monostratified arboreal cover, predominantly microfanerophytic by Raunkiaer classification adapted to Brazilian conditions (Raunkiaer, 1934, apud IBGE, 1992) and 3) an
irregular and sinuous canopy resulting from spar-sely emerging trees of differentiated heights.
This tardiness in the architectural equality between the two areas among the vegetation cover investigated can be attributed to a possible wearing out of some property of the soil which disfavored the natural process of reoccupation, which in func-tion of the contiguity of the areas should have been
guaranteed by the replacement of the biological material coming from the preserved Area 1.
The slightly larger average diameter in Area 2 was related to the lack of necessity, verified in many trees to have to compete aggressively for light.
Areas DT DoT Dx ± ds Hx ± ds
(ind/ha) (m2/ha) (cm) (m)
1 1830 23.1 10.77 ± 6.7 9.65 ± 3.34
2 957 13.4 11.72 ± 6.4 7.49 ± 2.14
65.6%
19.6%
7.2%
7.2%
5.3%
5.3%
1.5% 0.4% 0.2% 0.1% 0.0% 0.1%
75
60
45
30
15
0
75
60
45
30
15
0
Individuals
(%)
Individuals
(%)
5-1
1
5-1
1
1
1-17
1
1-17
17-23
17-23
23-29
23-29
29-35
29-35
35-41
35-41
41-47
41-47
47-53
47-53
53-59
53-59
59-65
59-65
Classes of diameter (cm)
Right open intervals (cm)
Area 1
Area 2
60.6%
13.6% 18.1%
7.3%
0.4% 0.0% 0.0% 0.0% 0.0% 0.0%
TABLE 1
Total Density (DT), Total Dominance (DoT), Average Diameter (Dx), Standard Deviation (ds) and Average
Height (Hx) of tree species (DBH ≥≥≥≥≥ 5 cm) selected in Areas 1 and 2.
The availability of horizontal physical space between trees minimized the effects of etiolation, a commonly phenomenon observed in densely populated areas. The combination of climatic, edaphic and topographical factors throughout time
bestowed a peculiar environment where according to Budowski (1963) a larger density of individuals of few species with small trunk diameters would have been expected. However, intense rains on an uncovered soil in a rough land selected species and 320
280
240
200
160
120
80
40
0
Number
of
individuals
Area 1
3-5 5-7 7-9 9-11
1
1-13
13-15 15-17 17-19 19-21 21-23
Classes of height (m) 0.2%
14.5%
27.3%27.9%
13.4%
5.8% 5.6%
2.7% 2.1%
0.5%
3-5 5-7 7-9 9-11
1
1-13 13-15 15-17 17-19 19-21 21-23
Classes of height (m)
Area 2 120
80
40
0
Number
of
individuals
2.4% 38.0%
30.3%
17.1%
11.1%
1.1%
reduced the number of individuals with the removal of propagule on the soil. At the same time, the verified inferior average height of the trees in this same area can also be related to the availability of physical space and abundant light, permitting greater energetic investment in lateral branches and trunks. From the architectural point of view, two possible reasons for the resulting forest cover can be suggested starting from an accentuated defo-restation followed by agricultural use of the soil as exemplified in Area 2: (1) The emergence and establishment of a new vegetational architecture characterized by being more open and smaller, or (2) now new architecture would be established, and a present vegetation cover still in process of succession of a secondary forest where the archi-tectural equality would be attained in a longer period of time. Initially the first appears to prevail. The emergence of new forest architectures as a result of environmental degradation is possible as cited by Furley & Ratter (1988) for the cerradão.
Also Gubert-Filho (1993) elaborated a system of forest classification defining diverse forest typo-logies resulting from anthropic actions. Never-theless, 25 years is a relatively short period of time in nature for diagnostics and prognostics, and a wait for more evidence is a more prudent attitude.
Structure of Abundance
The values of the tables of this item were processed electronically and the tables built orga-nizing the species by decreasing order of their VI’s. In spite of the controversy over their real ecological significance, this parameter served as a base for presentation of the results. The value of importance (VI) reveals the ecological importance relative to each species in each sample and is useful for se-parating different forest types as well as relating them to environmental factors (Habeck, 1968, apud
Martins, 1991).
Approximately 50% of the value of impor-tance (VI) in Area 1 concentrates on only 5 species:
Myrcia multiflora, Byrsonima sericea, Clusia nemorosa, Casearia guianensis and Stryphno-dendron purpureum (Table 2). In Area 2 in the
same way: Stryphnodendron purpureum, Vismia guaramirangae, Inga bahiensis, Cecropia palmata and Miconia albicans (Table 3). Within the above
mentioned species the Stryphnodendron purpureum
stands out due to the fact that it is a member of both of the groups of five species with the largest VI in the two areas, and because it presents the largest VI in Area 2. This last observation indicates a rustic species of easy adaptation, allowing its use in degraded neighboring areas that suffer from similar human anthropic activities.
In the remaining species of Area 1, i.e., those
not included in the group with the largest VI, a group made up of 10 species was found (24% of the total shown) with a maximum of two individuals shown (Table 2).
Within these species, two labeled as unknown and popularly known as farinha seca and cidreira,
although conceptually not considered as rare species according to Hubbell & Foster (1983), brought about the urgent need to preserve this area until other scientific work can be done to explain their taxonomy, rarity, endemism and risk of extinc-tion. In relation to unknown species 4 (sabiá) and
5 (bico de uru) the condition of rarity and
taxo-nomy were removed after the conclusion of this project, however, the unknown species 2 (casquim)
continued unidentified.
Analyzing Table 4 the following aspects in relation to the families shown in Areas 1 and 2 were observed: Area 1 showed 25 families (one unknown), thirteen more than Area 2; only the
Cecropiaceae documented in Area 2, was absent
in this area; The Myrtaceae and the Mimosaceae
contributed most to the species richness with 4 species each. Nevertheless the Myrtaceae stood out
as the most important structural family because it contained the highest number of individuals, corro-borating the presence of the Atlantic Forest in the State of Ceará. According to Negrelle (1995) the
Myrtaceae family has a representation and diversity
all along the distribution strip of the Atlantic Forest. In Area 2, 12 families (one unknown) were counted. The Mimosaceae was the most important,
contributing 65 individuals distributed in 5 species. The dominance of the Mimosaceae family is most
associated with the caatingas (Rodal, 1992),
TABLE 2
Arboreal species (DBH ≥≥≥≥≥ 5 cm) selected (Area 1) in decreasing order of VI and their respective
phytosociological parameters: Number of individuals (ne); Relative Density (DeR); Relative Frequency (FeR); Relative Dominance (DoR); Value of Importance (VI).
Species Family ne DeR FeR DoR VI
Myrcia multiflora DC. Myrtaceae 208 18.94 7.43 15.20 41.57
Byrsonima sericea DC. Malpighiaceae 121 11.02 7.43 21.82 40.26
Clusia nemorosa G. Mey. Clusiaceae 147 13.39 7.43 14.20 35.01
Casearia guianensis Urb. Flacourtiaceae 99 9.02 4.95 2.44 16.41
Stryphnodendron purpureum Ducke Mimosaceae 27 2.46 2.97 10.95 16.38
Erythroxylum citrifolium St. Hil. Erythroxylaceae 46 4.19 6.19 4.64 15.02
Byrsonima crispa Juss. Malpighiaceae 45 4.10 5.45 3.74 13.29
Myrcia rostrata DC. Myrtaceae 59 5.37 4.70 2.60 12.68
Protium heptaphyllum (Aubl.) March. Burseraceae 40 3.64 5.69 1.89 11.22
Miconia albicans Triana Melastomataceae 45 4.10 3.96 0.99 9.05
Rapanea guianensis Aubl. Myrsinaceae 34 3.10 3.47 1.94 8.50
Xylopia sericea St. Hil. Annonaceae 28 2.55 3.22 2.42 8.19
Buchenavia capitata Eichl. Combretaceae 12 1.09 2.72 4.21 8.03
Desconhecida 2 (casquim*) 21 1.91 3.22 2.63 7.77
Myrcia prunifolia DC. Myrtaceae 26 2.37 4.21 1.05 7.63
Jacaranda heteroptila Bur. & Schum. Bignoniaceae 18 1.64 2.97 2.55 7.16
Nectandra mollis Nees Lauraceae 18 1.64 3.47 1.85 6.96
Simarouba amara Aubl. Simaroubaceae 23 2.09 3.22 0.92 6.23
Vismia guaramirangae Hub. Clusiaceae 7 0.64 1.73 0.33 2.70
Manilkara rufula Miq. Sapotaceae 7 0.64 1.73 0.31 2.68
Guazuma ulmifolia Lam. Sterculiaceae 7 0.64 1.73 0.22 2.59
Guarea tuberculata Vell. Meliaceae 5 0.46 1.24 0.22 1.91
Copaifera cearensis Hub. Caesalpiniaceae 5 0.46 0.99 0.13 1.57
Spondias lutea L. Anacardiaceae 5 0.46 0.99 0.10 1.54
Albizia polycephala (Benth.) Killip Mimosaceae 3 0.27 0.74 0.30 1.32
Sapium lanceolatum Huber Euphorbiaceae 3 0.27 0.74 0.25 1.26
Garcinia gardneriana Pl. & Tr. Clusiaceae 4 0.36 0.74 0.09 1.19
Artocarpus integrifolia L. Moraceae 3 0.27 0.50 0.35 1.12
Desconhecida 1 (farinha seca*) 2 0.18 0.50 0.34 1.02
Ficus calyptroceras Miq. Moraceae 2 0.18 0.50 0.33 1.01
Tabebuia serratifolia (Vahl.) Nich. Bignoniaceae 3 0.27 0.50 0.21 0.98
Guapira opposita (Vell.) Reitz. Nyctaginaceae 3 0.27 0.50 0.11 0.88
Inga bahiensis Benth. Mimosaceae 2 0.18 0.50 0.16 0.83
Coutarea hexandra (Jacqp.) H. Schum Rubiaceae 3 0.27 0.50 0.04 0.81
Syzygium jambos (L.) Alstron Myrtaceae 2 0.18 0.50 0.06 0.74
Desconhecida 3 (cidreira*) 2 0.18 0.50 0.05 0.73
Zanthoxylum rhoifolium Lam. Rutaceae 2 0.18 0.50 0.04 0.72
Desconhecida 4 (sabiá*) 3 0.27 0.25 0.20 0.72
Structure of size
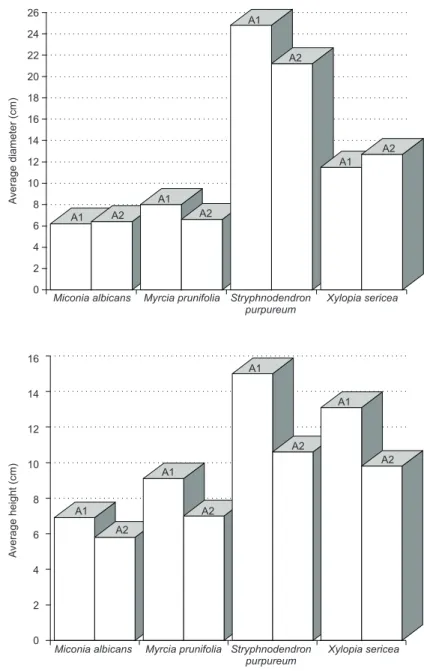
In considering only populations with at least 12 individuals (minimum number of mother trees in a population capable of guaranteeing a rea-sonable genetic diversity, Kageyama et al., 1992)
and in comparing (diameters and heights) within these species only those common in Areas 1 and 2 (Fig. 3), it was verified that while the heights of the species Miconia albicans, Myrcia prunifolia, Stryphnodendron purpureum and Xylopia sericea
exemplified a tendency to be larger in Area 1 (also observed in the architectural approach), the dia-meter in no way revealed that it could also indicate a standard or a tendency, i.e., no diametric
su-premacy appeared to have occurred in one area over another. This lack of diametric tendency appears to be related to the existence of marks in different successive time periods in the areas, not forming forests homogeneous in age, but rather a forest mosaic in constant transformation.
Similarity
The forest surveys carried out in Areas 1 and 2 and submitted to comparative binary and quan-titative treatment (presence/absence) of the species, allowed the evaluation of the impact of the defo-restation which occurred in Area 2. With reference to deforestation, the results of the binary (60%) and quantitative (36%) similarity clearly showed the damage caused to the forest. In addition to the 28 less species in the formerly deforested area and a current densely distinct floristic composition, three new species established themselves in the area: Cecropia palmata, Croton floribundus and Inga marginata. The arboreal Cecropia palmata
which occurs naturally in the mountains, appears to be a strong indicator of areas which suffer intense human activity since it occurs abundantly and in a general way in Area 2 and in adjacent areas which have undergone visibly similar damaging actions.
TABLE 3
Tree species (DBH ≥≥≥≥≥ 5 cm) selected (Area 2) in decreasing order of VI and their respective phytosociological
parameters: Number of individuals (ne); Relative Density (DeR); Relative Frequency (FeR); Relative Dominance (DoR); Value of Importance (VI).
Species Family ne DeR FeR DoR VI
Stryphnodendron purpureum Ducke Mimosaceae 25 8.71 8.70 22.26 39.67
Vismia guaramirangae Hub. Clusiaceae 53 18.47 10.87 7.54 36.87
Inga bahiensis Benth. Mimosaceae 18 6.27 8.70 20.90 35.87
Cecropia palmata Willd. Cecropiaceae 21 7.32 5.80 12.42 25.53
Miconia albicans Triana Melastomataceae 37 12.89 8.70 3.05 24.63
Zanthoxylum rhoifolium Lam. Rutaceae 31 10.80 10.14 3.18 24.13
Croton floribundus Spreng. Euphorbiaceae 16 5.57 7.25 7.30 20.12
Xylopia sericea St. Hil. Annonaceae 17 5.92 7.25 5.87 19.04
Inga marginata Willd. Mimosaceae 6 2.09 4.35 7.69 14.13
Myrcia prunifolia DC. Myrtaceae 12 4.18 5.07 1.05 10.30
Albizia polycephala (Benth.) Killip Mimosaceae 8 2.79 3.62 2.22 8.64
Byrsonima sericea DC. Malpighiaceae 8 2.79 2.90 0.94 6.63
Desconhecida 1 4 1.39 2.90 2.30 6.59
Pithecellobium trapezifolium Benth. Mimosaceae 8 2.79 2.90 0.87 6.56
Copaifera cearensis Hub. Caesalpiniaceae 6 2.09 3.62 0.61 6.32
Myrcia multiflora DC. Myrtaceae 8 2.79 2.17 0.97 5.93
Miconia sp. Melastomataceae 6 2.09 2.90 0.50 5.49
Jacaranda heteroptila Bur. & Schum. Bignoniaceae 3 1.05 2.17 0.33 3.54
The quality of the indicator here signifies pioneerism in the successional process and this attribute is also commonly cited in literature (Gan-dolfi, 1991) for this species. The Croton flori-bundus which appears to proceed from lower areas
or the western slope of the mountain range (drier areas) was not as generalized as the Cecropia pal-mata, not having been observed in abundance or
characterizing adjacent areas physionomically. Finally, the Inga marginata was introduced in the
past in order to provide shade for the coffee plan-tation and established itself satisfactorily as well as the Inga bahiensis. In spite of possible sampling,
processing and interpretation errors, the result that
determined 28 fewer species in Area 2 (deforested), appears to be sufficient to caution about the risks of survival of the local flora and fauna in the near future as this local model of development conti-nues.
Phytodiversity
In Area 1 (0.6 ha) 1098 live individuals be-longing to 42 species distributed among 25 families were registered and in Area 2 (0.3 ha), 287 in-dividuals belonging to 18 species and 12 families (Table 2 and 3). Five species labeled as unknown were not identified, being included in a single family denominated as Unknown.
TABLE 4
Families selected (Areas 1 and 2) in decreasing order of ne: Number of individuals (ne); Number of species (nsp).
Family/A1 ne nsp %nsp Family/A2 ne nsp %nsp
Myrtaceae 295 4 9.52 Mimosaceae 65 5 27.78
Malpighiaceae 166 2 4.76 Clusiaceae 53 1 5.56
Clusiaceae 158 3 7.14 Melastomataceae 43 2 11.11
Mimosaceae 34 4 9.52 Cecropiaceae 21 1 5.56
Flacourtiaceae 99 1 2.38 Rutaceae 31 1 5.56
Erythroxylaceae 46 1 2.38 Euphorbiaceae 16 1 5.56
Burseraceae 40 1 2.38 Annonaceae 17 1 5.56
Desconhecida 30 5 11.90 Myrtaceae 20 2 11.11
Melastomataceae 47 2 4.76 Malpighiaceae 8 1 5.56
Myrsinaceae 34 1 2.38 Desconhecida 4 1 5.56
Annonaceae 28 1 2.38 Caesalpiniaceae 6 1 5.56
Combretaceae 12 1 2.38 Bignoniaceae 3 1 5.56
Bignoniaceae 21 2 4.76
Lauraceae 18 1 2.38
Simaroubaceae 23 1 2.38
Sapotaceae 7 1 2.38
Sterculiaceae 7 1 2.38
Meliaceae 5 1 2.38
Moraceae 5 2 4.76
Caesalpiniaceae 5 1 2.38
Anacardinaceae 5 1 2.38
Rutaceae 4 2 4.76
Euphorbiaceae 3 1 2.38
Nyctaginaceae 3 1 2.38
Rubiaceae 3 1 2.38
In comparing Areas 1 and 2 according to their floristic richness or simply by the total number of species counted (McIntosh, 1967, apud Stiling,
1996), 57% less richness (24 species) was verified in Area 2. At the same time, Shannon’s diversity indices pointed to a inferior diversity in Area 2, even when all the species were given equal abun-dance (E) (Table 5). According to Gentry (1988) the size of the sample significantly influences the
index of diversity obtained, however, this loss of floristic richness did not occur exclusively due to the 50% smaller size of the sample Area 2, since even spatially equaling the sample areas involved,
i.e. doubling the area size of Area 2 and
propor-tionally inferring an increase in the number of species for this area, the hypothetical value obtained (36 species) would also be inferior to that of Area 1.
A
verage
diameter
(cm)
A
verage
height
(cm)
26
24
22
20
18
16
14
12
10
8
6
4
2
0
16
14
12
10
8
6
4
2
0
Miconia albicans
Miconia albicans
Myrcia prunifolia
Myrcia prunifolia
Stryphnodendron purpureum
Stryphnodendron purpureum
Xylopia sericea
Xylopia sericea
A1
A1
A1
A1
A1 A1
A1
A1 A2
A2
A2
A2
A2
A2 A2
A2
However, this reduction in phytodiversity could be principally related to a manifestation of the soil to the damage suffered where hypothetically the neighboring areas could subsidize the damaged areas, thus a greater phytodiversity could be gua-ranteed.
REFERENCES
BUDOWSKI, G., 1963, Forest succession in tropical low-lands. Turrialba,13(1): 42-44.
FELFILI, J. M., SILVA-JUNIOR, M. C., RESENDE, A. V., MACHADO, J. W. B., WALTER, B. M. T., SILVA, P. E. N. & HAY, J. D., 1993, Análise comparativa da florística e fitossociologia da vegetação arbórea do cerrado sensu stricto na chapada Pratinha, DF, Brasil. Acta Bot. Bras., 6(2): 27-46.
FIDALGO, O. & BONONI, V. L. R., 1984, Técnicas de coleta, preservação e herborização de material botânico.
Instituto de Botânica, São Paulo, 106p.
FIGUEIREDO, M. A., LIMA-VERDE, L. W. & PAULA, L., 1995, A Mata Atlântica no Ceará. Anais 6o Congresso
Nordestino de Ecologia, João Pessoa, pp. 20-25.
FUNCEME, 1994, Geossistemas e potencialidades dos re-cursos naturais: Serra de Baturité e áreas sertanejas pe-riféricas. DETEC, Fortaleza, 111p.
FURLEY, P. A. & RATTER, J. A., 1988, Soil resources and plant communities of central Brazilian cerrado and their development. J. of Biogeography, 15: 97-108.
GANDOLFI, S., 1991, Estudo florístico e fitossociológico de uma floresta residual na área do aeroporto interna-cional de São Paulo, município de Guarulhos, SP.
Disser-tação de Mestrado, Unicamp, Campinas.
GENTRY, A. H., 1988, Changes in plant community diversity and floristic composition on enviromental and geographi-cal gradients. Annals of the Missouri Botanical Garden, 75(1): 1-34.
GUBERT-FILHO, A., 1993, A tipologia florestal determinada pelo fator antrópico. Anais I Congresso Florestal Pana-mericano, Curitiba, pp. 1-5.
TABLE 5
Shannon’s indices of diversity (H’), maximum diversity (Hmax) and Evenness (E) of the sample Areas 1 and 2.
Sample area H’ Hmax E
1 2.85 3.74 0.76
2 2.60 2.89 0.90
HUBBELL, S. P. & FOSTER, R. B., 1983, Diversity of canopy trees in a neotropical forest and implications for conservation. In: S. L. SUTTON, T. C. WHITMORE & A. C. CHADWICK. Tropical rain forest: ecology and management. Brit Ecol. Soc. Special Pub, n. 2, Blackwell
Scientific, Oxford, pp. 25-41.
IBGE, 1992, Manual técnico da vegetação brasileira. CDDI, Rio de Janeiro, 92p.
KAGEYAMA, P. Y., 1992, Recomposição da vegetação com espécies arbóreas nativas em reservatórios de usinas hidrelétricas da CESP. Série Técnica IPEF,8(25): 30-34. LEITE, F. A. B. & MARQUES, J. N., 1998, Solos. In:
IPLANCE, Atlas do Ceará. Fortaleza, pp. 16-17.
MARTINS, F. R., 1991, Estrutura de uma floresta mesófila. Unicamp, Campinas, 246p.
MATTEUCCI, S. D. & COLMA, A., 1982, Metodologia para el estudio de la vegetación. Secretaría General de la
OEA, Washington, D.C, 163p.
MELLER-DOMBOIS, D. & ELLENBERG, H., 1974, Aims and methods of vegetation ecology. John Wiley & Sons, New York, 574p.
NEGRELLE, R. R. B., 1995, Composição florística, estru-tura fitossociológica e dinâmica de regeneração da Flo-resta Atlântica na reserva Volta Velha, mun. Itapoá, SC. Tese de Doutorado, UFSCar, São Carlos.
NIMER, E., 1989, Climatologia do Brasil. IBGE/CDDI, Rio de Janeiro, 421p.
PNUD/FAO/IBAMA/SEMACE, 1994, Mapeamento da co-bertura florestal nativa lenhosa do Estado do Ceará. SEMACE, Fortaleza, 47p.
RODAL, M. J. N., 1992, Fitossociologia da vegetação arbustivo-arbórea em quatro áreas de caatinga em Pernambuco. Tese de Doutorado, Unicamp, Campinas.
SHEPHERD, G. J., 1995, FITOPAC 1. Manual do usuário.
Departamento de Botânica, Unicamp.
STILING, P. D., 1996, Ecology. Theories and Applicacions.