SOIL CO
2EMISSION OF SUGARCANE FIELDS AS
AFFECTED BY TOPOGRAPHY
Liziane de Figueiredo Brito1*; José Marques Júnior2; Gener Tadeu Pereira1; Zigomar Menezes Souza3; Newton La Scala Júnior1
1
UNESP/FCAV Depto. de Ciências Exatas, Via de Acesso Prof. Paulo Donato Castellane, s/n 14884900 -Jaboticabal, SP - Brasil.
2
UNESP/FCAV - Depto. de Solos e Adubos. 3
UNICAMP/FEAGRI, C.P. 6011 - 13083-875 - Campinas, SP - Brasil. *Corresponding author <[email protected]>
ABSTRACT: The spatial and temporal variation of soil CO2 emission is influenced by several soil attributes related to CO2 production and its diffusion in the soil. However, few studies aiming to understand the effect of topography on the variability of CO2 emissions exist, especially for cropping areas of tropical regions. The objective of this study was to evaluate the spatial and temporal changes of soil CO2 emission and its relation to soil attributes in an area currently cropped with sugarcane under different relief forms and slope positions. Mean CO2 emissions in the studied period (seven months) varied between 0.23 and 0.71, 0.27 and 0.90, and 0.31 and 0.80 g m–2 h–1 of CO2 for concave (Conc), backslope (BackS) and footslope (FootS) positions, respectively. The temporal variability of CO2 emissions in each area was explained by an exponential relation between the CO2 emission and soil temperature and a linear relation between CO2 emission and soil water content. The Q10 values were 1.98 (± 0.34), 1.81 (± 0.49) and 1.71 (± 0.31) for Conc, BackS and FootS, respectively. Bulk density, macroporosity, penetration resistance, aggregation and oxidizable organic carbon content explain the changes in soil CO2 emission observed, especially when the Conc position was compared to BackS. The effect of relief form and topographic position on soil CO2 emission variation was dependent on the time of measurement.
Key words: soil respiration, temporal variation, spatial variation, soil attributes, soil porosity
EMISSÃO DE CO
2DO SOLO SOB CULTIVO DE CANA-DE-AÇÚCAR
EM FUNÇÃO DA TOPOGRAFIA
RESUMO: A variação temporal e espacial da emissão de CO2 solo-atmosfera é influenciada por inúmeros atributos do solo relacionados à produção de CO2 e à difusão do gás no solo. Ainda são escassos, entretanto, estudos visando compreender o efeito da topografia na variação da emissão deste gás, especialmente em áreas agrícolas da região tropical. O objetivo deste trabalho foi estudar a variação temporal e espacial da emissão de CO2 solo-atmosfera e sua relação com atributos do solo em área de cultivo de cana-de-açúcar sob diferentes formas de relevo e posições na encosta. A média da emissão de CO2 no período de sete meses de estudo variou entre 0,23 e 0,71; 0,27 e 0,90 e 0,31 e 0.80 g CO2 m–2 h–1, nas posições côncava (Conc), encosta superior (BackS) e encosta inferior (FootS), respectivamente. A variação temporal da emissão em cada uma das áreas foi explicada por uma relação exponencial entre emissão de CO2 e temperatura do solo, e uma relação linear da emissão deste gás com a umidade do solo. O valor de
Q10 foi 1,98 (± 0,34); 1,81 (± 0,49) e 1,71 (± 0,31) para Conc, BackS e FootS, respectivamente. Densidade do solo, macroporosidade, resistência do solo à penetração, agregação e conteúdo de carbono orgânico oxidável explicaram as variações observadas na emissão de CO2, especialmente quando se compara a posição côncava com a encosta superior. O efeito do relevo e da posição topográfica sobre a variação da emissão de CO2 do solo foi dependente da época de amostragem.
Palavras-chave: respiração do solo, variação temporal, variação espacial, atributos do solo, porosidade do solo
INTRODUCTION
Soil CO2 emission is an important component of the global carbon cycle (Raich & Schlesinger,
sources of CO2 production, and the transport of the gas is governed by diffusion. These processes, in turn, are influenced by several attributes that establish the spatial and temporal variations of soil CO2 emission. Soil temperature and soil water content, or the inter-action between both, are the main controlling factors of the variability of soil respiration (Kang et al., 2003; Kang et al., 2000). Besides temperature and water, the spatial variability of soil respiration is also controlled by organic carbon, microbial biomass, root biomass, litter, nutrients (N, Mg, Ca, P), pH, cation exchange capacity, iron oxide content, bulk density and poros-ity (Epron et al., 2006; Xu & Qi, 2001; La Scala Júnior et al., 2000; Fang et al., 1998).
Changes in CO2 emissions and soil chemical, physical and biological properties have been reported to be related to land exposition and slope length (Kang et al., 2006; Kang et al., 2003), microtopography (Jia et al., 2003), slope position (Risch & Frank, 2006; Hanson et al., 1993), slope angle (Silva et al., 2004) and relief form (Souza et al., 2006; Souza et al., 2004a,b,c; Souza et al., 2003). Such topographic as-pects affect ground and underground water flows, constituting the major cause of spatial variability of soil attributes (Daniels & Hammer, 1992).
Nowadays, in the worldwide scenario, Brazil is the main sugarcane (Saccharum spp.) producer, with 6.96 million cropped hectares. This area represents al-most 11.5% of the total cropped area with the main Brazilian agricultural products. São Paulo is the major sugarcane producer state, with 3.68 million hectares, corresponding to 52.9% of the total area cropped with sugarcane in Brazil. Considering that the total area cropped with sugarcane increases every year, reach-ing a 13% increase in 2007/2008 in relation to 2006/ 2007 (Conab, 2008), studying the spatial and tempo-ral changes of soil CO2 emission in such agrosystem is of great interest.
The objective of this work was to identify the topographic effect on spatial and temporal variations of soil CO2 emission in an area currently cropped with sugarcane in the Southeastern region of Brazil, and to determine the soil attributes that control such varia-tions.
MATERIAL AND METHODS
The experiment was carried out on the Santa Isabel Farm located at 21º17’ to 21º18’ S and 48º08’ to 48º10’ W, in Jaboticabal, São Paulo state, Brazil, where sugarcane has been cropped for over 60 years and mechanically harvested (green) for over the last ten years. The climate of the region is characterized by tropical rainy summers and dry winters, being
clas-sified as Aw by Köepen. The average temperature is 24.3ºC and 18.8ºC for January and July, respectively, while the average year precipitation is around 1425 mm, with total monthly precipitations of 239.5 mm and 25.3 mm for January and July, respectively. The soil is classified as Typic Eutrustox.
The topography of the area presents two re-lief forms, one concave occurring in the highest posi-tion of the landscape, and the other linear, towards the hillside, as described in Souza et al. (2003). The sam-plings were performed in a 100 × 100 m limited area in the concave form (Conc) and in two positions in the linear form, backslope (BackS) and footslope (FootS) (Figure 1).
Soil CO2 emission measurements were con-ducted during 17 days, from April 28 (one month af-ter sugarcane plantation) to November 23, 2004, with ten randomized replicates for each area in each sam-pling day. The evaluations were conducted in the morning (9–11 h) or in the afternoon (14–16 h), and in some days with measurements conducted in morn-ings and afternoons, using a flux chamber (LI-6400-09 CO2, LI-COR, NE, USA) according to Healy et al. (1996). The chamber is a closed system with an in-ternal volume of 991 cm3 and soil exposed area of 71.6 cm2
, and coupled to a LI-6400 photosynthesis system that analyzes the CO2 concentration by infrared gas absorption. The chamber was placed on the top of PVC soil collars installed in the field, between rows, some days before the measurements, eliminating the CO2 flush out effect due to the ring insertion in soil.
Soil temperature (T) was evaluated by a sen-sor connected to the chamber on each one of the ten evaluation points of CO2 emission at a depth of 0–0.15
m on the 17 sampling days. Gravimetric soil water con-tent (GM) was determined on 11 of the 17 days of study, in the same replicates and depths (Gardner, 1986).
Soil analysis was made on disturbed and un-disturbed soil samples, with five replicates in each area. Soil bulk density was determined on undisturbed soil cores (0.04 m long and 0.05 m diameter) (Embrapa, 1997). Total porosity (TP) was calculated based on soil bulk density. Pore size distribution (macroporosity - Macro; microporosity - Micro) was determined based on soil water retention using a tension table (Embrapa, 1997).
Aggregate stability (Kemper & Rosenau, 1986) was determined by sieving in water, with aggregates that passed through a 7.93-mm sieve and were retained in a 4.76-mm sieve, and then separated in classes us-ing a set of sieves of meshes of 4.76 mm, 2 mm, 1 mm, 0.5 mm and 0.25 mm. Results were expressed in terms of geometric mean diameter (GMD), percent-age of aggregates larger than 2 mm (∅ > 2 mm), per-centage of aggregates between 2–1 mm (∅ 2-1 mm) and percentage of aggregates smaller than 1 mm (∅ <1 mm).
The soil sampled with an auger was passed through a 2-mm sieve to determine particle-size dis-tribution (pipette and sieving method, after the soil samples had been dispersed chemically in a 0.1 M NaOH solution and mechanically in low-rotation agi-tation for 16 hours, modified by Embrapa (1997)), Fe2O3 content (extracted with sulphuric acid) (Embrapa, 1979) and oxidizable organic carbon con-tent (CO) (Raij et al., 1987).
Penetration resistance (PR) was measured using an impact penetrometer (IAA/PLANALSUCAR -STOLF), according to Stolf (1991), with ten replicates in each area, down to the depth of 0.15 m. When per-forming the penetration resistance tests, soil samples were taken for GM determination, down to the same depth.
All soil attributes were evaluated by the analy-sis of variance using the following models for each set of response variables: (1st) soil CO2 emission, soil temperature and soil water content: Yij= m + Pi +
Error(a) + Tj + PiTj+ Error(b), Yij being the value of each observation, m the general mean, Pi the effect of the topographic position i, Error(a) the plot error,
Tj the effect of time j, PiTj the effect of the interac-tion between topographic posiinterac-tion and time, Error(b) the general error; and (2nd) for other evaluated at-tributes: Yij= m + Pi + Error(geral), Yij being the value of each observation,
m
the general mean, Pi the ef-fect of the topographic position i, Error(geral) the gen-eral error. Tukey’s test was applied for the multiplecomparisons of the means with 10% of probability. All statistical results were obtained by the SAS/Statistical Analysis Systems software package (SAS Institute, 1998).
RESULTS AND DISCUSSION
Soil CO2 emission variability
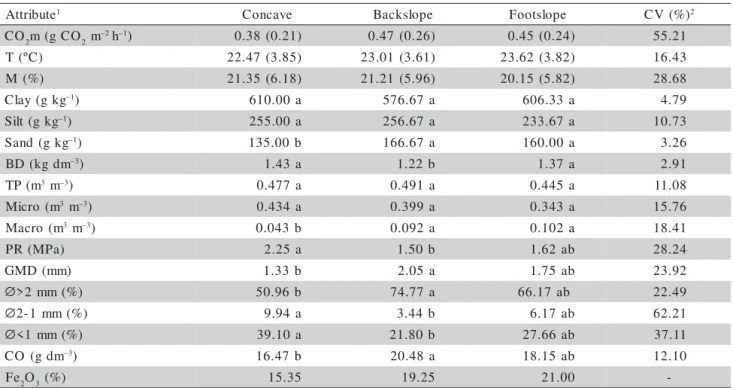
Soil CO2 emission throughout the 7-month pe-riod in different landscape positions (Figure 2), had mean values for Conc, BackS and FootS of 0.38, 0.47 and 0.45 g CO2 m–2 h–1 (Table 1), respectively, and their variation during this period was above 200%. The BackS area presented mean emissions values between 0.27 and 0.90 g CO2 m–2 h–1. This variation is a con-sequence of the local climate. The lowest emissions are observed in the winter (June 20 to September 21, 2004, Figure 2), which is characterized by lower pre-cipitation and temperatures. Campos (2003) reports smaller values for annual means of soil CO2 emission in sugarcane areas in both the traditional slash and burn-ing manual harvestburn-ing system (0.13 g CO2 m–2
h–1 ) and the mechanized harvesting without trash burning (0.14 g CO2 m–2 h–1). Despite these lower values, the author also found a variation of 200% in CO2 emission (0.07 to 0.21 g CO2 m–2
h–1
) throughout the 11-month cul-ture cycle.
The great temporal variability in CO2 emission presented in our study shows the importance of evaluating emissions in different land conditions and time scales. Since CO2 emission is affected by a large number of factors, when extrapolating emissions for larger areas it is important to take into account its spatial and temporal controls, like soil temperature, moisture, texture, litter stocks and topographical po-sition (Sotta et al., 2006). Indirect estimates based on the difference in soil organic carbon stocks are
Figure 2 - Soil-atmosphere CO2 emission in the concave (Conc), backslope (BackS) and footslope (FootS) positions. Evaluations performed from April 28 to November 23, 2004. The letters indicate the evaluations where differences in CO2 emission were observed between the positions on the same day (Tukey, p < 0.1).
0.2 0.3 0.4 0.5 0.6 0.7 0.8 0.9 1
90 120 150 180 210Month240 270 300 330
Conc BackS FootS
MAI JUN JUL AUG SEP OCT NOV DEC
a
a a
c b b
b a b
a
c b
b b
b
a
b
c
Soil
CO
emission
(g
m
g
)
2
2
––
also used for predictions of soil carbon losses. Changes in soil organic carbon stocks due to land use in Brazil were estimated using a map of different soil-vegetation associations combined with results from a soil database (Bernoux et al., 2001, 2002).
Differences (p < 0.1) found in mean soil CO2 emissions on a same day, when topographic positions were compared, indicate seasonallity dependence (Fig-ure 2). Hanson et al. (1993) also found differences in CO2 emission in some evaluations, but not for the whole period of study, when comparing emissions from areas in different topographic positions (top, slope or valley). The topography effect on soil CO2 emis-sion was observed especially in the first days of the experiment, when the soil was found almost bare with no vegetation. The fact that the differences in the emis-sions between the positions were not maintained dur-ing the whole experiment is probably related to other factors, such as the contribution of root respiration with the development of the root system of the sugarcane, in agreement with Parkin et al. (2005). According to these authors, root respiration masked the effect of topography on soil CO2 emission, since such effect is greater on maize crops, a grassy crop like sugarcane, than on soybean crops.
During the first days of the experiment, the BackS area presented the highest emissions in relation to those observed in the Conc and FootS areas (p < 0.10) (Figure 2), indicating that soil CO2 emission is different in relation to topographic positions. Other au-thors report a significant increase in soil CO2 emission in the descending direction of the hillside, with higher emissions in the lower positions of the hillslope when compared to top positions. This is related to the con-tribution of erosion, since, in the lowered parts, an in-crease in soil surface biomass (Risch & Frank, 2006), thickness and organic matter content of the A horizons and crop productivity (DeJong, 1981) is observed. However, the increase in CO2 emission in our study did not occur in this direction along the hillside. The soil cover from crop residues has probably provided greater protection against erosion processes, prevent-ing soil loss and reduction in surface organic carbon, since the area in the higher positions presented higher soil CO2 emission and organic carbon content (Table 1). On the other hand, when comparing Conc with lin-ear relief forms (BackS and FootS), it was observed that the relief form did not always determine differ-ences in CO2 emission at the beginning of the experi-ment, since on some days no difference was observed between Conc and FootS emissions.
e t u b i r t t
A 1 Concave Backslope Footslope CV(%)2
O
C 2m(gCO2m–2h–1) 0.38(0.21) 0.47 (0.26) 0.45(0.24) 55.21
) C º (
T 22.47(3.85) 23.01 (3.61) 23.62(3.82) 16.43
) % (
M 21.35(6.18) 21.21 (5.96) 20.15(5.82) 28.68
g k g ( y a l
C –1) 610.00a 576.67a 606.33 a 4.79
g k g ( t l i
S –1) 255.00a 256.67a 233.67 a 10.73
g k g ( d n a
S –1) 135.00b 166.67a 160.00 a 3.26
m d g k ( D
B –3) 1.43a 1.22b 1.37 a 2.91
m ( P
T 3m–3) 0.477a 0.491a 0.445 a 11.08
m ( o r c i
M 3m–3) 0.434a 0.399a 0.343 a 15.76
m ( o r c a
M 3m–3) 0.043b 0.092a 0.102 a 18.41
) a P M ( R
P 2.25a 1.50b 1.62ab 28.24
) m m ( D M
G 1.33b 2.05a 1.75ab 23.92
∅>2mm(%) 50.96b 74.77a 66.17ab 22.49
∅2-1mm(%) 9.94a 3.44b 6.17ab 62.21
∅<1mm(%) 39.10a 21.80b 27.66ab 37.11
m d g ( O
C –3) 16.47b 20.48a 18.15ab 12.10
e
F 2O3(%) 15.35 19.25 21.00
-Table 1 - CO2 emission and soil attributes evaluated in the concave, backslope and footslope positions at a depth of 0–0.15m on a sugarcane culture area.
1CO
2m, T and M (mean soil CO2 emission, temperature and moisture over the studied period and their respective standard errors in
Variation in soil attributes
BackS had the lowest soil bulk density, high-est macroporosity, highhigh-est geometric mean particle di-ameter, highest percentage of aggregates with diam-eter larger than 2 mm, the smallest percentage of ag-gregates with diameter between 2 and 1 mm, smallest percentage of aggregates with diameter smaller that 1 mm, smallest soil penetration resistance and highest oxidizable organic carbon content when compared with Conc (p < 0.1) (Table 1). Considering the same soil attributes, the values for FootS were between those found for the Conc and BackS areas, differing from BackS in relation to bulk density and from Conc in re-lation to macroporosity only. These results reinforce the influence of topographic position and/or relief form on soil attributes.
The area presenting the smallest bulk density and penetration resistance and the highest macroporosity was the one that presented the highest CO2 emission (BackS) (Table 1 and Figure 2). This result shows the importance of the soil porous space for gaseous transport and, consequently, for micro-bial activity, which is in aggreament with the results found by Xu & Qi (2001). Higher total porosity fa-cilitates oxygen entrance into the soil, favoring respi-ration and, consequently, increasing CO2 emissions (Fang et al., 1998). Although total porosity values for Conc, BackS and FootS were similar, the highest emissions were observed on the sites with higher macroporosity. This indicates the influence of pore size distribution on emissions, since soil gas diffusion, according to Fick’s law: (where ECO2 is the soil CO2 emission, −DCOar2 the diffusion coefficient of the gas in the air, (TP – M) the water free porosity, and (L / Le)2 the tortuosity factor) (Alvenäs & Jansson, 1997), is not only dependent on total porosity (TP), but also on tortuosity. Thus, macro and micropore dis-tribution determines the possible trajectories of gases in the soil, affecting both the entrance of O2 and the release of CO2.
Differences observed in Fe2O3 and oxidizable organic carbon content between topographic positions are coherent with the results obtained for aggregate stability indexes (GMD, <∅2 mm, ∅2-1 mm and <1 mm, Table 1), confirming the positive relation between these attributes and aggregation (Oades, 1984; Schwertmann & Taylor, 1989). Despite the physical protection by the organic matter associated with ag-gregation, the highest CO2 emissions were observed in BackS, which was probably due to the higher oxi-dizable organic carbon content of this area. A positive association between CO2 emissions and soil organic carbon was also found by Xu & Qi (2001) and La
Scala Júnior et al. (2000). Yoo et al. (2006) reported higher emissions in relation to higher soil organic car-bon content available for microbial activity.
CO2 temporal emission and its relationship with soil temperature and moisture
Soil temperature throughout the period varied between 17.8 and 30.6ºC, the lowest value being ob-served in Conc and the highest in FootS. Mean values for each day varied between 17.9 to 30.2ºC, 18.8 to 29.1ºC and 18.9 to 30.6ºC for Conc, BackS and FootS, respectively. Comparing the areas, the major differ-ences of daily mean temperature were observed be-tween Conc and FootS, being higher in FootS in 9 of the 17 sampled days (Tukey, p < 0.1). The tempera-tures for BackS did not differ from the other areas in most of the observations. Considering the data from the 17 evaluations, the coefficient of variation (CV) for temperature was 16.43%. Analyzing the data from each day, this variation is lower, with CV values be-tween 1.39 and 8.25%, except for one observation where CV was 13.15%.
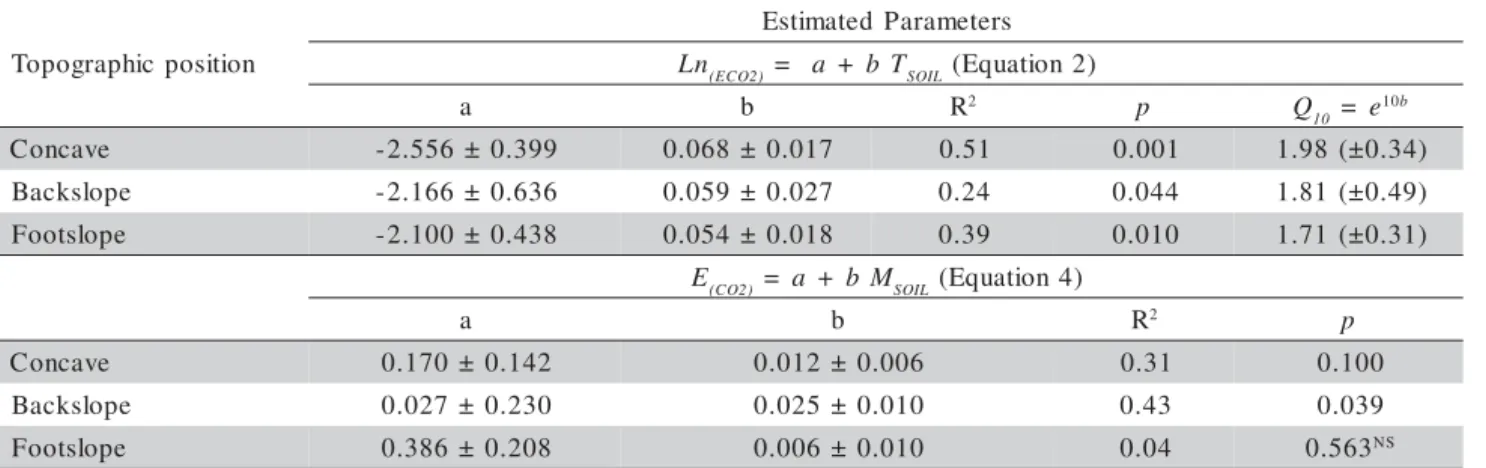
The temporal variability of soil CO2 emission in the different positions was explained by an expo-nential relation of emission to soil temperature (Fang & Moncrieff, 2001; Xu & Qi, 2001; Lloyd & Taylor, 1994). Model ECO2 = ae–bTSOIL (Equation 1) was
fit-ted to a linear relationship, thus obtaining a model of the type Ln (ECO2)= a + bTSOIL(Equation 2), which
presented the best adjustment based on the coefficient of determination of the model (R2) for Conc in rela-tion to other linearly located areas (Table 2). Tempera-ture accounted for 24 to 51% of the CO2 emission changes, which is related to the smaller variation in soil temperature (CV of 1.39 to 13.15%) in relation to the variation of CO2 emission (CV of 19.3 to 61.3%).
The estimation of Q10, which represents the sensitivity of CO2 emission to a 10-degree-celsius in-crease in soil temperature was calculated by the equa-tion Q10 = e10b (Equation 3) for each topographic
posi-tion, where b stems from Equation 2 previously pre-sented. The results obtained for Conc, BackS and FootS were 1.98 (± 0.34), 1.81 (± 0.49) and 1.71 (± 0.31), respectively, being close to values previously reported in the literature (Lloyd & Taylor, 1994; Raich & Schlesinger, 1992). By comparing topographic po-sitions Conc and BackS, it was observed that Conc presented a lower Q10 value and better aggregate sta-bility (Table 1). This result, according to Davidson & Janssens (2006), may stem from greater physical pro-tection from soil organic matter and, consequently, from a reduction in emission sensitivity in relation to soil temperature in these areas. Nevertheless, when considering the three topographic positions, it was not dx
dC Le L M TP D
E ar
CO
CO ( )( / ) /
2
2
possible to draw any conclusions concerning this re-lationship between aggregation and Q10, since FootS presented the lowest Q10 value, and did not differ from the other areas in relation to aggregation.
Considering the studied period the mean soil water content varied from 13.2 to 29.7%, 14.6 to 30.5% and 12.6 to 28.5% for Conc, BackS and FootS, respectively. Soil water contents were affected by the position in the slope, since the major differences were observed between BackS and FootS (Tukey, p < 0.1). The CV value for the total period was 28.68%, and analyzing the variation during each day, the CV varied from 5.72 to 24.37%.
The temporal variability of CO2 emission could be explained by a linear relation with soil water con-tent (E(CO2) = a + bMSOIL) (Equation 4) in Conc and BackS only (p < 0.1) (Table 2). Soil water content ac-counted for 31 and 43% of the emission variation for those areas, respectively. The lack of relationship be-tween soil water content and emissions in FootS sug-gests that the effect of the soil water content is de-pendent on the topographic position.
In summary, soil temperature affected the temporal changes in soil CO2 emission in all areas while the effect of soil water content was evident only in Conc and BackS. Other researchers report the effect of these factors on emission changes. Soil respiration was dominantly controlled by temperature in a moun-tain area in China, since the influence of moisture was observed only when it was a limiting factor (Li et al., 2007). Reth et al. (2005) also related a relation between soil moisture and CO2 emission only in the dry period of the year. Results obtained in the eastern Amazonian area (Brazil) (Sotta et al., 2006) and in a tropical
rainforest (Asia) (Kosugi et al., 2007) show that the temporal variability of soil CO2 efflux was depended mainly on soil water content. Strong effects of soil temperature and soil water content on CO2 were ob-served in managed forests in Canada (Peng & Tho-mas, 2006).
ACKNOWLEDGMENTS
To FCAV-UNESP Graduated Program in Plant Production; to CAPES, CNPq and FAPESP for finan-cial support; and to Santa Isabel Farm for providing the study area and technical support.
REFERENCES
ALVENÄS, G.; JANSSON, P.E. Model for evaporation, moisture and temperature of bare soil: calibration and sensitivity analysis. Agricultural and Forest Meteorology, v.88, p.47-56, 1997. BERNOUX, M.; CARVALHO, M.C.S.; VOLKOFF, B.; CERRI, C.C. CO2 emission from mineral soils following land-cover change in Brazil. Global Change Biology, v.7, p.779-787, 2001. BERNOUX, M.; CARVALHO, M.C.S.; VOLKOFF, B.; CERRI, C.C.
Brazil´s soil carbon stocks. Soil Science Society of America Journal, v.66, p.888-896, 2002.
CAMPOS, D.C. Potencialidade do sistema de colheita sem queima da cana-de-açúcar para o seqüestro de carbono. Piracicaba: USP/ ESALQ, 2003. 103p. (Doutorado).
COMPANHIA NACIONAL DE ABASTECIMENTO - CONAB. Acompanhamento da safra brasileira de cana-de-açúcar - safra 2007/2008 terceiro levantamento, novembro/2007. Available at: http://www.conab.gov.br/conabweb/download/safra/ 3_levantamento0708_nov2007.pdf. Accessed 21 Jan. 2008. DANIELS, R.B.; HAMMER, R.D. Soil geomorphology. New York:
Jonh Wiley, 1992. 236p.
DAVIDSON, E.A.; JANSSENS, I.A. Temperature sensitivity of soil carbon decomposition and feedbacks to climate change. Nature, v.440, p.165-173, 2006.
DeJONG, E. Soil aeration as affected by slope position and vegetative cover. Soil Science, v.131, p.34-43, 1981.
n o i t i s o p c i h p a r g o p o T
s r e t e m a r a P d e t a m i t s E
n
L (ECO2)= a +bTSOIL(Equation2)
a b R2 p Q
0
1 = e
0 1b
e v a c n o
C -2.556±0.399 0.068±0.017 0.51 0.001 1.98(±0.34)
e p o l s k c a
B -2.166±0.636 0.059±0.027 0.24 0.044 1.81(±0.49)
e p o l s t o o
F -2.100±0.438 0.054±0.018 0.39 0.010 1.71(±0.31)
E(CO2)=a +bMSOIL (Equation4)
a b R2 p
e v a c n o
C 0.170±0.142 0.012±0.006 0.31 0.100
e p o l s k c a
B 0.027±0.230 0.025±0.010 0.43 0.039
e p o l s t o o
F 0.386±0.208 0.006±0.010 0.04 0.563NS
Table 2 - Relation between CO2 emission and soil, temperature (ºC) and gravimetric moisture (%) attributes in the studied topographic positions
E(CO2): soil CO2 emission; TSOIL: soil temperature; MSOIL: soil moisture; Q10: sensitivity of CO2 emission to a 10ºC increase in soil temperature for each topographic position, where b stems from Equation 2. NS: not significative (p < 0.10). There is no difference for CO
2
EMPRESA BRASILEIRA DE PESQUISA AGROPECUÁRIA. Manual de métodos de análise de solo. 2 ed. Rio de Janeiro: Embrapa/CNPS, 1997. 212p.
EMPRESA BRASILEIRA DE PESQUISA AGROPECUÁRIA. Manual de métodos de análise do solo. Rio de Janeiro: Embrapa-SNLCS, 1979. 247p.
EPRON, D.; BOSC, A.; BONAL, D.; FREYCON, V. Spatial variation of soil respiration across a topographic gradient in a tropical rain forest in French Guiana. Journal of Tropical Ecology, v.22, p.565-574, 2006.
FANG, C.; MONCRIEFF J.B.; GHOLZ, H.L.; CLARK, K.L. Soil CO2 efflux and its spatial variation in a Florida slash pine plantation. Plant Soil, v.205, p.135-146, 1998.
FANG, C.; MONCRIEFF, J.B. The dependence of soil CO2 efflux on temperature. Soil Biology and Biochemistry, v.33, p.155-165, 2001. FANG, C.; MONCRIEFF, J.B. A model for soil CO2 production and transport. 1. Model development. Agricultural and Forest Meteorology, v.95, p.225-236, 1999.
GARDNER, W.H. Water content. In: KLUTE, A. (Ed.) Methods of soil analysis. 2 ed. Madison: ASA, 1986. p.493-541. (Agronomy Monograph, 9).
HANSON, P.J.; WULLSCHLEGER, S.D.; BOHMAN, S.A.; TODD, D.E. Seasonal and topographic patterns of forest floor CO2 efflux from an upland oak forest. Tree Physiology, v.13, p.1-15, 1993. HEALY, R.W.; STRIEGL, R.G.; RUSSELL, T.F.; HUTCHINSON, G.L.; LIVINGSTON, G. P. Numerical evaluation of static-chamber measurements of soil-atmosphere gas exchange: identification of physical processes. Soil Science Society of America Journal, v.60, p.740-747, 1996.
JIA, S.; AKIYAMA, T.; MO, W.; INATOMI, M.; KOIZUMI, H. Temporal and spatial variability of soil respiration in a cool temperate broad-leaved forest. 1. Measurement of spatial variance and factor analysis. Japanese Journal of Ecology, v.53, p.13-22, 2003.
KANG, S.; LEE, D.; LEE, J.; RUNNING, S.W. Topographic and climatic controls on soil environments and net primary in a rugged temperate hardwood forest in Korea. Ecological Research, v.21, p.64-74, 2006.
KANG, S.; DOH, S.; LEE, D.; LEE, D.; JIN, V.L.; KIMBALL, J. Topographic and climatic controls on soil respiration in six temperate mixed-hardwood forest slopes, Korea. Global Change Biology, v.9, p.1427-1437, 2003.
KANG, S.; KIM, S.; DOH, S.; LEE, D. Predicting spatial and temporal patterns of soil temperature based on topography, surface cover and air temperature. Forest Ecology and Management, v.136, p.173-184, 2000.
KEMPER, W.D.; ROSENAU, R.C. Aggregate stability and size distribution. In: KLUTE, A. (Ed.) Methods of soil analysis. 2 ed. Madison: ASA, 1986. p.425-441. (Agronomy Monography, 9). KOSUGI, Y.; MITANI, T.; ITOH, M.; NOGUCHI, S.; TANI, M.;
MATSUO, N.; TAKANASHI, S.; OHKUBO, S.; NIK, A.R. Spatial and temporal variation in soil respiration in a Southeast Asian tropical rainforest. Agricultural and Forest Meteorology, v.147, p.35-47, 2007.
LA SCALA JÚNIOR, N.; MARQUES JÚNIOR, J.; PEREIRA, G.T.; CORÁ, J.E. Carbon dioxide emission related to chemical properties of a tropical bare soil. Soil Biology and Biochemistry, v.32, p.1469-1473, 2000.
LI, H.; YAN, J.; YUE, X.; WANG, M. Significance of soil temperature and moisture for soil respiration in a Chinese mountain area. Agriculture and Forest Meteorology, v.148, p.490-503, 2008.
LLOYD, J.; TAYLOR, J.A. On the temperature-dependence of soil respiration. Functional Ecology, v.8, p.315-323, 1994. OADES, J.M. Soil organic matter and structural stability:
mechanisms and implications for management. Plant and Soil, v.76, p.319-337, 1984.
PARKIN, T.B.; KASPAR, T.C.; SENWO, Z.; PRUEGER, J.H.; HATFIELD, J.L. Relationship of soil respiration to crop and landscape in the walnut creek watershed. Journal of Hydrometeorology, v.6, p.812-824, 2005.
PENG, Y.; THOMAS, S.C. Soil CO2 efflux in uneven-aged managed forests: temporal patterns following harvest and effects of edaphic Heterogeneity. Plant and Soil, v.289, p.253-264, 2006.
RAIJ, B. van; QUAGGIO, J.A.; CANTARELLA, H.; FERREIRA, M.E.; LOPES, A.S.; BATAGLIA, C.O. Análise química do solo para fins de fertilidade. Campinas: Fundação Cargill, 1987. 170p.
RAICH, J.W.; SCHLESINGER, W.H. The global carbon dioxide flux in soil respiration and its relationship to climate. Tellus, v.44B, p.81-99, 1992.
RETH, S.; MARKUS, R.; FALGE, E. The effect of soil water content, soil temperature, soil pH-value and the root mass on soil CO2 efflux: a modified model. Plant and Soil, v.268, p.21-33, 2005.
RISCH, A.C.; FRANK, D.A. Carbon dioxide fluxes in a spatially and temporally heterogeneous temperate grassland. Oecologia, v.147, p.291-302, 2006.
SAS INSTITUTE. SAS/STAT: user´s guide. Cary: SAS Institute, 1998.
SCHWERTMANN, U.; TAYLOR, R.M. Iron oxides. In: DIXON, J. B.; WEED, S. B. (Ed.) Minerals in soil environments. Madison: SSSA, 1989. p.379-438.
SILVA, A.C.; TORRADO, P.V.; MARTIN-NETO, L.; VASQUEZ, F.M.; PÉREZ, M.G. Soil organic matter and geomorphic surface stability relationship in an oxisol toposequence (SE-Brazil). In: INTERNATIONAL MEETING OF THE INTERNATIONAL HUMIC SUBSTANCES SOCIETY, 12., São Pedro, 2004. Proceedings. São Carlos: Embrapa Instrumentação Agropecuária, 2004. v.1, p.623-626.
SOTTA, E. D.; VELDKAMP, E.; GUIMARÃES, B. R.; PAIXÃO, R. K.; RUIVO, M. L.P.; ALMEIDA, S.S. Landscape and climatic controls on spatial and temporal variation in soil CO2 efflux in an Eastern Amazonian Rainforest, Caxiuanã, Brazil. Forest Ecology and Management, v.237, p.57-64, 2006.
SOUZA, C.K.; MARQUES JÚNIOR, J.; MARTINS FILHO, M.V.; PEREIRA, G.T. Influência do relevo e erosão na variabilidade espacial de um latossolo em Jaboticabal (SP). Revista Brasileira de Ciência do Solo, v.27, p.1067-1074. 2003.
SOUZA, Z.M.; MARQUES JÚNIOR, J.; PEREIRA, G.T.; MOREIRA, L.F. Influência da pedoforma na variabilidade espacial de alguns atributos físicos e hídricos de um Latossolo sob cultivo de cana-de-açúcar. Irriga, v.9, p.1-11, 2004c.
SOUZA, Z.M.; MARQUES JÚNIOR, J.; PEREIRA, G.T.; BARBIERI, D. M. Small relief shape variations influence spatial varaibility of soil chemival attributes. Scientia agricola, v.63, p.161-168, 2006.
SOUZA, Z.M.; MARQUES JÚNIOR, J.; PEREIRA, G.T. Variabilidade espacial da estabilidade de agregados e matéria orgânica em solos de relevos diferentes. Pesquisa Agropecuária Brasileira, v.39, p.491-499, 2004a.
SOUZA, Z.M.; MARQUES JÚNIOR, J.; PEREIRA, G.T.; BENTO, M.J.C. Variabilidade espacial de atributos físicos de um Latossolo Vermelho sob cultivo de cana-de-açúcar. Revista Brasileira de Engenharia Agrícola e Ambiental, v.8, p.51-58, 2004b. STOLF, R. Teoria e teste experimental de fórmulas de transformação dos dados de penetrômetro de impacto em resistência do solo. Revista Brasileira de Ciência do Solo, v.15, p.229-235, 1991.
XU, M.; QI, Y. Soil-surface CO2 efflux and its spatial and temporal variations in a young ponderosa pine plantation in northern California. Global Change Biology, v.7, p.667-677, 2001. YOO, G.; SPOMIER, L.A.; WANDER, M.M. Regulation of carbon
mineralization rates by soil structure and water in an agricultural field and a prairie-like soil. Geoderma, v.135, p.16-25, 2006. ZAR, J.H. Biostatistical analysis. 4 ed. Upper Saddle River:
Prentice Hall, 1999. 718p.