INTRODUCTION
Keratoconus is traditionally described as a noninlammatory ectatic disorder of the cornea characterized by progressive thinning, steepe-ning, and apical protrusion. These corneal changes induce irregular astigmatism and myopic shift, causing impairment of vision. The incidence of keratoconus in the general population is estimated to be approximately 1 in 2000(1). Keratoconus is the second most frequent indication for corneal transplantation, accounting for approximately 12% of corneal transplants performed in the United States(2) and is one of the main indications of keratoplasty in Brazil(3). Corneal
trans-plantation has inherent intra- and postoperative risks, and the surgery signiicantly afects the patient’s quality of life during the surgical re-covery phase and beyond, with lost work time and often permanent changes in vision and lifestyle.
The diagnosis of moderate-to-advanced keratoconus is not dii-cult because of the presence of irregular astigmatism on corneal topography and the development of classical clinical signs. However, identifying subclinical forms of the disease in patients with normal best-corrected visual acuity (BCVA) and minimum or no clinical signs is challenging. The identiication of very early forms of keratoconus
Quantitative analysis of iris parameters in keratoconus patients using
optical coherence tomography
Uso de tomograia de coerência óptica na análise quantitativa dos parâmetros irianos
em pacientes com ceratocone
Gustavo Bonfadini1,2,3, Karun arora4, Lucas M. vianna1,3,5, Mauro caMpos3, david friedMan4,6, Beatriz Muñoz4,6, aLBert s Jun1
Submitted for publication: February 23, 2015 Accepted for publication: July 6, 2015
1 Cornea and Anterior Segment Service, The Wilmer Eye Institute, Johns Hopkins School of Medicine,
Baltimore, MD, USA.
2 Rio de Janeiro Eye Bank (INTO), Rio de Janeiro, RJ, Brazil.
3 Department of Ophthalmology and Visual Sciences, Escola Paulista de Medicina (EPM), Universidade Federal de São Paulo (UNIFESP), São Paulo, SP, Brazil.
4 Dana Center for Preventive Ophthalmology, The Wilmer Eye Institute, Johns Hopkins School of Medicine, Baltimore, MD, USA.
5 Universidade Estadual do Rio de Janeiro, Rio de Janeiro, RJ, Brazil.
6 Department of Epidemiology, Johns Hopkins Bloomberg School of Public Health, Baltimore, MD,
USA.
Funding: No specific financial support was available for this study.
Disclosure of potential conflicts of interest: None of the authors have any potential conflict of interest to disclosure.
Corresponding author: Albert S. Jun. 400 N. Broadway, Smith Building 5011 - Baltimore, MD 21231 - E-mail: [email protected]
Approved by the following research ethics committee: Institutional Review Boards (IRB): No 00051452. Johns Hopkins School of Medicine, Baltimore, MD, USA.
ABSTRACT
Purpose: To investigate the relationship between quantitative iris parameters and the presence of keratoconus.
Methods: Cross-sectional observational study that included 15 affected eyes of 15 patients with keratoconus and 26 eyes of 26 normal age- and sex-matched controls. Iris parameters (area, thickness, and pupil diameter) of affected and unaffected eyes were measured under standardized light and dark conditions using anterior segment optical coherence tomography (AS-OCT ). To identify opti-mal iris thickness cutoff points to maximize the sensitivity and specificity when discriminating keratoconus eyes from normal eyes, the analysis included the use of receiver operating characteristic (ROC) curves.
Results: Iris thickness and area were lower in keratoconus eyes than in normal eyes. The mean thickness at the pupillary margin under both light and dark condi-tions was found to be the best parameter for discriminating normal patients from keratoconus patients. Diagnostic performance was assessed by the area under the ROC curve (AROC), which had a value of 0.8256 with 80.0% sensitivity and 84.6% specificity, using a cutoff of 0.4125 mm. The sensitivity increased to 86.7% when a cutoff of 0.4700 mm was used.
Conclusions: In our sample, iris thickness was lower in keratoconus eyes than in normal eyes. These results suggest that tomographic parameters may provide novel adjunct approaches for keratoconus screening.
Keywords: Tomography, optical coherence; Iris; Keratoconus; Cornea; Dilatation pathologic; ROC curve
RESUMO
Objetivo: Investigar a relação entre os parâmetros quantitativos irianos e a presença de ceratocone.
Métodos: Estudo observacional transversal com quinze olhos de 15 pacientes com ceratocone e 26 olhos de 26 indivíduos normais, pareados por idade e gênero. Parâ-metros da íris (área, espessura e diâmetro da pupila) de olhos com ceratocone e olhos sem ceratocone foram medidos usando tomografia de coerência óptica do segmento anterior (AS-OCT), em condições padronizadas de alta luminosidade e ambiente escuro. Com o objetivo de maximizar a sensibilidade, especificidade e identificar o melhor ponto de corte na diferenciação entre ceratocone e indivíduos normais, foi realizada a análise quantitativa da curva característica operacional do receptor (ROC) dos parâmetros de espessura da íris.
or forme fruste keratoconus relies on topographic data and subjec-tive clinical impression. Thus, more objecsubjec-tive parameters are needed when evaluating patients with forme fruste keratoconus, such as those with asymmetric or unilateral keratoconus, family members of keratoconus patients, and patients undergoing evaluation for re-fractive surgery.
Corneal tomography provides three-dimensional reconstruction of the cornea, enabling evaluation of the anterior and posterior corneal surfaces and creation of a corneal pachymetric (thickness) and topo-graphic map. Commercially available corneal tomography systems that use a rotating Scheimplug cameras have been proposed to help identify forme fruste keratoconus(4), and high-speed anterior segment optical coherence tomography has been shown to have good repeatability and reproducibility with ocular structures and iris area measurements(5-9).
In a subset of keratoconus patients undergoing penetrating kera-toplasty (PKP), we have observed that the iris can show a tendency to prolapse toward the incisions and be less responsive to pharmacolo-gical agents. Urrets-Zavalia syndrome, an uncommon postoperative complication of PKP, has also been associated with keratoconus, which suggests an intrinsic abnormality in irises with this disease(10). Others have described an association between keratoconus and loppy eyelids(11,12). Thus, multiple lines of evidence indicate extracorneal ma -nifestations of keratoconus involving the iris and/or the periocular skin and connective tissues.
In this report, we describe the novel use of AS-OCT to determine iris parameters for discriminating between normal individuals and keratoconus patients.
METHODS
S
UBJECTSApproval was granted by the Johns Hopkins Institutional Review Board for this study. All study procedures adhered to the tenets of the Declaration of Helsinki. This was a prospective, cross-sectional, clinic-based evaluation of patients who presented to the cornea service at the Wilmer Eye Institute. The study population consisted of recruited patients with a known or new diagnosis of keratoconus and healthy controls with normal myopic refraction.
Inclusion criteria were as follows: (1) willingness and ability to par-ticipate; (2) persons aged between 18 and 60 years; and (3) no ocular surgery in the studied eye. Exclusion criteria were as follows: (1) pre-sence of any anatomic iris abnormalities, such as peripheral anterior synechiae or iris whorling (distortion of radially orientated iris ibers); (2) any prior intraocular incisional surgery or laser treatment; (3) any factor limiting normal AS-OCT imaging of the anterior segment; (4) history of topical or systemic medications that could interfere with iris anatomy or physiology; (5) history of any neurological disease; and (6) presence of glaucoma, elevated intraocular pressure (IOP) above 20 mmHg, or “glaucomlecken” lens opacity.
All participants completed a comprehensive questionnaire desig-ned to collect information on baseline demographics, ocular history, eye rubbing, contact lens use, past medical history, and family his tory. Participants underwent a complete ophthalmic examination, inclu-ding measurement of BCVA, spherical equivalent refraction in diop-ters (D), slit lamp biomicroscopy, and AS-OCT (Visante OCT, version 2.0; Carl Zeiss Meditec). We enrolled 41 consecutive patients, with 15 eyes of 15 keratoconus patients and 26 eyes of 26 normal age- and sex-matched controls (Table 1). For patients and controls, the eye with the worse BCVA was enrolled. When the BCVA was equivalent in both eyes, the eye with the greatest spherical equivalent refraction was enrolled. Keratoconus diagnosis was determined by clinical exa-mination and corneal modeling with the Pentacam. In accordance with previous literature(13), keratoconus patients were graded as mild/ moderate (steepest K<52 D) or severe (steepest K>52 D).
AS-OCT
IMAGEACQUISITIONThe Visante OCT used in this study has axial and transverse image resolution up to 18 and 60 μm, respectively. All participants were imaged in the enhanced anterior segment single mode to acquire an image centered over the pupil on the horizontal meridian, and proper eye alignment was indicated by an interference beam along the visual axis (scan length 16 mm; 256 A-scans). No pharmacologic agents were applied to the eye prior to imaging. The inset image on the monitor screen was used as a guide to ensure that there was minimal eye movement and no blinking during imaging.
AS-OCT imaging of the study eye was irst obtained in a com-pletely darkened room with all room lights switched of (<1 lux illumination). We allowed 3 min for patients’ dark adaptation before image acquisition. Repeat AS-OCT imaging under illumination was acquired 1 min after the room lights were turned on (350-400 lux). A fully charged handheld torch kept at an approximate angulation of 45o and a distance of 25 cm was then shone from the temporal aspect onto the fellow eye (light intensity at the subject’s sitting position was 1600 lux) during the entire time of the AS-OCT image acquisition. Care was taken to prevent any light from crossing the nasal bridge.
At least three images under dark and light conditions were acqui-red in each study eye. The image with the best quality, deined as ha-ving good visible scleral spurs (SS) at the temporal and nasal angles, no movement artifacts (i.e., no discontinuity of the anterior segment structures in the AS-OCT image), and good centration, was selected for analysis from the dark and light series of images, respectively.
I
MAGEANALYSISIris parameters on each of the two images (dark and light condi-tions) were evaluated in a masked fashion by a single observer (GB). Pupil diameter, iris area, and iris thickness in six positions, three from each side of the image (nasal and temporal) were determined (Figu-re 1, Table 2) using ImageJ softwa(Figu-re (version 1.44; National Institutes of Health, Bethesda, MD, USA; available at http://rsb.info.nih.gov/ij/ index.html). Images were taken directly from the Visante’s output function as RAW iles (with lossless data compression). In ImageJ, the ile was imported as a 16-bit signed image, with 1024 pixel width and 256 pixel height, 0 bytes for ofset to irst image, 1 for number of ima-ges, and 0 bytes for gap between imaima-ges, preselected as little-endian
Table 1. Participant characteristics
Parameter
Keratoconus n=15
Controls n=26
P-value Mean (SD) Mean (SD)
Demographics
Age in years 38.0 (11.4) 34.1 (10.0) 0.260
Male 77.7% 46.2% 0.200
Race
White 46.7% 61.5% *Fisher’s exact
0.004
Asian 00.0% 19.2%
Black 46.7% 03.9%
Hispanic 06.7% 07.7%
Refraction
Sphere -3.5 (2.1) -5.2 (3.3) 0.080
Cylinder -3.0 (2.4) -0.7 (0.8) 0.030
Spherical equivalent -2.0 (2.4) -4.8 (3.0) 0.004 SD= standard deviation.
byte order. The image was then rotated by 90° to the right position and selected in a scale along the x-axis by 8×, maintaining the y-axis scale at 2048 pixel width and 1024 pixel height and bilinear mode in interpolation. With this selection, horizontal scaling was 16 mm/2048 pixels=0.00781 mm/pixel, and vertical scaling was 8 mm/1024 pixel =0.00781 mm/pixel(14).
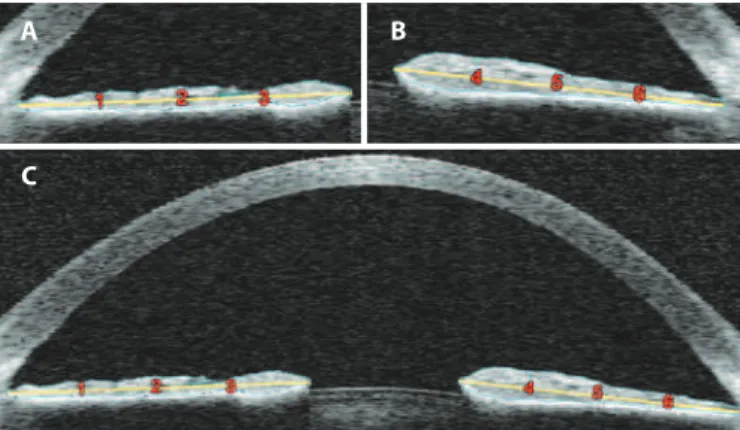
The measurements were performed as follows: The left and right SS were dei ned as the point at which a change in curvature of the inner surface of the angle wall became apparent and often presen-ted as inward protrusions of the sclera(15). A perpendicular line was drawn from each left and right SS to the anterior aspect of the band of hyper-rel ectance on the posterior iris surface representing the iris pigment epithelium (Figure 1). From the two ends of these lines, a freehand line was drawn to exactly delineate the anterior iris, central iris border, and posterior edge of the iris stroma as dei ned by the anterior aspect of the band of hyper-rel ectance representing the iris pigment epithelium (Figure 1). The area encircled by this line was calculated as the iris area.
The iris cross-sectional area was dei ned as the cross-sectional area of both the nasal and temporal sides. When the left and right ends of the iris are marked in ImageJ, the software provides a cen-troid value for both the left and the right markings. We calculated the horizontal x-axis distance between the two centroids and the vertical
y-axis distance between the two centroids in pixels, and then conver-ted them from pixels to mm using scales. This distance was halved to obtain the radius (R), which was then substituted into the formula for iris volume. The mm2/pixel2 value was obtained by multiplying the horizontal scale with the vertical scale:
ImageJ software provides the area for the left and right iris mar-kings. We then converted both areas from pixels2 to mm2 using the scaling factor above; the volume was separately calculated for the two iris markings (180° each) using the following formula:
, where R is half the distance between the two centroids in mm and A is the area of the iris in mm2. We added the two volumes for the left and right iris markings to obtain the i nal volume (Zeiss Meditec, personal communication).
For each portion of the iris in the image (left and right), the midpoint of the line connecting the SS to the iris pigment epithelium was con-nected with a line to the central-most location of the pupil margin (Figure 1, yellow line). This line was divided into four equal portions by drawing three equidistant vertical lines across the iris from the anterior iris surface to the anterior aspect of the hyper-rel ective band on the posterior iris; the iris thicknesses were obtained by measuring between these lines, with zones 1-3 on the left and zones 4-6 on the right (Figure 1).
Iris thicknesses at zones 1 (left side) and 6 (right side) represent the periphery of the iris; thicknesses at zones 2 (left side) and 5 (right side) represent the midpoint of the iris; and thicknesses at zones 3 (left side) and 4 (right side) represent the center of the iris (Figure 1). The pupillary diameter was measured as the distance between the central-most portions of the iris on the left and right.
S
TATISTICALANALYSISStatistical analysis was performed using Statistical Package for the Social Sciences (SPSS) software version 17.0 (SPSS Inc., Chicago, IL, USA). The demographics, clinical data, and iris parameters (age, sex, refraction, pupil diameter in dark and light, pupil diameter dif erence in dark and light, iris area in dark and light, and iris thickness in dark and light) were compared between the keratoconus and control groups using two-tailed t-tests. The dif erence in racial distribution between the keratoconus and control groups was assessed using
Fisher’s exact test. Race-dependent dif erences for each OCT para-meter were assessed using a linear mixed-ef ects model. P-values less than 0.05 were considered statistically signii cant.
To evaluate the diagnostic performance, receiver operating cha-racteristic (ROC) curves were used to determine the parameter’s overall predictive accuracy [(area under the ROC curve (AROC)) and to identify the optimal iris thickness cutof points to maximize sensi-tivity and specii city when discriminating keratoconus patients from normal patients.
RESULTS
The mean age [± standard deviation (SD)] was 38.0 ± 11.4 years (range 18-59 years) in the keratoconus group and 34.1 ± 10.0 years (range 20-59 years) in the control group. Of these, 77.7% and 46.2% were male in the keratoconus and control groups, respectively. The race distributions in the keratoconus and control groups, respectively, were: white (46.7% vs. 61.5%), black (46.7% vs. 3.9%), Hispanic (6.7% vs. 7.7%), and Asian (0.0% vs. 19.2%). The participant characteristics of both groups are shown in table 1. The mean (± SD) spherical equi-valent refraction was -2.0 ± 2.4 D in the keratoconus group and -4.8 ± 3.0 D in the control group (p=0.004). There was no apparent rela-tionship between the iris parameters and severity of disease in the keratoconus patients (mild/moderate severity, eight; severe, seven).
The mean iris thicknesses for the paired locations (periphery zones 1 and 6, midpoint zones 2 and 5, and center zones 3 and 4) in light and dark are shown in table 2. Compared with controls, the mean iris thicknesses (mm) in light in keratoconus patients (Table 2) were 11% thinner for the peripheral iris (zones 1 and 6, p=0.09), 16% thinner for the mid-iris (zones 2 and 5, p=0.02), and 18% thinner for the central iris (zones 3 and 4, p=0.004). After adjusting for race, there were signii cant dif erences for most of the iris parameters and for all three combined zones (1 and 6, 2 and 5, and 3 and 4) in light between keratoconus patients and controls (Table 2).
Compared with controls, the mean iris thicknesses (mm) in dark in keratoconus patients (Table 2) were 19% thinner for the peripheral iris (zones 1 and 6, p=0.001), 12% thinner for the mid-iris (zones 2 and 5, p=0.10), and 15% thinner for the central iris (zones 3 and 4,
p=0.004). After adjusting for race, there were signii cant dif erences for two of the combined zones (1 and 6 and 3 and 4) in dark between keratoconus patients and controls (Table 2). Race adjustment did not result in a statistically signii cant dif erence for zones 2 and 5 in dark
Figure 1. Anterior segment optical coherence tomography (AS-OCT) images with iris area and iris thickness demarcation. All study images were obtained on the horizontal meridian. For details regarding the measurement procedure, see the Methods section. A) Left side of the AS-OCT image. B) Right side of the AS-OCT image. C) Full AS-OCT image. Iris thicknesses at zones 1 and 6 represent the iris periphery, thicknesses at zones 2 and 5 represent the iris midpoint, and thicknesses at zones 3 and 4 represent the iris center.
A B
(p=0.25) between keratoconus patients and controls.
Compared to controls, the total iris area in keratoconus patients (Table 2) was 7% smaller in light (p=0.14) and 10% smaller in dark (p=0.03). The pupil diameter in light and dark and diference in pupil diameter (dark minus light) showed no signiicant diferences in ke-ratoconus patients compared with controls (Table 2).
To discriminate keratoconus cases from controls, the mean iris thickness from light and dark conditions in all zones gave an AROC of 0.8154, with a maximum sensitivity of 80% using a cutof of 0.3725 mm and a maximum speciicity of 84.6% using a cutof of 0.3375 mm (Table 3). Using the mean iris thickness from light and dark conditions in zones 3 and 4 only, the AROC increased to 0.8256, with a maximum sensitivity of 86.7% using a cutof of 0.4700 mm and a maximum spe-ciicity of 84.6% using a cutof of 0.4125 mm (Table 3 and Figure 2).
DISCUSSION
The utility of AS-OCT in the diagnosis and management of va-rious anterior segment conditions has been studied in the past(5,6,16-18). In particular, Prata et al. used AS-OCT to show iris thinning in patients taking systemic alpha-1 adrenergic receptor antagonists associated with intraoperative loppy iris syndrome(19). In this report, we
descri-be the use of AS-OCT to determine iris parameters predictive of ke ratoconus.
The human eye is formed through coordinated interactions between the neuroepithelium, surface ectoderm, and extraocular mesenchy-me(20). The neuroectoderm gives rise to the iris, retina, and optic nerve; the surface ectoderm forms the lens and corneal epithelium; and the extraocular mesenchyme, comprising the mesodermal and neural crest cells, gives rise to the iris, corneal stroma, corneal endothelium, extraocular muscles, and ibrous and vascular coats of the eye(21,22). The iris arises from the anterior margin of the optic cup neuroepithe-lium and the periocular mesenchyme. The most posterior layer of the iris is the pigmented epithelium; anterior to this are the iris muscles, and further anteriorly lies the iris stroma.
The iris stroma originates from both the neural crest and meso-derm(23,24). Similarly, the mesenchymal stromal cells of the neural crest and mesoderm migrate into the space between the corneal epithelium and endothelium, forming the keratoblasts. The kerato-blasts proliferate and synthesize an embryonic corneal stroma. The keratoblasts then diferentiate into keratocytes, which synthesize a mature stromal extracellular matrix(25).
Although speculative, we suggest that the embryologic simila-rities of time, space, and origin of the iris and corneal stromal cells could explain our observation of reduced iris thickness in keratoco-nus patients. The mechanism could involve defective production of stromal components, which may be less clinically relevant for the iris than for the cornea, which is under constant biomechanical stress due to IOP and contributes directly to visual acuity via refraction and clarity. However, possible abnormalities of the iris structure and bio-mechanics may manifest in our perception of intraoperative loppy iris syndrome during PKP, as well as the association between Urrets-Zavalia syndrome and keratoconus.
The indings and implications of this study need to be interpreted with caution because of some limitations, including the small size of the cohort (41 eyes) and the discrepancy between the ethnicities of the keratoconus and control patients, as we enrolled 41 consecutive patients (15 keratoconus patients and 26 controls) on clinic-based evaluation who presented to the cornea service at the Wilmer Eye Institute.
In a recent iris thickness study, although Caucasian-Americans had the lowest measurements for all iris thickness parameters, African-Americans had the highest measurements for nearly all iris thickness parameters(26). In our study, the results showed that iris thickness was lower in keratoconus eyes than in control eyes, and the distribution of our African-American cohort was 46.7% (keratoconus group) and 3.9% (control group).
Furthermore, the use of six positions under two diferent light conditions may not relect the full range of iris abnormalities in keratoconus. Additional possibilities include the use of video recor-dings to capture the dynamic parameters of the iris under changing illumination as described by Zheng et al.(27). Furthermore, the cross-sectional design of our study does not address the issue of
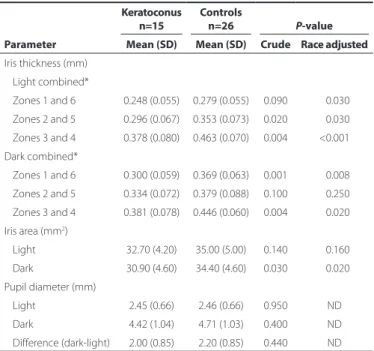
Table 2. Participant iris measurements
Parameter
Keratoconus n=15
Controls
n=26 P-value Mean (SD) Mean (SD) Crude Race adjusted
Iris thickness (mm)
Light combined*
Zones 1 and 6 0.248 (0.055) 0.279 (0.055) 0.090 <0.030
Zones 2 and 5 0.296 (0.067) 0.353 (0.073) 0.020 <0.030 Zones 3 and 4 0.378 (0.080) 0.463 (0.070) 0.004 <0.001
Dark combined*
Zones 1 and 6 0.300 (0.059) 0.369 (0.063) 0.001 <0.008 Zones 2 and 5 0.334 (0.072) 0.379 (0.088) 0.100 <0.250
Zones 3 and 4 0.381 (0.078) 0.446 (0.060) 0.004 <0.020
Iris area (mm2)
Light 32.70 (4.20) 35.00 (5.00) 0.140 <0.160
Dark 30.90 (4.60) 34.40 (4.60) 0.030 <0.020
Pupil diameter (mm)
Light 2.45 (0.66) 2.46 (0.66) 0.950 ND
Dark 4.42 (1.04) 4.71 (1.03) 0.400 ND
Diference (dark-light) 2.00 (0.85) 2.20 (0.85) 0.440 ND SD= standard deviation.
*= combined indicates the mean, not additive, values for the speciied zones. ND= not done.
Table 3. Diagnostic accuracy of iris parameters for keratoconus diagnosis
Parameter Area under ROC Cutof (mm) Sensitivity (95% CI) Speciicity (95% CI)
Mean for zones 3 and 4 for both light and dark 0.8256 0.4125 80.0 (51.9-95.7) 84.6 (65.1-95.6)
0.4700 86.7 (59.5-98.3) 61.5 (20.2-59.4) Mean for all zones for both light and dark 0.8154 0.3375 73.3 (44.9-92.2) 84.6 (65.1-95.6)
0.3725 80.0 (51.9-95.7) 61.5 (40.6-79.8)
Mean for zones 1 and 6 in dark 0.7910 0.3300 80.0 (51.9-95.7) 69.2 (48.2-85.7)
Mean for zones 3 and 4 in light 0.7872 0.4500 80.0 (51.9-95.7) 57.7 (23.3-63.1)
Figure 2. Receiver operating characteristic (ROC) curve for mean iris thickness in zones 3 and 4 (iris center) under dark and light conditions. These parameters were optimal for discriminating keratoconus patients from controls, with the highest area under the ROC curve (0.8256) for iris thickness cutofs of 0.4125 mm and 0.4700 mm (Table 3). The highest sensitivity (80.0%) and speciicity (84.6%) were obtained with an iris thickness cutof of 0.4125 mm (open triangle), whereas sensitivity increased to 86.7% with an iris thickness cutof of 0.4700 mm (closed triangle).
whether the reduced iris thickness that we observed in keratoconus patients is progressive and correlates with changes in the severity of corneal involvement. Thus, we feel that larger, multicenter, prospec-tive studies with ethnically similar patients are warranted to further elucidate the relationship between iris structural indices and corneal abnormalities in keratoconus.
In conclusion, we have shown an association between iris thinning and keratoconus. This observation may be related to dysfunction of the extracellular matrix and stromal cells in the iris and cornea. Impro-ved characterization of this feature of keratoconus could poten tially provide an additional source of diagnostic and prognostic informa-tion for disease management.
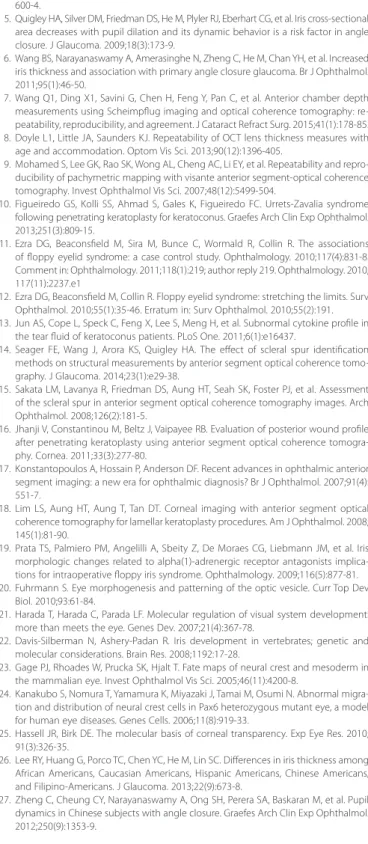
REFERENCES
1. Rabinowitz YS. Keratoconus. Surv Ophthalmol. 1998;42(4):297-319.
2. Eye Bank Association of America. 2012 Eye Banking Statistical Report [Internet]. Was hington; 2002. [cited 2014 Jan 8]. Available from: http://www.restoresight.org/ wp-content/uploads/2013/04/2012_Statistical_Report_FINAL-reduced-size-4-10.pdf 3. Bonfadini G, Kim EC, Campos M, Jun AS. Novel spatula and dissector for safer deep
anterior lamellar keratoplasty. Rev Bras Oftalmol. 2014;73(5):279-81.
4. Diniz CM, Hazarbassanov RM, Yamazaki E, Murata C, Mallmann F, Campos M. Penta-cam Scheimplug evaluation of corneal volume after LASIK. J Refract Surg. 2010;26(8):
600-4.
5. Quigley HA, Silver DM, Friedman DS, He M, Plyler RJ, Eberhart CG, et al. Iris cross-sectional area decreases with pupil dilation and its dynamic behavior is a risk factor in angle closure. J Glaucoma. 2009;18(3):173-9.
6. Wang BS, Narayanaswamy A, Amerasinghe N, Zheng C, He M, Chan YH, et al. Increased iris thickness and association with primary angle closure glaucoma. Br J Ophthalmol. 2011;95(1):46-50.
7. Wang Q1, Ding X1, Savini G, Chen H, Feng Y, Pan C, et al. Anterior chamber depth mea surements using Scheimplug imaging and optical coherence tomography: re-peatability, reproducibility, and agreement. J Cataract Refract Surg. 2015;41(1):178-85. 8. Doyle L1, Little JA, Saunders KJ. Repeatability of OCT lens thickness measures with
age and accommodation. Optom Vis Sci. 2013;90(12):1396-405.
9. Mohamed S, Lee GK, Rao SK, Wong AL, Cheng AC, Li EY, et al. Repeatability and repro-ducibility of pachymetric mapping with visante anterior segment-optical coherence tomography. Invest Ophthalmol Vis Sci. 2007;48(12):5499-504.
10. Figueiredo GS, Kolli SS, Ahmad S, Gales K, Figueiredo FC. Urrets-Zavalia syndrome following penetrating keratoplasty for keratoconus. Graefes Arch Clin Exp Ophthalmol. 2013;251(3):809-15.
11. Ezra DG, Beaconsield M, Sira M, Bunce C, Wormald R, Collin R. The associations of loppy eyelid syndrome: a case control study. Ophthalmology. 2010;117(4):831-8. Comment in: Ophthalmology. 2011;118(1):219; author reply 219. Ophthalmology. 2010; 117(11):2237.e1
12. Ezra DG, Beaconsield M, Collin R. Floppy eyelid syndrome: stretching the limits. Surv Ophthalmol. 2010;55(1):35-46. Erratum in: Surv Ophthalmol. 2010;55(2):191. . 13. Jun AS, Cope L, Speck C, Feng X, Lee S, Meng H, et al. Subnormal cytokine proile in
the tear luid of keratoconus patients. PLoS One. 2011;6(1):e16437.
14. Seager FE, Wang J, Arora KS, Quigley HA. The efect of scleral spur identiication methods on structural measurements by anterior segment optical coherence tomo-graphy. J Glaucoma. 2014;23(1):e29-38.
15. Sakata LM, Lavanya R, Friedman DS, Aung HT, Seah SK, Foster PJ, et al. Assessment of the scleral spur in anterior segment optical coherence tomography images. Arch Ophthalmol. 2008;126(2):181-5.
16. Jhanji V, Constantinou M, Beltz J, Vaipayee RB. Evaluation of posterior wound proile after penetrating keratoplasty using anterior segment optical coherence tomogra-phy. Cornea. 2011;33(3):277-80.
17. Konstantopoulos A, Hossain P, Anderson DF. Recent advances in ophthalmic anterior segment imaging: a new era for ophthalmic diagnosis? Br J Ophthalmol. 2007;91(4): 551-7.
18. Lim LS, Aung HT, Aung T, Tan DT. Corneal imaging with anterior segment optical coherence tomography for lamellar keratoplasty procedures. Am J Ophthalmol. 2008; 145(1):81-90.
19. Prata TS, Palmiero PM, Angelilli A, Sbeity Z, De Moraes CG, Liebmann JM, et al. Iris morphologic changes related to alpha(1)-adrenergic receptor antagonists implica-tions for intraoperative loppy iris syndrome. Ophthalmology. 2009;116(5):877-81. 20. Fuhrmann S. Eye morphogenesis and patterning of the optic vesicle. Curr Top Dev
Biol. 2010;93:61-84.
21. Harada T, Harada C, Parada LF. Molecular regulation of visual system development: more than meets the eye. Genes Dev. 2007;21(4):367-78.
22. Davis-Silberman N, Ashery-Padan R. Iris development in vertebrates; genetic and molecular considerations. Brain Res. 2008;1192:17-28.
23. Gage PJ, Rhoades W, Prucka SK, Hjalt T. Fate maps of neural crest and mesoderm in the mammalian eye. Invest Ophthalmol Vis Sci. 2005;46(11):4200-8.
24. Kanakubo S, Nomura T, Yamamura K, Miyazaki J, Tamai M, Osumi N. Abnormal migra-tion and distribumigra-tion of neural crest cells in Pax6 heterozygous mutant eye, a model for human eye diseases. Genes Cells. 2006;11(8):919-33.
25. Hassell JR, Birk DE. The molecular basis of corneal transparency. Exp Eye Res. 2010; 91(3):326-35.
26. Lee RY, Huang G, Porco TC, Chen YC, He M, Lin SC. Diferences in iris thickness among African Americans, Caucasian Americans, Hispanic Americans, Chinese Americans, and Filipino-Americans. J Glaucoma. 2013;22(9):673-8.