INTRODUCTION
Ocular toxoplasmosis is a potentially blinding, necrotizing reti-nitis and is the most commonly identified cause of posterior uveitis worldwide. Permanent vision loss may occur if lesions affect the macula or optic nerve head. Other complications that can result in visual impairment include persistent vitreous opacities, epiretinal membranes, and cystoid macular edema(1,2).
Visual acuity (VA) is widely used as a means of evaluating central vision based on high-contrast images. However, other fundamental aspects of visual performance, such as contrast sensitivity (CS), color vision (CV), and the visual field (VF), may be impaired in patients with uveitic diseases, despite their VA being essentially normal(3). Some pa-tients with toxoplasmic retinochoroiditis sparing the posterior pole may present with unsatisfactory vision that cannot be detected by
ABSTRACT
Purpose: To evaluate the visual function and architecture of the central and peripapillary retina in patients with inactive toxoplasmic retinochoroiditis outside the macular and peripapillary regions (zones 2 and 3).
Methods: Cross-sectional study of 20 eyes (18 patients) with zone 2 and 3 toxoplasmic scars and visual acuity ≥20/25. Patients underwent Humphrey 10-2 perimetry, contrast sensitivity (Mars test), and color vision testing (L’Anthony desaturated D-15). The retinal nerve fiber layer (RNFL) and macular thicknesses were determined by optical coherence tomography.
Results: The patients’ mean age was 27.4 ± 10.3 years, and the mean duration of remission was 6.15 ± 5.19 months. Abnormal contrast sensitivity and color vision were observed in three (15.0%) and four eyes (20.0%), respectively. Mean deviation (MD) and pattern standard deviation (PSD) fell outside the 95% normal confidence limits of the perimeter’s database in 14 (70.0%) and seven eyes (35.0%), respectively. Foveal and mean RNFL thicknesses were within the normal limits in all eyes. Eyes with zone 2 retinochoroiditis had lower foveal sensitivity than eyes with zone 3 lesions (p=0.041). Eyes with a longer duration of remission had a higher MD (r=0.575; p=0.013) and a lower PSD (r=-0.593; p=0.010).
Conclusion: Despite normal central and peripapillary retinal architecture, eyes with inactive zone 2 and 3 toxoplasmic retinochoroiditis can present with abnormal color, contrast, and macular perimetric sensitivity. Zone 2 retinochoroiditis was associated with lower foveal sensitivity, and a longer duration of retinochoroiditis remission was associated with better perimetric parameters (MD and PSD).
Keywords: Ocular toxoplasmosis; Chorioretinitis; Visual fields; Optical coherence tomography; Color vision; Contrast sensitivity
RESUMO
Objetivo: Avaliar a função visual e arquitetura da retina central e peripapilar em pa-cientes com retinocoroidite toxoplásmica inativa fora da região macular e peripapilar (zonas 2 e 3).
Métodos: Estudo transversal de 20 olhos (18 pacientes) com cicatrizes toxoplásmicas nas zonas 2 e 3 com acuidade visual ≥20/25. Os pacientes foram submetidos à peri-metria Humphrey 10-2, teste de sensibilidade ao contraste (Teste Mars) e teste de visão de cores (L’Anthony D-15 dessaturado). As espessuras da camada de fibras nervosas da retina (CFNR) e da mácula foram determinadas pela tomografia de coerência óptica. Resultados: A média de idade dos pacientes foi 27,4 ± 10,3 anos, e a duração média da remissão da retinocoroidite foi de 6,15 ± 5,19 meses. Alterações na sensibilidade ao contraste e cores foram observada em, respectivamente, 3 olhos (15,0%) e 4 olhos (20,0%). Os índices perimétricos mean deviation(MD) e pattern standard deviation (PSD) estiveram fora do intervalo de confiança de 95% do perímetro em 14 olhos (70,0%) e 7 olhos (35,0%), respectivamente. A espessura foveal e da CFNR média estiveram dentro do limite da normalidade em todos os olhos. Olhos com retinocoroidite na zona 2 tiveram menor sensibilidade foveal que olhos com lesões na zona 3 (p=0,041). Olhos com remissão de longa duração tiveram um MD mais alto (r=0,575; p=0,013) e um PSD mais baixo (r=-0,593; p=0,010).
Conclusão: Apesar da arquitetura normal da retina central e peripapilar, olhos com retinocoroidite inativa nas zonas 2 e 3 podem apresentar anormalidades da visão de cores, sensibilidade ao contras e perimetria macular. A retinocoroidite na zona 2 está associada a uma menor sensibilidade foveal. Longos intervalos de remissão da retinocoroidite estiveram associados a melhores parâmetros perimétricos (MD e PSD).
Descritores: Toxoplasmose ocular; Coriorretinite; Campos visuais; Tomografia de coe -rência óptica; Visão de cores; Sensibilidade de contraste
high-contrast VA testing. Therefore, measuring other aspects of visual perception can provide additional information regarding the quality of vision among these patients.
The purpose of this study was to evaluate the visual function and architecture of the central and peripapillary retina in patients with inactive toxoplasmic retinochoroiditis outside the macular and peri-papillary regions (zones 2 and 3).
METHODS
A cross-sectional study was conducted in 20 eyes of 18 patients with inactive ocular toxoplasmic retinochoroiditis (remission ≥3 months) involving zones 2 and 3 with VA ≥20/25 examined between April 2012 and July 2013 at Altino Ventura Foundation, Recife, Brazil. The
Visual function and macular architecture in patients with inactive zone 2
and 3 toxoplasmic retinochoroiditis
Função visual e arquitetura macular em pacientes com retinocoroidite toxoplásmica inativa nas zonas 2 e 3
Mariana Honóriode azevedo1, GuilHerMe lucena Moura1, eduardo nery rossi caMilo1, cristina Muccioli2, tiaGo euGênio Fariae arantes1
Submitted for publication: January 16, 2015 Accepted for publication: June 1, 2015 1 Fundação Altino Ventura, Recife, PE, Brazil.
2 Departamento de Oftalmologia. Universidade Federal de São Paulo (UNIFESP), São Paulo, SP, Brazil.
Funding: No specific financial support was available for this study.
Disclosure of potential conflicts of interest: None of the authors have any potential conflict of interest to disclose.
Corresponding author: Mariana H. Azevedo. Fundação Altino Ventura. Rua da Soledade, 170 - Recife - PE - 50070-040 - Brazil - E-mail: marianahazevedo@hotmail.com
2 7 4 Arq Bras Oftalmol. 2015;78(5):273-7
study followed the tenets of the Declaration of Helsinki and was appro-ved by the Institutional Ethics Committee. Written informed consent was obtained from all subjects.
Each participant underwent an ophthalmologic evaluation that included measurement of the best-corrected VA (BCVA), slit-lamp evaluation, indirect ophthalmoscopy, intraocular pressure measure-ment, spectral domain optical coherence tomography (SDOCT) scan-ning, as well as CS, CV, and VF testing. All examinations for each study participant were performed on the same day.
The topographic location of the retinochoroiditis lesions were recorded using the same classification scheme as for cytomegalovi-rus retinitis (zone 1: lesions located between the temporal vascular ar cades, affecting an area within 3,000 µm of the center of the fovea or 1,500 µm from the edges of the optic disc; zone 2: lesions located outside the boundaries of zone 1 up to the anterior margins of the vortex veins; and zone 3: lesions outside zone 2 up to the ora serrata)(4,5).
Inclusion criteria were as follows: 18 years of age or older, BCVA of 20/25 or better, clear media, spherical refractive error of 0 ± 4.0 diop-ters (D) and astigmatism of 0 ± 2.5 D, and normal intraocular pressure (<22 mmHg). Patients with diabetes mellitus, uncontrolled systemic hypertension, and glaucoma were excluded from the current study. Participants were also excluded if they had any risk factors for the development of glaucoma or any other eye diseases that could affect the study measurements (such as previous intraocular surgery, pre-vious ocular trauma, and retinal or neurologic abnormalities).
The following data were collected: the length of time since the last episode of active retinochoroiditis, size of the largest retinochoroi-dal lesion (<1 optic disc area [da] versus ≥1 da), location of the most posterior lesion (zone 2 versus zone 3), and the number of lesions (unifocal versus multifocal). Figure 1 shows a fundus photograph of an eye with toxoplasmic scars ≥1 da in zone 2.
Optical coherence tomography (OCT ) was performed using RTVue SDOCT (Optovue, Inc, Fremont, CA, USA). All patients underwent standard optic nerve head and macular protocols (ONH and EMM5). Only scans with signal strength index ≥45, proper centering, and no evidence of segmentation algorithm failure were included in the analysis.
Contrast sensitivity and CV were tested under standard illumination condiilluminations. Contrast sensitivity was assessed using the Mars Con -trast Sensitivity Test (Mars Perceptrix, Chappaqua, NY, USA). The log
values of the CS measurements (logCS) were calculated and used in the analysis. A logCS <1.52 was considered abnormal(6). Color vision was determined using the L’Anthony desaturated 15-hue CV test. The color confusion index (C-index) was calculated as described by Vingrys and King-Smith(7). A C-index value of 1.78 or higher was considered abnormal.
Automated static perimetry was performed using the central 10-2 SITA standard program of the Humphrey Field Analyzer (Carl Zeiss Meditec, Dublin, CA, USA). An appropriate lens correction was made for the test distance. Only reliable VFs (false-positive and false-negative results ≤33% and fixation losses ≤20%) were analyzed. Abnormal test results were repeated in order to prevent “first try” effects from inter-fering with the results. The main outcome measures were mean de-viation (MD), pattern standard dede-viation (PSD), and foveal threshold.
Statistical analyses were performed using the software SPSS 16.0 for Windows (SPSS, Inc., Chicago, IL, USA). The distribution of continuous variables was expressed as mean ± standard deviation and of cate-gorical data as frequencies. Relationships between two catecate-gorical variables were assessed using Fisher’s exact test. The Mann-Whitney
U-test was used to assess the difference in quantitative measure-ments between groups. Correlations between quantitative variables were analyzed using Spearman’s correlation coefficient. A p-value of <0.05 was considered statistically significant.
RESULTS
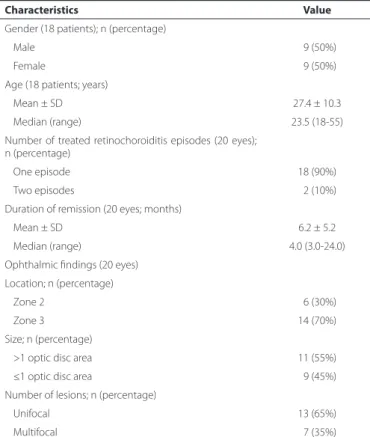
The mean age of the patients was 27.05 ± 10.62 years, with a mean duration of retinochoroiditis remission of 6.15 ± 5.19 months. Table 1 lists the demographic and clinical characteristics of the study sample.
Figure 1. Fundus photograph showing two inactive zone 2 toxoplasmic retinocho-roiditis lesions of ≥1 optic disc area.
Table 1. Demographic and medical data of patients with inactive zone 2 and 3 toxoplasmic retinochoroiditis (n=18 patients, 20 eyes)
Characteristics Value
Gender (18 patients); n (percentage)
Male 09 (50%)
Female 09 (50%)
Age (18 patients; years)
Mean ± SD 27.4 ± 10.3
Median (range) 23.5 (18-55)
Number of treated retinochoroiditis episodes (20 eyes); n (percentage)
One episode 18 (90%)
Two episodes 02 (10%)
Duration of remission (20 eyes; months)
Mean ± SD 6.2 ± 5.2
Median (range) 4.0 (3.0-24.0)
Ophthalmic findings (20 eyes)
Location; n (percentage)
Zone 2 06 (30%)
Zone 3 14 (70%)
Size; n (percentage)
>1 optic disc area 11 (55%)
≤1 optic disc area 09 (45%)
Number of lesions; n (percentage)
Unifocal 13 (65%)
Multifocal 07 (35%)
Table 2 shows the macular and peripapillary retinal nerve fiber layer (RNFL) thicknesses as measured by SDOCT. Foveal thickness and mean and quadrant RNFL measurements were within the 95% normal confidence limits of the device’s database in all eyes.
The mean logCS was 1.64 ± 0.13, and the mean C-index was 1.41 ± 0.61 (Table 3). The prevalence of abnormal CS and CV was 15.0% (three eyes) and 20.0% (four eyes), respectively.
The mean perimetric foveal sensitivity was 30.0 ± 9.29 dB, the mean MD was -4.33 ± 3.93 dB, and the mean PSD was 1.91 ± 1.73 dB; the MD and PSD measurements were outside the 95% normal confi-dence limits of the perimeter’s database in 70.0% (14 eyes) and 35.0% (seven eyes) of eyes, respectively.
Foveal sensitivity was lower in eyes with retinochoroiditis in zone 2 than in zone 3 (p=0.041). Eyes with lesions >1 da also had nonsigni-ficantly lower foveal sensitivity (p=0.055). As shown in table 4, there was a positive correlation between the duration of retinochoroiditis remission and MD (r=0.575; p=0.013), and a negative correlation between the duration of retinochoroiditis remission and PSD (r=-0.593;
p=0.010). There was also a marginally statistically significant positi-ve correlation between the logCS and the duration of remission (r=0.439; p=0.053).
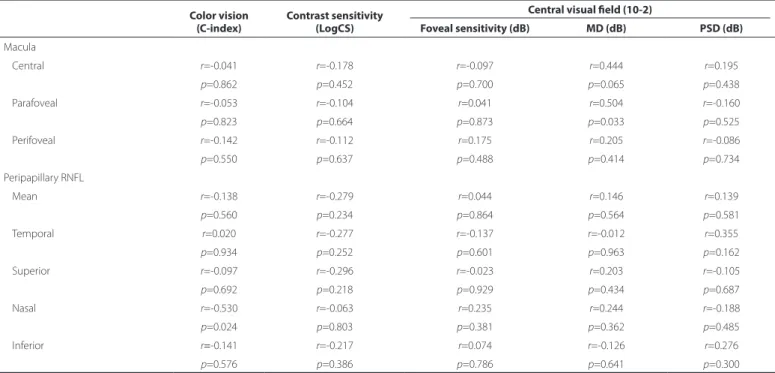
Spearman’s correlation coefficients between visual function pa-rameters and retinal thickness, as measured by SDOCT, are presented in table 5. The correlations between structure and function were mostly non-significant, except for the correlation between parafoveal thickness and MD (r=0.504; p=0.033), and nasal RNFL and the C-index (r=-0.530; p=0.024).
DISCUSSION
Morbidity in uveitic eyes often results from chronic and recurrent episodes of inflammation, and depends on the duration of each epi-sode, the frequency of the attacks, and the anatomic location of the uveitis(8). Ocular toxoplasmosis is a disease that is prevalent worldwide and can lead to legal blindness in at least one eye in approximately 25% of patients(9).
Table 2. Retinal thickness measured in eyes with inactive zone 2 and 3 toxoplasmic retinochoroiditis (n=20)
Macula Peripapillary retinal nerve iber layer
Central macula Parafoveal Perifoveal Mean Temporal Superior Nasal Inferior
All eyes (n=20) 255.9 ± 23.6 328.8 ± 14.4 300.3 ± 15.5 116.2 ± 13.8 87.5 ± 11.1 134.8 ± 20.0 89.11 ± 13.5 151.4 ± 19.7 Location
Zone 2 (n=6) 257.5 ± 27.4 332.5 ± 15.5 302.0 ± 18.0 117.9 ± 13.5 89.8 ± 06.8 137.3 ± 20.8 94.3 ± 14.3 155.1 ± 22.1 Zone 3 (n=14) 255.2 ± 22.9 327.2 ± 14.1 299.6 ± 14.9 115.4 ± 14.3 86.4 ± 12.7 133.6 ± 20.3 86.5 ± 12.9 149.5 ± 19.1
p-value* 0.741 0.591 0.710 0.934 0.430 0.861 0.261 >0.999
Size
≤1 da (n=9) 242.1 ± 23.4 325.2 ± 16.2 302.8 ± 17.7 115.0 ± 18.0 85.0 ± 10.6 130.6 ± 20.7 87.3 ± 16.1 147.3 ± 24.0 >1 da (n=11) 267.2 ± 17.7 331.7 ± 12.7 298.3 ± 13.9 117.1 ± 09.9 89.3 ± 11.6 137.8 ± 19.8 90.5 ± 11.8 154.7 ± 16.0
p-value* 0.020 0.402 0.517 0.518 0.563 0.457 0.722 0.183
Number
Unifocal (n=13) 261.5 ± 18.8 331.5 ± 13.2 302.1 ± 16.5 115.7 ± 14.0 84.3 ± 10.7 134.7 ± 22.3 88.0 ± 14.2 150.2 ± 17.2
Multifocal (n=7) 245.6 ± 29.5 323.7 ± 16.0 297.0 ± 13.8 117.1 ± 14.4 92.9 ± 10.2 134.9 ± 16.9 90.8 ± 13.2 153.3 ± 24.5
p-value* 0.219 0.266 0.691 0.905 0.128 >0.999 0.684 0.821
Values are expressed in micrometers (µm) as mean ± standard deviation; *= Mann-Whitney U-test; da= optic disc area.
Table 3. Color vision, contrast sensitivity, and central visual ield in eyes with inactive zone 2 and 3 toxoplasmic retinochoroiditis (n=20)
Color vision Contrast sensitivity Central visual ield (10-2)
(C-index) (LogCS) Foveal sensitivity (dB) MD (dB) PSD (dB)
All eyes (n=20) 1.41 ± 0.61 1.64 ± 0.13 30.0 ±09.3 -4.30 ± 3.9 1.9 ± 1.7
Location
Zone 2 (n=6) 1.37 ± 0.39 1.62 ± 0.13 23.0 ± 12.1 -5.20 ± 4.7 2.1 ± 2.0
Zone 3 (n=14) 1.43 ± 0.69 1.64 ± 0.14 33.5 ±03.9 -3.90 ± 3.6 1.8 ± 1.7
p-value* 0.617 0.676 0.043 0.349 0.851
Size
≤1 da (n=9) 1.56 ± 0.85 1.69 ± 0.11 34.3 ± 26.6 -3.51 ± 1.0 1.5 ± 0.5
>1 da (n=11) 1.30 ± 0.29 1.60 ± 0.14 26.6 ± 11.2 -5.00 ± 5.2 2.3 ± 2.3
p-value* 0.442 0.090 0.055 0.424 0.657
Number
Unifocal (n=13) 1.34 ± 0.42 1.65 ± 0.15 28.5 ± 11.0 -4.60 ± 4.8 2.1 ± 2.1
Multifocal (n=7) 1.55 ± 0.88 1.62 ± 0.11 33.0 ±03.2 -3.80 ± 0.7 1.6 ± 0.4
p-value* >0.999 0.445 0.638 0.223 0.061
2 7 6 Arq Bras Oftalmol. 2015;78(5):273-7
Table 4. Spearman’s correlation coeicients for contrast sensitivity, color vision, and visual ield versus duration of remission in eyes with inactive zone 2 and 3 toxoplasmic retinochoroiditis (n=20)
Color vision (C-index)
Contrast sensitivity (LogCS)
Central visual ield (10-2)
Foveal sensitivity (dB) MD (dB) PSD (dB)
Duration of remission r=-0.095 r=0.439 r=0.098 r=0.575 r=0.593
p=0.689 p=0.053 p=0.700 p=0.013 p=0.010
MD= mean deviation; PSD= pattern standard deviation.
Table 5. Spearman’s correlation coeicients for contrast sensitivity, color vision, and visual ield versus retinal thickness in eyes with inactive zone 2 and 3 toxoplasmic retinochoroiditis (n=20)
Color vision (C-index)
Contrast sensitivity (LogCS)
Central visual ield (10-2)
Foveal sensitivity (dB) MD (dB) PSD (dB) Macula
Central r=-0.041 r=-0.178 r=-0.097 r=0.444 r=0.195
p=0.862 p=0.452 p=0.700 p=0.065 p=0.438
Parafoveal r=-0.053 r=-0.104 r=0.041 r=0.504 r=-0.160
p=0.823 p=0.664 p=0.873 p=0.033 p=0.525
Perifoveal r=-0.142 r=-0.112 r=0.175 r=0.205 r=-0.086
p=0.550 p=0.637 p=0.488 p=0.414 p=0.734
Peripapillary RNFL
Mean r=-0.138 r=-0.279 r=0.044 r=0.146 r=0.139
p=0.560 p=0.234 p=0.864 p=0.564 p=0.581
Temporal r=0.020 r=-0.277 r=-0.137 r=-0.012 r=0.355
p=0.934 p=0.252 p=0.601 p=0.963 p=0.162
Superior r=-0.097 r=-0.296 r=-0.023 r=0.203 r=-0.105
p=0.692 p=0.218 p=0.929 p=0.434 p=0.687
Nasal r=-0.530 r=-0.063 r=0.235 r=0.244 r=-0.188
p=0.024 p=0.803 p=0.381 p=0.362 p=0.485
Inferior r=-0.141 r=-0.217 r=0.074 r=-0.126 r=0.276
p=0.576 p=0.386 p=0.786 p=0.641 p=0.300
RNFL= retinal nerve fiber layer; MD=mean deviation; PSD= pattern standard deviation.
The location of the lesion is the most important cause of VA re-duction; scars sparing the central retina, juxtapapillary region, and optic disc rarely interfere with VA(9-11). However, mild-to-severe VF da mage is observed even in patients with a VA ≥20/25(10). Toxoplas-mic retinochoroidal scars close to the optic disc are associated with absolute VF defects with breakout to the periphery; this is in contrast to lesions that are distant from the disc, which are more likely to pro-duce relative defects(12). In our study, impairment of visual functions (CS, CV, and central VF sensitivity) was documented in patients with zones 2 and 3 retinochoroiditis and good VA.
In the present study, of the 20 eyes analyzed, three had abnormal CS (15.0%) and four had abnormal CV (20.0%). However, we did not find an association between these parameters and the patients’ cli-nical characteristics or retinal thickness measurements. There was a negative correlation between the C-index and nasal RNFL; however, this association could have been due to chance.
Abnormal MD and/or PSD indices (outside the 95% normal con-fidence limits of the perimeter’s database) were found in up to 70% of the eyes. Foveal sensitivity was lower in eyes with retinochoroiditis in zone 2 than in zone 3 (p=0.041), and there was a marginally sta-tistically significant association between lower foveal sensitivity and larger lesions (p=0.055). This indicates that retinochoroiditis closer to the posterior pole, possibly in addition to larger lesions, may induce
more retinal damage. In a previous report, lesions greater than 1 da persisted longer and had a higher rate of complications and vision loss than smaller lesions did(13).
A longer duration of retinochoroiditis remission was positively correlated with MD (r=0.575; p=0.013) and negatively correlated with PSD (r=-0.593; p=0.010). This could be associated with the amount of time required by the retina and the optic nerve to recover from the initial insults following adequate control of the inflammatory process, which is also found in uveitic macular edema(8).
Retinal thickness measurements, as assessed by SDOCT, do not justify perimetric changes; the only statistically significant associa-tion observed was between MD and parafoveal thickness (r=0.504;
p=0.033). Eyes with a history of cystoid macular edema but with normal foveal morphology also present with a reduction in central retinal sensitivity, as measured by microperimetry(14).
toxoplasmosis, 49 (5.0%) patients presented optic disc swelling, and this was most frequently found in association with an active distant focus of retinochoroiditis(11). Macular serous retinal detachment and cystoid changes have also been described in patients with toxoplas-mic retinochoroiditis not involving zone 1(16,17). Vitreous inflammation secondary to retinochoroiditis can also induce vitreous haze and di sorders of the vitreoretinal interface. Such alterations can resolve without structural damage as detected by commercially available OCT; however, they can be responsible for subtle changes in visual function. The limitations of our study include the small sample size and the crosssectional nature of this investigation. Other technologies, in -cluding microperimetry and multifocal electroretinography, may also offer valuable and additional information. Another limitation is the subjectivity involved in visual function-testing techniques; we did, ho wever, use standardized protocols (i.e., testing distance, lighting con ditions, VF reliability parameters) to minimize this problem. Ocular toxoplasmosis is a relapsing disease; however, most of our patients only presented with one uveitic episode (although 35% presented with multifocal lesions). Cumulative damage associated with multiple relapses could have allowed for the detection of more severe changes.
CONCLUSION
Eyes with inactive zone 2 and 3 toxoplasmic retinochoroiditis and with VA ≥20/25 can present with abnormal color, contrast, and ma-cular perimetric sensitivity despite normal mama-cular and peripapillary retinal architecture. Zone 2 retinochoroiditis was associated with lower foveal threshold sensitivity. A longer duration of remission for ocular toxoplasmosis was associated with improvements in perimetric pa-rameters (MD and PSD).
REFERENCES
1. Holland GN. Ocular toxoplasmosis: a global reassessment. Am J Ophthalmol. 2004; 137(1):1-17.
2. Furtado JM, Winthrop KL, Butler NJ, Smith JR. Ocular toxoplasmosis I: parasitology, epidemiology and public health. Clin Experiment Ophthalmol. 2013;41(1):82-94. 3. Murphy CC, Hughes EH, Frost NA, Dick AD. Quality of life and visual function in patients
with intermediate uveitis. Br J Ophthalmol. 2005;89(9):1161-5.
4. Holland GN, Buhles WC Jr, Mastre B, Kaplan HJ. A controlled retrospective study of ganciclovir treatment for cytomegalovirus retinopathy. Use of a standardized system for the assessment of disease outcome. UCLA CMV Retinopathy. Study Group. Arch Ophthalmol. 1989;107(12):1759-66. Comment in: Arch Ophthalmol. 2011;129(11):1507-8. 5. Cunningham ET, Hubbard LD, Danis RP, Holland GN. Proportionate topographic areas of retinal zones 1, 2, and 3 for use in describing infectious retinitis. Arch Ophthalmol. 2011;129(11):1507-8.
6. Haymes SA, Roberts KF, Cruess AF, Nicolela MT, LeBlanc RP, Ramsey MS, et al. The letter contrast sensitivity test: clinical evaluation of a new design. Invest Ophthalmol Vis Sci. 2006;47(6):2739-45.
7. Vingrys AJ, King-Smith PE. A quantitative scoring technique for panel tests of color vision. Invest Ophthalmol Vis Sci. 1988;29(1):50-63.
8. Sepah YJ, Hatef E, Colantuoni E, Wang J, Shulman M, Adhi FI, et al. Macular sensitivity and fixation patterns in normal eyes and eyes with uveitis with and without macular edema. J Ophthalmic Inflamm Infect. 2012;2(2):65-73.
9. Bosch-Driessen LE, Berendschot TT, Ongkosuwito JV, Rothova A. Ocular toxoplasmosis: clinical features and prognosis of 154 patients. Ophthalmology. 2002;109(5):869-78. 10. Scherrer J, Iliev ME, Halberstadt M, Kodjikian L, Garweg JG. Visual function in human
ocular toxoplasmosis. Br J Ophthalmol. 2007;91(2):233-6.
11. Eckert GU, Melamed J, Menegaz B. Optic nerve changes in ocular toxoplasmosis. Eye (Lond). 2007;21(6):746-51.
12. Stanford MR. The visual field in toxoplasmic retinochoroiditis. Br J Ophthalmol. 2005; 89(7):812-4.
13. Friedmann CT, Knox DL. Variations in recurrent active toxoplasmic retinochoroiditis. Arch Ophthalmol. 1969;81(4):481-93.
14. Kiss CG, Barisani-Asenbauer T, Simader C, Maca S, Schmidt-Erfurth U. Central visual field impairment during and following cystoid macular oedema. Br J Ophthalmol. 2008; 92(1):84-8.
15. Lynch MI, Moraes LF, Malagueño E, Ferreira S, Cordeiro F, Oréfice F. Características clí nicas de 64 indivíduos portadores de uveítis posterior activa presumiblemente toxoplásmica en Pernambuco. Arq Bras Oftalmol. 2008;71(1):43-8.
16. Ouyang Y, Pleyer U, Shao Q, Keane PA, Stübiger N, Joussen AM, et al. Evaluation of cys toid change phenotypes in ocular toxoplasmosis using optical coherence tomo-graphy. PLoS ONE. 2014;9(2):e86626.