Age and Sex Normalization of Intestinal Permeability
Measures for the Improved Assessment of Enteropathy in
Infancy and Early Childhood: Results From the MAL-ED Study
Margaret N. Kosek,
yzGwenyth O. Lee,
§Richard L. Guerrant,
ôRashidul Haque,
jjGagandeep Kang,
ôTahmeed Ahmed,
Pascal Bessong,
yyAsad Ali,
zzEstomih Mduma,
Pablo Pen˜ataro Yori,
§§William A. Faubion,
ôôAldo A.M. Lima,
jjjjMaribel Paredes Olortegui,
Carl Mason,
jjSudhir Babji,
yyyRavinder Singh,
yyShahida Qureshi,
zzzPeter S. Kosek,
Amidou Samie,
zzJohn Pascal,
Sanjaya Shrestha,
yBenjamin J.J. McCormick,
yJessica C. Seidman,
y§§§Dennis R. Lang,
yyAnita Zaidi,
Laura E. Caulfield,
and
§§Michael Gottlieb, the MAL-ED Network
ABSTRACT
Objectives:The aim of the study was to describe changes in intestinal permeability in early childhood in diverse epidemiologic settings.
Methods: In a birth cohort study, the lactulose:mannitol (L:M) test was administered to 1980 children at 4 time points in the first 24 months of life in 8 countries. Data from the Brazil site with an incidence of diarrhea similar to that seen in the United States and no growth faltering was used as an internal study reference to derive age- and sex-specificzscores for mannitol and lactulose recoveries and the L:M ratio.
Results:A total of 6602 tests demonstrated mannitol recovery, lactulose recovery, and the L:M ratio were associated with country, sex, and age. There was heterogeneity in the recovery of both probes between sites with mean mannitol recovery ranging for 1.34% to 5.88%, lactulose recovery of 0.19% to 0.58%, and L:M ratios 0.10 to 0.17 in boys of 3 months of age across different sites. We observed strong sex-specific differences in both mannitol and lactulose recovery, with boys having higher recovery of both probes. Alterations in intestinal barrier function increased in most sites from 3 to 9 months of age and plateaued or diminished from 9 to 15 months of age.
Conclusions: Alterations in recovery of the probes differ markedly in different epidemiologic contexts in children living in the developing world. The rate of change in the L:M-z ratio was most rapid and consistently disparate from the reference standard in the period between 6 and 9 months of age, suggesting that this is a critical period of physiologic impact of enteropathy in these populations.
Key Words:environmental enteropathy, intestinal permeability, lactulose, mannitol, reference values
(JPGN2017;65: 31–39)
I
ntestinal permeability has been assessed and found to be altered in many pathological states including inflammatory bowel dis-ease, celiac disdis-ease, cirrhosis, sepsis, and in environmental entero-pathy (1,2). Abnormalities in intestinal permeability have been implicated as both a result of undernutrition and a cause of growth failure in children living in poverty. Intestinal permeability can be measured using polyethylene glycols of variable sizes (3), CrEDTAWhat Is Known
Intestinal permeability assessments using dual sugar
probe assays are commonly used to assess disease activity in inflammatory bowel disease, celiac disease, and environmental enteropathy.
Abnormalities in intestinal permeability are common
in children living in poverty, likely the result of multiple infections with enteropathogens and undernutrition.
What Is New
There are important differences in the probe
recov-eries between boys and girls.
Probe recoveries and the lactulose:mannitol ratio are
associated with age.
A referencezscore is created to allow for the
evalu-ation of results to a comparable age- and sex-specific population.
The performance of the test in disparate populations
demonstrated aberrant permeability of the probes differed between populations, suggesting that physiologic injury that results from environmental enteropathy is heterogeneous.
See ‘‘Biomarkers of Environmental Enteric Dysfunction: The Good, the Bad, and the Ugly’’ by Jimenez and Duggan on page 4.
Received July 11, 2016; accepted February 27, 2017.
From theDepartment of International Health, Johns Hopkins Bloomberg School of Public Health, Johns Hopkins University, Baltimore, the yFogarty International Center/National Institutes of Health, Bethesda, MD, the zDepartment of Global Community Health and Behavioral Sciences, Tulane University, New Orleans, LA, the §University of Virginia, Charlottesville, VA, theôICDDR, b, Dhaka, Bangladesh, the jjChristian Medical College, Vellore, India, theUniversity of Venda, Thohoyandou, South Africa, theyyCenter of Excellence in Women and
(4), and saccharide probes (5), but for both safety and technical simplicity saccharide probes are the most routinely used (6–8). Saccharides used have included lactulose, mannitol, rhamnose, sucralose, and mixtures of these. Probe sugars share the basic characteristics of being passively absorbed from the gut, minimally metabolized, and excreted in the urine in proportion to the admi-nistered dose. In general, combined saccharide solutions include smaller more permeable mannitol a monosaccharide with a maximal radius of 0.38 nm, a molecular weight of 182 Da and a polar surface area of 121 A˚ ngstro¨m^2 and the larger disaccharide lactulose with a molecular radius of 0.62 nm, a weight of 342 Da, and a polar surface area of 190 A^2 (9). Findings have classically been reported as the ratio of lactulose to mannitol, to compensate for variability related to the subjects including transit time, intestinal surface area, and urine flow that can alter the recovery of the probes. Although transport of mannitol was previously described as transcellular, new evidence supports the in vivo transport, similar to other hydrophilic solutes, to occur principally via 2 distinct pores formed by tight junction proteins including claudins and occludins having diameters 0.5 and 1 nm (10). The relative density of the different pore size concentrates the smaller pores at the villous tip (11) so that decreased mannitol recovery primarily reflects damage to the collective villous surface area, whereas lactulose recovery is thought to reflect permeability to large molecules that is likely to be concentrated in crypts (12).
The lactulose:mannitol (L:M) test has often been used to relate the effect of nutrition or sanitation-based interventions to the gastrointestinal health of children living in poverty (13–18), and several reports have found the L:M ratio (or the recovery of lactulose) to be associated with growth faltering among at-risk infants (7,19,20). The L:M test is also used as an outcome measure in intervention trials aiming to prevent or treat environmental enteropathy and/or child undernutrition (21–23).
The Etiology, Risk Factors and Interactions of Enteric Infections and Malnutrition and the Consequences for Child Health and Development (MAL-ED) is a longitudinal investigation of the inter-relationship of infectious disease morbidity and dietary intakes as they affect child growth, cognitive development, and vaccine efficacy. The study hypothesizes that compromised intes-tinal barrier function is a key biological mediator of these relation-ships (24,25). Using a unified protocol for surveillance and sample collection (25), data from 8 cohorts of approximately 200 infants each from diverse geographic locations was gathered (26–33). Due to repeated sampling in early childhood when changes in permeability are known to occur as the gut matures and becomes less permeable to large molecules, we sought to derive an age-standardized norm. Both age- and sex-specific distributions of mannitol recovery, lactulose recovery, and the L:M ratio were, however, observed across the study sites. Because of apparent age-and sex-related trends in permeability that were independent of environmental exposures, permeability measures were converted to
age- and sex-specificzscores, using the Brazil site as the internal reference population for the cohort. This normalization of the L:M ratio, the percent mannitol recovery, and percent lactulose recovery is intended to provide reference values for a pediatric population for the improved interpretation of intestinal permeability, in particular in reference to the assessment of environmental enteropathy.
METHODS
Etiology, Risk Factors, and Interactions of
Enteric Infections and Malnutrition and the
Consequences for Child Health and
Development Enrollment and Surveillance
The overall design and objectives of the MAL-ED study are presented elsewhere (34), as are descriptions of each site (26–33), and the general methods for the assessment of permeability (35), mor-bidity (25), and growth (36). The sites chosen represented both urban and rural settings, and were located in Dhaka, Bangladesh (BGD); Vellore, India (INV); Bhaktapur, Nepal (NEB); Naushero Feroze, Pakistan (PKN); Fortaleza, Brazil (BRF); Loreto, Peru (PEL); Venda, South Africa (SAV); and Haydom, Tanzania (TZH). Allowing for loss to follow-up, 2145 newborns were enrolled who met following inclusion criteria: <17 days old, born singleton, birth weight>1500 g, no serious illness or congenital anomalies, mother at least 16 years of age, and plans to stay in the community for at least 6 months. Children were not actively screened by serology for celiac disease. Written consent to participate was obtained at enrollment and the procedures for the study were reviewed and approved at each site and at collaborating institutions.
Children had stool samples taken upon detected episodes of diarrhea, monthly to detect the presence of enteropathogens in the first year of life and quarterly in the second year of life. Details of these findings are published (37–40).
Etiology, Risk Factors, and Interactions of
Enteric Infections and Malnutrition and the
Consequences for Child Health and
Development Sample Collection Protocol
The MAL-ED protocol involved L:M testing of infants at 3,6, 9, and 15 months of age within a window of14 days of the child’s day of birth. Children, who were considered generally healthy on the day of testing (eg, who had not vomited or had diarrhea that day), were fasted for a minimum of 2 hours before, and 30 minutes following the administration of the dual probe solution, with the exception of breast milk which was permitted ad libitum. The solution included 250 mg/mL of lactulose and 50 mg/mL of man-nitol (1002 mOsm/L), at a dose of 2 mL/kg up to a maximum of 20 mL. Children were encouraged to void before solution admin-istration, a urine collection bag (Fisher Scientific, Pittsburgh,
Address correspondence and reprint requests to Margaret N. Kosek, Bloomberg School of Public Health, Department of International Health, Johns Hopkins University, 615 North Wolfe St., E5545, Baltimore, MD 21205 ([email protected]).
Supplemental digital content is available for this article. Direct URL citations appear in the printed text, and links to the digital files are provided in the HTML text of this article on the journal’s Web site (www.jpgn.org). The Etiology, Risk Factors and Interactions of Enteric Infections and
Mal-nutrition and the Consequences for Child Health and Development Project (MAL-ED) is carried out as a collaborative project supported by the Bill & Melinda Gates Foundation, the Foundation for the NIH, and the National Institutes of Health, Fogarty International Center.
Members and affiliations of MAL-ED Network available as Supple-mental Digital Content, Material 1,http://links.lww.com/MPG/A980. The authors report no conflicts of interest.
Copyright# 2017 The Author(s). Published by Wolters Kluwer Health, Inc. on behalf of the European Society for Pediatric Gastroenterology, Hepatology, and Nutrition and the North American Society for Pediatric Gastroenterology, Hepatology, and Nutrition. This is an open access article distributed under the Creative Commons Attribution License 4.0 (CCBY), which permits unrestricted use, distribution, and reproduction in any medium, provided the original work is properly cited.
PA, cat #22275347) was placed and changed as needed for the following 5-hour period. Urine volume was measured following voiding and 1 to 2 drops of chlorohexidine (2.35%; Sigma Aldrich, St Louis, MO) was added, after which the samples were aliquoted and stored on ice. Urine aliquots were stored at 708C before testing.
Laboratory Protocols
Analytic protocols are available online as Supplemental Digital Content 2,http://links.lww.com/MPG/A981.
Standardization of Results Between
Laboratories and Calculation of
Lactulose:Mannitol
z
Scores
Urinary concentrations of mannitol and lactulose and urine volumes were used to calculate percent mannitol recovery (urine concentration mannitol [mg/L] urine volume [L] 100/total mannitol dosed [mg]), percent lactulose recovery (urine concen-tration lactulose [mg/L]urine volume [L]100/total lactulose dosed [mg]), and the L:M ratio (% lactulose recovered/% mannitol recovered).
Results were excluded for the following reasons: no mannitol or lactulose peak was detected by the laboratory; the calculated mannitol or lactulose excretion was>100%; the urine collection time was significantly longer (>5.5 hours) or shorter (<4.5 hours) than protocol; specific problems occurred during the L:M procedure were noted (eg, difficulties with ingestion, urine spillage, or fecal contamination of a portion of the urine collected during the 5-hour period following administration).
When the L:M test was performed outside of the protocol window (>14 days before or after the scheduled date), the results were still included as long as they were within30 days of the scheduled date.
To standardize tests results across the laboratories, adjusted results were calculated by multiplying each laboratory results by a correction factor determined based on available quality control data. Details of the standardization are provided in Supplemental Digital Content 3,http://links.lww.com/MPG/A982.
For analyses, the percent lactulose excretion, percent man-nitol excretion, and L:M ratios were examined by sex, age, and site. Because consistent trends were noted by age and sex across sites, observed values were transformed into z scores that could be interpreted as a measure of relative permeability adjusting for these
factors. The BRF site had no deviation in anthropometry from the WHO growth standards with a mean LAZ of 0 at 24 months of age and was therefore chosen to represent what were expected to be the least abnormal gut permeability values. Typical patterns of progressive postnatal linear growth failure were seen in the remain-ing 7 sites with LAZ rangremain-ing between1.3 in Nepal to2.7 in Tanzania at 24 months. Therefore, the BRF data were used as the internal MAL-ED reference.
Visual inspection of Q-Q plots and tests of normality (Shapiro-Wilks test and tests of skewness and kurtosis) were used to determine appropriate Box-Cox transformations of the BRF percent mannitol excretion, percent lactulose excretion, and L:M ratio estimated separately for each age and sex.
The same parameters from the Box-Cox transformation taken for the BRF site were then applied to variables from each other site, approximating normality, but preserving differential patterns in each site. Each of the adjusted percent mannitol, percent lactulose, and L:M ratio, after Box-Cox transformation, were then scaled relative to the distribution of the BRF data (ie, ðXmBRF;age;sexÞ=dBRF;age;sex). Consequently, thezscores of the BRF data at each age and both sexes is approximately a standard normal distribution (ie, mean 0, standard deviation 1).
We then calculated confidence intervals for the 5th, 10th, 25th, 50th, 75th, 90th, and 95th percentiles of these distributions based on both parametric and non-parametric methods. Because the number of children in each category within the Brazil site was relatively small (100 per combination of age and sex), extreme values could not be transformed to z scores with precision. Therefore, we chose not estimate exactzscores above the 90th percentile, but rather to indicate all values above this cutoff categorically (90%).
In addition, binary variables (percent lactulose, and L:M above or below the 90th percentile of the BRF site and percent mannitol below the 10th percentile of the BRF site) were each calculated. Sample calculations for Box-Cox transformations are available online as Supplemental Digital Content 4, Values for Box-Cox Transformations,http://links.lww.com/MPG/A983; Supple-mental Digital Content 5, Mean (SD) used for Box-Cox Transform-ations,http://links.lww.com/MPG/A984; and Supplemental Digital Content 6, Conversion of %L, %M, and L:M results from Brazil to age- and sex-specific z scores as reference, http://links.lww.com/ MPG/A985
RESULTS
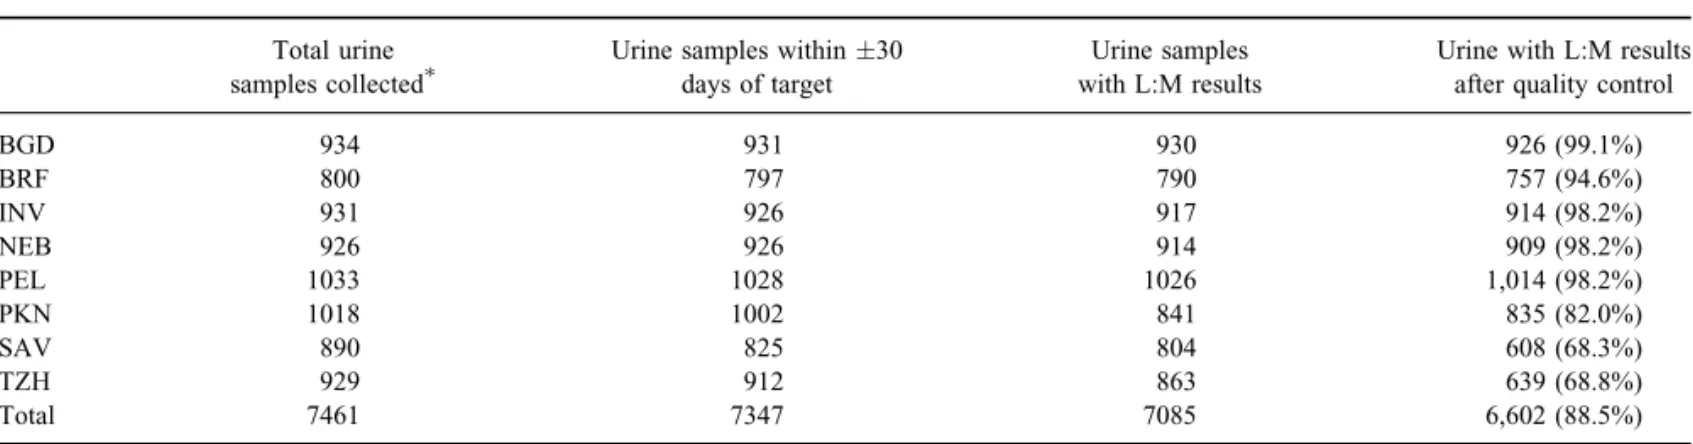
Of a potential 8580 urine collections possible (4 per child for 2145 unique children enrolled in the study), 829 (9.7%) were not completed because the child withdrew from the study before the
TABLE 1. Total results available
Total urine samples collected
Urine samples within30 days of target
Urine samples with L:M results
Urine with L:M results after quality control
BGD 934 931 930 926 (99.1%)
BRF 800 797 790 757 (94.6%)
INV 931 926 917 914 (98.2%)
NEB 926 926 914 909 (98.2%)
PEL 1033 1028 1026 1,014 (98.2%)
PKN 1018 1002 841 835 (82.0%)
SAV 890 825 804 608 (68.3%)
TZH 929 912 863 639 (68.8%)
Total 7461 7347 7085 6,602 (88.5%)
BGD¼Dhaka, Bangladesh; BRF¼Fortaleza, Brazil; INV¼Vellore, India; L:M¼lactulose:mannitol; NEB¼Bhaktapur, Nepal; PKN¼Naushero Feroze, Pakistan; PEL¼Loreto, Peru; SAV¼Venda, South Africa; TZH¼Haydom, Tanzania.
scheduled date, and 290 (3.4%) were not completed for other reasons. Of the 7461 completed urine collections, 7347 (98.5%) occurred within 30 days of the scheduled date, and 7047 (94.4%) occurred within14 days (Tables 1 and 2). A total of 7347 had laboratory results available. Of the remainder, 61 did not have results due to specific site or laboratory issues, and the remaining 144 lacked a result because the sample quantity was not sufficient to run the test. Of the 7260 urine collections completed with laboratory results available, 581 were flagged during quality control checks. The most common reason for flagging a result was that the reported urine collection time was less than 4 and a half hours (n¼322), followed by a reported urine collection time longer than 5 and a half hours (n¼190). Fifty-eight results were flagged because no mannitol peak was observed, 34 were flagged because no lactulose peak was observed, and 9 results were flagged because either the calculated percent mannitol recovery, or the calculated percent lactulose recov-ery, was>100%. An additional 2 results where the dosage of the L:M solution given to the child was not known, and 75 results that were not flagged by quality control checks, but were collected>30 days before or after the scheduled test date, were also excluded, leading to a final total of 6602 results included in analysis.
Out of 2145 study participants, 1980 had at least 1 complete L:M result available (run within 30 days of ideal date). One hundred thirty-eight children had only 1 complete L:M test avail-able, 245 had 2 complete L:M tests, 414 had 3 complete tests, and 1183 had 4 complete L:M tests available.
Mannitol and Lactulose Recovery
Across all sites and ages, the geometric mean adjusted percent mannitol recovery was 2.1%, and the geometric mean adjusted percent lactulose recovery was 0.28% (Fig. 1A and B). Both percent mannitol and percent lactulose recoveries were high-est in the younghigh-est age group (percent mannitol¼2.1, 1.9, 1.8, and 1.8%, and percent lactulose¼0.28, 0.23, 0.20, and 0.18% at 3, 6, 9, and 15 months of age, respectively).
Sex differences in percent mannitol and percent lactulose recoveries were also observed. Percent mannitol and percent lac-tulose recoveries were significantly higher in boys than in girls at all ages, although this sex difference was less pronounced at older ages (mannitol¼2.5% vs 1.8% at 3 months, 2.4% vs 1.5% at 6 months, 2.1% vs 1.5% at 9 months, and 2.0% vs 1.5% at 15 months of age; lactulose¼0.31% vs 0.24% at 3 months, 0.27% vs 0.19% at 6 months, 0.23% vs 0.18% at 9 months, and 0.20% vs 0.17% at 15 months of age). These differences were due to urinary
concentrations of both lactulose and mannitol were higher in boys than in girls (geometric means 2.22 mmol mannitol/L vs 1.77 mmol mannitol/L and 0.66 mmol lactulose/L and 0.57 mmol lactulose/L); and boys tended to produce greater volumes of urine during the 5-hour urine collection test than girls (mean urine volumes of 63.5 vs 50.3 mL at 3 months, 52.3 vs 41.9 mL at 6 months, 49.2 vs 42.7 mL at 9 months, and 54.0 vs 48.6 mL at 15 months).
Children in 4 sites (BGD, INV, NEB, and PEL) had percent mannitol recoveries that were higher than that of BRF at most or all
TABLE 2. Total samples available by age
3 6 9 15 Overall
Boys Girls Boys Girls Boys Girls Boys Girls Boys Girls
BGD 120 123 115 122 113 115 107 111 455 471
BRF 101 99 99 97 97 89 93 82 390 367
INV 105 125 102 128 105 124 102 123 414 500
NEB 124 109 125 106 123 104 119 99 491 418
PEL 152 126 144 124 133 113 124 98 553 461
PKN 111 102 102 109 109 106 100 96 422 413
SAV 81 77 68 70 74 67 88 83 311 297
TZH 86 74 78 84 80 80 81 76 325 314
Total 880 835 833 840 834 798 814 768 3361 3241
BGD¼Dhaka, Bangladesh; BRF¼Fortaleza, Brazil; INV¼Vellore, India; NEB¼Bhaktapur, Nepal; PKN¼Naushero Feroze, Pakistan; PEL¼ Loreto, Peru; SAV¼Venda, South Africa; TZH¼Haydom, Tanzania.
0
5
10
15
Adjusted % mannitol
excretion
BGD BRF INV NEB PEL PKN SAV TZH
Site A
B
C
0
.5
1
1.5
2
Adjusted % lactulose
excretion
BGD BRF INV NEB PEL PKN SAV TZH
Site
BGD BRF INV PEL Lab:
BGD BRF INV PEL Lab:
0
.5
1
1.5
2
2.5
Adjusted L:M ratio
BGD BRF INV NEB PEL PKN SAV TZH
Site
BGD BRF INV PEL
Lab:
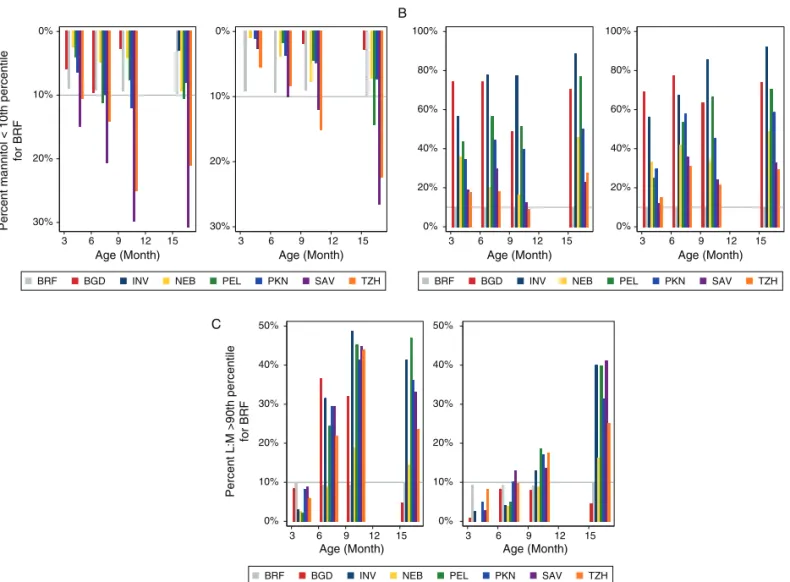
ages, whereas children at 2 sites (TZH and SAV) had mannitol percent mannitol recoveries that were similar to or below those from BRF at most ages (Table 3 and Fig. 2A). In every site, the percent lactulose recovery was relatively greater than that of BRF at almost all combinations of age and sex (Table 4 and Fig. 2B). The meanz scores for mannitol and lactulose recovery by site and age are shown in Figure 3A and B.
Lactulose:Mannitol Ratio
The L:M ratio decreased with age in the reference site (BRF) from 3 to 9 months and stabilized between 9 and 15 months of age (Table 5). In 3 sites (BGD, NEB, PKN), L:M decreased with age, and in the other 4 sites, it increased with age (INV, PEL) or remained roughly stable with age (SAV and TZH). Overall, there was a trend of higher L:M ratios among girls than boys, but this difference was not significant across most age and sites.
Relative to BRF, children from most sites had L:M scores that were similar at 3 months of age, but were elevated at 6, 9, and 15 months of age (Table 5), and differences between sites in L:M ratios were generally more pronounced in boys than in girls
(Fig. 2C). Mean values of mannitol and lactulose recoveries and the L:M ratio for children in BRF are shown for reference (Supplemental Digital Content, Table 3, Conversion of %lactulose, %mannitol, and L:M results tozscores,http://links.lww.com/MPG/ A985). The mean L:Mzscore by site and age is shown in Figure 3C.
DISCUSSION
The MAL-ED study provides a rich source of information on intestinal permeability during early child as it is the largest study of the L:M test ever conducted in young children, utilizing a common protocol with strict quality assurance across 8 sites around the world. Although intestinal permeability tests have been used for some time, the failure of different groups to use a common dose of probes, urine collection time, analytic methodology for the determination of analytes in urine, and procedures for results reporting all lead to a constricted capacity to interpret test results across study populations (41). This study addresses these limitations to allow for a robust comparison of intestinal permeability as measured by the lactulose mannitol assay across 8 geographically and epidemiologically diverse sites.
A limitation of the study was the need to process samples in different laboratories. We have previously reported on the improved performance of LC-MS/MS as compared to HPLC-PAD, particularly in the accurate quantification of lactulose (42). To address this limita-tion, 40 standards representing a wide range of concentrations in urine were used to standardize findings across platforms in the native matrix with values measured in a reference LC-MS/MS laboratory. This combined with the common administration and collection protocol allows for the robust comparison of findings across sites. Another limitation was the lack of testing for celiac disease in this study. Although the condition is too rare to have influenced our conclusions, they would have been an interesting comparator group from which to derive a more complete understanding of the relative severity of environmental enteropathy in these contexts.
Mannitol recoveries were the lowest in TZH, SAV, and PKN and varied 3-fold in boys and 5-fold in girls between TZH and INV, the site with the highest mannitol permeability at 3 months of age. Although the relative differences between populations attenuated somewhat with age, disparate trajectories were apparent, with NEB, INV, and PEL showing larger mannitol recoveries at each time point suggesting that villous integrity is greater in these epidemio-logic contexts. In the setting of environmental enteropathy where malabsorption is thought to have a role in suboptimal growth of children, this suggests that the risk of malabsorption is hetero-geneous in different high-risk and high-prevalence populations for environmental enteropathy.
Lactulose recovery was the highest in INV and BGD and the lowest in BRF and SAV. Differences in permeability to lactulose across sites at different time points varied from 2- to 6-fold relative to the reference population demonstrating significant and important differences in the permeability of the gut to this larger probe across these contexts.
The average L:M ratio was higher than the 0.02 seen in US and European norms (43), it was lowest in BRF, highest in PEL, PKN, and BGD, and generally decreased as children aged. The sex differences present for each of the probes in turn were largely absent in the L:M ratio, highlighting the difficulty in interpreting the ratio. When considering the L:M ratio, 5 of 6 sites were elevated relative to BRF, but interestingly, the probe driving this increase varied. In NEB, although both mannitol and lactulose recoveries were elev-ated relative to BRF, they were elevelev-ated to a similar degree, leading to a similar L:M ratio between the 2 sites. In SAV and TZH, lower mannitol excretion was the major driver of L:M, whereas in the Southeast Asian sites and PEL, lactulose was the more important determinant of the ratio similar to recent reports (44).
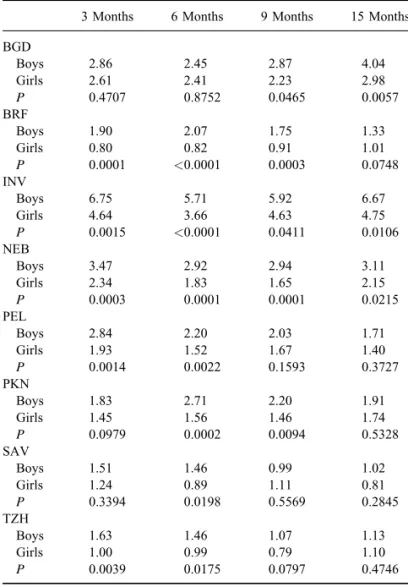
TABLE 3. Percent mannitol recovery-adjusted results by age, sex and site (geometric means;Pvalues based offttests comparison of logged concentrations)
3 Months 6 Months 9 Months 15 Months
BGD
Boys 2.86 2.45 2.87 4.04
Girls 2.61 2.41 2.23 2.98
P 0.4707 0.8752 0.0465 0.0057
BRF
Boys 1.90 2.07 1.75 1.33
Girls 0.80 0.82 0.91 1.01
P 0.0001 <0.0001 0.0003 0.0748
INV
Boys 6.75 5.71 5.92 6.67
Girls 4.64 3.66 4.63 4.75
P 0.0015 <0.0001 0.0411 0.0106
NEB
Boys 3.47 2.92 2.94 3.11
Girls 2.34 1.83 1.65 2.15
P 0.0003 0.0001 0.0001 0.0215
PEL
Boys 2.84 2.20 2.03 1.71
Girls 1.93 1.52 1.67 1.40
P 0.0014 0.0022 0.1593 0.3727
PKN
Boys 1.83 2.71 2.20 1.91
Girls 1.45 1.56 1.46 1.74
P 0.0979 0.0002 0.0094 0.5328
SAV
Boys 1.51 1.46 0.99 1.02
Girls 1.24 0.89 1.11 0.81
P 0.3394 0.0198 0.5569 0.2845
TZH
Boys 1.63 1.46 1.07 1.13
Girls 1.00 0.99 0.79 1.10
P 0.0039 0.0175 0.0797 0.4746
In the face of accepted interpretation of the test, the popu-lations with the most abnormal mannitol and lactulose recoveries relative to BRF in this study, or reference norms reported in the literature (based on US or European populations) were not the same, which was somewhat unexpected. Most published reports using the lactulose mannitol probes to assess permeability report only the lactulose mannitol ratio, or the lactulose recovery as lactulose is thought to better represent the risk of intestinal permeability to larger antigens, leading to intestinal and systemic immune activation. This has been called into question, because these small hydrophilic probes are 2 to 3 orders of magnitude smaller than antigens, viruses, or bacteria and given their size and physiochemical characteristics these probes are unlikely to be transported by the same pathways as the other larger molecules that permeate the intestine in certain pathologic states (9,45). Even food antigens and small peptides are>600 Da, twice the size of lactulose. Although permeability to the larger molecules is likely to be accompanied by higher lactulose permeability, there is a large range of increased permeability measured by the L:M assay that is likely below the threshold of antigenic translocation and immune activation. Our findings strongly suggest that adequate descrip-tions of intestinal permeability following the administration of lactulose and mannitol should describe the recovery of each probe separately in addition to reporting the L:M ratio. Delinking the
recovery of lactulose and mannitol additionally suggests diverse patterns of intestinal injury in different epidemiologic contexts, and the recognition and characterization of this may be important in both understanding the condition of environmental enteropathy and guiding interventions to ameliorate it. Our group has also recently described that individual pathogens, particularly with Giardia (39) and Campylobacter (40), have important effects on intestinal permeability as measured by the lactulose mannitol test and clearly the difference distribution of enteropathogens may contribute to this diversity.
One of the most notable findings of this large study is that there are significant and sizable differences in intestinal permeability associated with sex. Boys had higher urinary recovery of mannitol than girls. Differences in mannitol recovery by sex were consistent, significant, and highly reproducible across sites at the 4 ages assessed, and consistently varied by>50% in most countries at most time points. There are some reports of changes in intestinal permeability by sex in the literature (11,46), but results have been conflicting on this point (47), and have relatively small sample sizes. There are different levels of estradiol and bioavailable estradiol in infants at 3 months of age, the age at which we did our first lactulose mannitol assay (48). Estrogen receptor agonists have been shown to effect claudin expression in the placenta, and in rabbit models estradiol potentiates occluding expression and attenuated augmented
30% 20% 10% 0%
A B
C
Percent mannitol < 10th percentile
for BRF
3 6 9 12 15
Age (Month)
30% 20% 10% 0%
3 6 9 12 15
Age (Month)
BRF BGD INV NEB PEL PKN SAV TZH
0% 20% 40% 60% 80% 100%
3 6 9 12 15
Age (Month)
0% 20% 40% 60% 80% 100%
3 6 9 12 15
Age (Month)
BRF BGD INV NEB PEL PKN SAV TZH
0% 10% 20% 30% 40% 50%
Percent L:M >90th percentile
for BRF
3 6 9 12 15
Age (Month)
0% 10% 20% 30% 40% 50%
3 6 9 12 15
Age (Month)
BRF BGD INV NEB PEL PKN SAV TZH
permeability associated with acid exposure and oxidative irritants (49). Recent in vitro work in intestinal injury models show estrogen increases mucus production and decreases permeability following oxidative stress. Although these findings are in animal and explant systems, they do provide putative mechanisms that may explain our findings. Furthermore, the consistency and degree of differences warrant different normative values be reported by sex for the improved interpretation of permeability assays.
Age-dependent changes in intestinal permeability are exten-sively described in the first month of life and to a lesser extent in elderly populations (50 – 53). More recently, detailed studies suggest that there are modest but appreciable differences that extend through early adulthood (11,54). We sought to derive an age-specific reference to allow changes in permeability over early life to be analyzed as a function of environmental and nutritional exposures independent of age. When we determined that sex was also an important determinant of probe recovery, we also normal-ized by sex. Thezscores derived from this study may have utility for other groups evaluating permeability using similar protocols for dosage and collection time. Although standardization of the dosage is broadly understood, it is important to use standard
collection times as it will affect the probe percent recovery and to a lesser extent the L:M ratio (55). The use of the z scores developed here will enable the improved accuracy of the interpret-ation of these tests in individual children and improve causal inference in intervention studies where changes in permeability are assessed as an outcome.
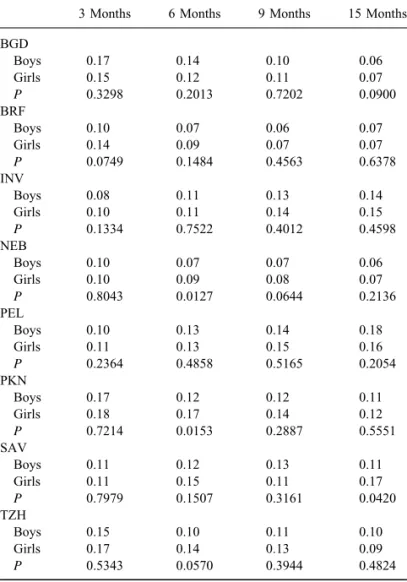
Acknowledgments:The Etiology, Risk Factors and Interactions of Enteric Infections and Malnutrition and the Consequences for Child Health and Development Project (MAL-ED) is carried out as a collaborative project supported by the Bill & Melinda Gates Foundation, the Foundation for the National Institutes of Health, and the National Institutes of Health, Fogarty International Center. The authors particularly want to thank the children and caregivers who participated in the study for their invaluable contributions. The authors also wish to thank Thomas Brewer for discussions on changes in intestinal permeability over the lifespan, and Dr William Petri for his support in coordinating QC activities between the MAL-ED study and the PROVIDE study and. The TABLE 4. Percent lactulose recovery-adjusted results by age, sex and
site (geometric means;Pvalues based offttests comparison of logged concentrations)
3 Months 6 Months 9 Months 15 Months
BGD
Boys 0.49 0.35 0.29 0.23
Girls 0.40 0.29 0.23 0.20
P 0.0670 0.1158 0.0775 0.1633
BRF
Boys 0.20 0.14 0.10 0.08
Girls 0.11 0.07 0.06 0.07
P 0.0001 <0.0001 0.0006 0.1048
INV
Boys 0.55 0.62 75 1.03
Girls 0.47 0.42 0.66 0.76
P 0.1852 0.0014 0.2733 0.0080
NEB
Boys 0.32 0.21 0.20 0.17
Girls 0.23 0.15 0.13 0.14
P 0.0013 0.0011 <0.0001 0.0504
PEL
Boys 0.33 0.33 0.34 0.35
Girls 0.25 0.22 0.28 0.25
P 0.0017 <0.0001 0.0899 0.0465
PKN
Boys 0.30 0.30 0.26 0.20
Girls 0.23 0.24 0.18 0.20
P 0.0163 0.0727 0.0058 0.9910
SAV
Boys 0.17 0.15 0.12 0.10
Girls 0.14 0.13 0.12 0.10
P 0.1418 0.3036 0.7722 0.9334
TZH
Boys 0.21 0.16 0.13 0.11
Girls 0.14 0.13 0.09 0.09
P 0.0006 0.1087 0.0095 0.1804
BGD¼Dhaka, Bangladesh; BRF¼Fortaleza, Brazil; INV¼Vellore, India; NEB¼Bhaktapur, Nepal; PKN¼Naushero Feroze, Pakistan; PEL¼ Loreto, Peru; SAV¼Venda, South Africa; TZH¼Haydom, Tanzania.
−2
−1
0
1
2
%Man−Z
3 6 9 12 15
Age (Month)
−2
−1
0
1
2
%Lac−Z
3 6 9 12 15
Age (Month)
−2
−1
0
1
2
LMZ
3 6 9 12 15
Age (Month)
BRF BGD INV NEB PEL PKN SAV TZH
A
B
C
authors thank the mothers and their children for their time and patience during the urine collections and our field staff for their extraordinary dedicated effort.
REFERENCES
1. Travis S, Menzies I. Intestinal permeability: functional assessment and significance.Clin Sci1992;82:471–88.
2. Bjarnason I, MacPherson A, Hollander D. Intestinal permeability: an overview.Gastroenterology1995;108:1566–81.
3. Soderholm JD, Olaison G, Kald A, et al. Absorption profiles for polyethylene glycols after regional jejunal perfusion and oral load in healthy humans.Dig Dis Sci1997;42:853–7.
4. Camilleri M, Madsen K, Spiller R, et al. Intestinal barrier function in health and gastrointestinal disease.Neurogastroenterol Motil2012;24: 503–12.
5. Menzies IS, Laker MF, Pounder R, et al. Abnormal intestinal perme-ability to sugars in villous atrophy.Lancet1979;2:1107–9.
6. Kelly P, Menzies I, Crane R, et al. Responses of small intestinal architecture and function over time to environmental factors in a tropical population.Am J Trop Med Hyg2004;70:412–9.
7. Lunn PG, Northrop-Clewes CA, Downes RM. Intestinal permeability, mucosal injury, and growth faltering in Gambian infants. Lancet
1991;338:907–10.
8. Campbell DI, Elia M, Lunn PG. Growth faltering in rural Gambian infants is associated with impaired small intestinal barrier function, leading to endotoxemia and systemic inflammation.J Nutr2003;133: 1332–8.
9. Jenkins RT, Bell RA. Molecular radii of probes used in studies of intestinal permeability.Gut1987;28:110–1.
10. Linnankoski J, Makela J, Palmgren J, et al. Paracellular porosity and pore size of the human intestinal epithelium in tissue and cell culture models.J Pharm Sci2010;99:2166–75.
11. McOmber ME, Ou CN, Shulman RJ. Effects of timing, sex, and age on site-specific gastrointestinal permeability testing in children and adults.
J Pediatr Gastroenterol Nutr2010;50:269–75.
12. Menard S, Cerf-Bensussan N, Heyman M. Multiple facets of intestinal permeability and epithelial handling of dietary antigens. Mucosal Immunol2010;3:247–59.
13. Galpin L, Manary MJ, Fleming K, et al. Effect of Lactobacillus GG on intestinal integrity in Malawian children at risk of tropical enteropathy.
Am J Clin Nutr2005;82:1040–5.
14. Goto R, Panter-Brick C, Northrop-Clewes CA, et al. Poor intestinal permeability in mildly stunted Nepali children: associations with wean-ing practices and Giardia lamblia infection. Br J Nutr 2002;88: 141–9.
15. Goto R, Mascie-Taylor CG, Lunn PG. Impact of intestinal permeability, inflammation status and parasitic infections on infant growth faltering in rural Bangladesh.Br J Nutr2009;101:1509–16.
16. Filteau SM, Rollins NC, Coutsoudis A, et al. The effect of antenatal vitamin A and beta-carotene supplementation on gut integrity of infants of HIV-infected South African women.J Pediatr Gastroenterol Nutr
2001;32:464–70.
17. Lin A, Arnold BF, Afreen S, et al. Household environmental conditions are associated with enteropathy and impaired growth in rural Bangla-desh.Am J Trop Med Hyg2013;89:130–7.
18. van der Merwe LF, Moore SE, Fulford AJ, et al. Long-chain PUFA supplementation in rural African infants: a randomized controlled trial of effects on gut integrity, growth, and cognitive development.Am J Clin Nutr2013;97:45–57.
19. Panter-Brick C, Lunn PG, Langford RM, et al. Pathways leading to early growth faltering: an investigation into the importance of mucosal damage and immunostimulation in different socio-economic groups in Nepal.Br J Nutr2009;101:558–67.
20. Weisz AJ, Manary MJ, Stephenson K, et al. Abnormal gut integrity is associated with reduced linear growth in rural Malawian children.J Pediatr Gastroenterol Nutr2012;55:747–50.
21. Smith HE, Ryan KN, Stephenson KB, et al. Multiple micronutrient supplementation transiently ameliorates environmental enteropathy in Malawian children aged 12–35 months in a randomized controlled clinical trial.J Nutr2014;144:2059–65.
22. Ryan KN, Stephenson KB, Trehan I, et al. Zinc or albendazole attenuates the progression of environmental enteropathy: a randomized controlled trial.Clin Gastroenterol Hepatol2014;12:1507–13e1.
23. Prendergast AJ, Humphrey JH, Mutasa K, et al. Assessment of envir-onmental enteric dysfunction in the SHINE Trial: methods and chal-lenges.Clin Infect Dis2015;61(suppl 7):S726–32.
24. Kosek M, Guerrant RL, Kang G, et al. Assessment of environmental enteropathy in the MAL-ED cohort study: theoretical and analytic framework.Clin Infect Dis2014;59(suppl 4):S239–47.
25. Richard SA, Barrett LJ, Guerrant RL, et al. Disease surveillance methods used in the 8-site MAL-ED cohort study.Clin Infect Dis
2014;59(suppl 4):S220–4.
26. Ahmed T, Mahfuz M, Islam MM, et al. The MAL-ED cohort study in Mirpur, Bangladesh.Clin Infect Dis2014;59(suppl 4):S280–6.
27. Lima AA, Oria RB, Soares AM, et al. Geography, population, demo-graphy, socioeconomic, anthropometry, and environmental status in the MAL-ED cohort and case-control study Sites in Fortaleza, Ceara, Brazil.Clin Infect Dis2014;59(suppl 4):S287–94.
28. John SM, Thomas RJ, Kaki S, et al. Establishment of the MAL-ED birth cohort study site in Vellore. Southern India Clin Infect Dis
2014;59(suppl 4):S295–9. TABLE 5. Lactulose:mannitol ratio-adjusted results by age, sex and site
(geometric means;Pvalues based offttests comparison of logged concentrations)
3 Months 6 Months 9 Months 15 Months
BGD
Boys 0.17 0.14 0.10 0.06
Girls 0.15 0.12 0.11 0.07
P 0.3298 0.2013 0.7202 0.0900
BRF
Boys 0.10 0.07 0.06 0.07
Girls 0.14 0.09 0.07 0.07
P 0.0749 0.1484 0.4563 0.6378
INV
Boys 0.08 0.11 0.13 0.14
Girls 0.10 0.11 0.14 0.15
P 0.1334 0.7522 0.4012 0.4598
NEB
Boys 0.10 0.07 0.07 0.06
Girls 0.10 0.09 0.08 0.07
P 0.8043 0.0127 0.0644 0.2136
PEL
Boys 0.10 0.13 0.14 0.18
Girls 0.11 0.13 0.15 0.16
P 0.2364 0.4858 0.5165 0.2054
PKN
Boys 0.17 0.12 0.12 0.11
Girls 0.18 0.17 0.14 0.12
P 0.7214 0.0153 0.2887 0.5551
SAV
Boys 0.11 0.12 0.13 0.11
Girls 0.11 0.15 0.11 0.17
P 0.7979 0.1507 0.3161 0.0420
TZH
Boys 0.15 0.10 0.11 0.10
Girls 0.17 0.14 0.13 0.09
P 0.5343 0.0570 0.3944 0.4824
Results from the same laboratory (BR, NP, SA, and TZ) are highlighted in gray.
29. Shrestha PS, Shrestha SK, Bodhidatta L, et al. Bhaktapur, Nepal: the MAL-ED birth cohort study in Nepal.Clin Infect Dis2014;59(suppl 4):S300–3.
30. Yori PP, Lee G, Olortegui MP, et al. Santa Clara de Nanay: the MAL-ED cohort in Peru.Clin Infect Dis2014;59(suppl 4):S310–6.
31. Turab A, Soofi SB, Ahmed I, et al. Demographic, socioeconomic, and health characteristics of the MAL-ED network study site in rural Pakistan.Clin Infect Dis2014;59(suppl 4):S304–9.
32. Bessong PO, Nyathi E, Mahopo TC, et al. Development of the Dzimauli community in Vhembe District, Limpopo province of South Africa, for the MAL-ED cohort study. Clin Infect Dis 2014;59(suppl 4): S317–24.
33. Mduma ER, Gratz J, Patil C, et al. The etiology, risk factors, and interactions of enteric infections and malnutrition and the consequences for child health and development study (MAL-ED): description of the Tanzanian site.Clin Infect Dis2014;59(suppl 4):S325–30.
34. Investigators M-EN. The MAL-ED study: a multinational and multi-disciplinary approach to understand the relationship between enteric pathogens, malnutrition, gut physiology, physical growth, cognitive development, and immune responses in infants and children up to 2 years of age in resource-poor environments. Clin Infect Dis
2014;59(suppl 4):S193–206.
35. Kosek M, Guerrant RL, Kang G, et al., the MAL-ED network. Assessment of environmental enteropathy in the MAL-ED Cohort Study: theoretical and analytical frameworkClin Infect Dis2014;59(suppl 4):S239–47.
36. Richard SA, McCormick BJ, Miller MA, et al., Investigators MAL-ED. Modeling environmental influences on child growth in the MAL-ED cohort study: opportunities and challenges.Clin Infect Dis2014;59(suppl 4): S255–60.
37. Platts-Mills JA, Babji S, Bodhidatta L, et al. Pathogen-specific burdens of community diarrhoea in developing countries: a multisite birth cohort study (MAL-ED).Lancet Glob Health2015;3:e564–75.
38. Rouhani S, Penataro Yori P, Paredes Olortegui M, et al. Norovirus infection and acquired immunity in 8 countries: results from the MAL-ED study.Clin Infect Dis2016;62:1210–7.
39. Rogawski ET, Bartelt LA, Platts-Mills JA, et al.; and the MAL-ED Network. Determinants and impact of Giardia infections in the first two years of life in the MAL-ED cohort. J Pediatr Infect Dis Soc 2017. [Epub ahead of print]. February 2015.
40. Amour C, Gratz J, Mduma E, et al. Epidemiology and impact of campylobacter infection in children in 8 low-resource settings: results from the MAL-ED study.Clin Infect Dis2016;63:1171–9.
41. Denno DM, VanBuskirk K, Nelson ZC, et al. Use of the lactulose to mannitol ratio to evaluate childhood environmental enteric dysfunction: a systematic review.Clin Infect Dis2014;59(suppl 4):S213–9.
42. Lee GO, Kosek P, Lima AA, et al. Lactulose:mannitol diagnostic test by HPLC and LC-MSMS platforms: considerations for field studies of intestinal barrier function and environmental enteropathy.J Pediatr Gastroenterol Nutr2014;59:544–50.
43. Lostia AM, Lionetto L, Principessa L, et al. A liquid chromatography/ mass spectrometry method for the evaluation of intestinal permeability.
Clin Biochem2008;41:887–92.
44. Faubion WACM, Murray JA, Kelly P, et al. Improving the detection of environmental enteric dysfunction: a lactulose, rhamnose assay of intestinal permeability in under-five children exposed to poor sanitation and hygiene.BMC Public Health2016;1:e000066.
45. Menard S, Lebreton C, Schumann M, et al. Paracellular versus trans-cellular intestinal permeability to gliadin peptides in active celiac disease.Am J Pathol2012;180:608–15.
46. Marshall JK, Thabane M, Garg AX, et al. Intestinal permeability in patients with irritable bowel syndrome after a waterborne outbreak of acute gastroenteritis in Walkerton, Ontario.Aliment Pharmacol Ther
2004;20:1317–22.
47. Blomquist L, Bark T, Hedenborg G, et al. Evaluation of the lactulose/ mannitol and 51Cr-ethylenediaminetetraacetic acid/14C-mannitol methods for intestinal permeability.Scand J Gastroenterol1997;32: 805–12.
48. Schmidt IM, Chellakooty M, Haavisto AM, et al. Gender difference in breast tissue size in infancy: correlation with serum estradiol.Pediatr Res2002;52:682–6.
49. Honda J, Iijima K, Asanuma K, et al. Estrogen enhances esophageal barrier function by potentiating occludin expression. Dig Dis Sci
2016;61:1028–38.
50. Beach RC, Menzies IS, Clayden GS, et al. Gastrointestinal permeability changes in the preterm neonate.Arch Dis Child1982;57:141–5.
51. Bezerra JA, Thompson SH, Morse M, et al. Intestinal permeability to intact lactose in newborns and adults.Biol Neonate1990;58:334–42.
52. Katz D, Hollander D, Said HM, et al. Aging-associated increase in intestinal permeability to polyethylene glycol 900. Dig Dis Sci
1987;32:285–8.
53. Man AL, Bertelli E, Rentini S, et al. Age-associated modifications of intestinal permeability and innate immunity in human small intestine.
Clin Sci2015;129:515–27.
54. Kevans D, Turpin W, Madsen K, et al. Determinants of intestinal permeability in healthy first-degree relatives of individuals with Crohn’s disease.Inflamm Bowel Dis2015;21:879–87.