R E G U L A R A R T I C L E
Open Access
SentiBench - a benchmark comparison of
state-of-the-practice sentiment analysis
methods
Filipe N Ribeiro
1,2*, Matheus Araújo
1, Pollyanna Gonçalves
1, Marcos André Gonçalves
1and
Fabrício Benevenuto
1*Correspondence:
1Computer Science Department,
Federal University of Minas Gerais, Belo Horizonte, Brazil
2Computer and Systems
Department, Federal University of Ouro Preto, Joao Monlevade, Brazil
Abstract
In the last few years thousands of scientific papers have investigated sentiment analysis, several startups that measure opinions on real data have emerged and a number of innovative products related to this theme have been developed. There are multiple methods for measuring sentiments, including lexical-based and supervised machine learning methods. Despite the vast interest on the theme and wide popularity of some methods, it is unclear which one is better for identifying the polarity (i.e., positive or negative) of a message. Accordingly, there is a strong need to conduct a thorough apple-to-apple comparison of sentiment analysis methods,as they are used in practice, across multiple datasets originated from different data sources. Such a comparison is key for understanding the potential limitations, advantages, and disadvantages of popular methods. This article aims at filling this gap by presenting a benchmark comparison of twenty-four popular sentiment analysis methods (which we call the state-of-the-practice methods). Our evaluation is based on a benchmark of eighteen labeled datasets, covering messages posted on social networks, movie and product reviews, as well as opinions and comments in news articles. Our results highlight the extent to which the prediction performance of these methods varies considerably across datasets. Aiming at boosting the development of this research area, we open the methods’ codes and datasets used in this article, deploying them in a benchmark system, which provides an open API for accessing and comparing sentence-level sentiment analysis methods.
Keywords: sentiment analysis; benchmark; methods evaluation
1 Introduction
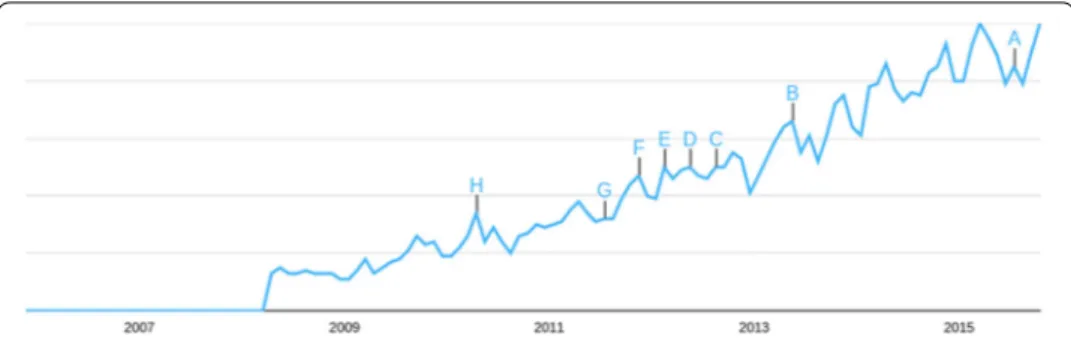
Sentiment analysis has become an extremely popular tool, applied in several analytical do-mains, especially on the Web and social media. To illustrate the growth of interest in the field, Figure shows the steady growth on the number of searches on the topic, accord-ing to Google Trends,amainly after the popularization of online social networks (OSNs). More than , articles have been written about sentiment analysis and various startups are developing tools and strategies to extract sentiments from text [].
The number of possible applications of such a technique is also considerable. Many of them are focused on monitoring the reputation or opinion of a company or a brand with
Figure 1 Searches on Google for the Query: ‘Sentiment Analysis’.This figure shows the steady growth on the number of searches on the topic, according to Google Trends, mainly after the popularization of online social networks (OSNs).
the analysis of reviews of consumer products or services []. Sentiment analysis can also provide analytical perspectives for financial investors who want to discover and respond to market opinions [, ]. Another important set of applications is in politics, where market-ing campaigns are interested in trackmarket-ing sentiments expressed by voters associated with candidates [].
Due to the enormous interest and applicability, there has been a corresponding increase in the number of proposed sentiment analysis methods in the last years. The proposed methods rely on many different techniques from different computer science fields. Some of them employ machine learning methods that often rely on supervised classification ap-proaches, requiring labeled data to train classifiers []. Others are lexical-based methods that make use of predefined lists of words, in which each word is associated with a specific sentiment. The lexical methods vary according to the context in which they were created. For instance, LIWC [] was originally proposed to analyze sentiment patterns in formally written English texts, whereas PANAS-t [] and POMS-ex [] were proposed as psycho-metric scales adapted to the Web context.
Overall, the above techniques are acceptable by the research community and it is com-mon to see concurrent important papers, sometimes published in the same computer science conference, using completely different methods. For example, the famous Face-book experiment [] which manipulated users feeds to study emotional contagion, used LIWC []. Concurrently, Reis et al. used SentiStrength [] to measure the negativeness or positiveness of online news headlines [, ], whereas Tamersoy [] explored VADER’s lexicon [] to study patterns of smoking and drinking abstinence in social media.
As the state-of-the-art has not been clearly established, researchers tend to accept any popular method as a valid methodology to measure sentiments. However, little is known about the relative performance of the several existing sentiment analysis methods. In fact, most of the newly proposed methods are rarely compared with all other pre-existing ones using a large number of existing datasets. This is a very unusual situation from a scientific perspective, in which benchmark comparisons are the rule. In fact, most applications and experiments reported in the literature make use of previously developed methods exactly how they were released with no changes and adaptations and with none or almost none parameter setting. In other words, the methods have been used as a black-box, without a deeper investigation on their suitability to a particular context or application.
advantages, disadvantages, and limitations in comparison with each another. Thus, there is a strong need to conduct a thorough apple-to-apple comparison of sentiment analysis methods,as they are used in practice, across multiple datasets originated from different data sources.
This state-of-the-practicesituation is what we propose to investigate in this article. We do this by providing a thorough benchmark comparison oftwenty-four state-of-the-practicemethods usingeighteenlabeled datasets. In particular, given the recent popularity of online social networks and of short texts on the Web, many methods are focused in de-tecting sentiments at the sentence-level, usually used to measure the sentiment of small sets of sentences in which the topic is known a priori. We focus on such context - thus, our datasets cover messages posted on social networks, movie and product reviews, and opinions and comments in news articles, TED talks, and blogs. We survey an extensive literature on sentiment analysis to identify existing sentence-level methods covering sev-eral different techniques. We contacted authors asking for their codes when available or we implemented existing methods when they were unavailable but could be reproduced based on their descriptions in the original published paper. We should emphasize that our work focus on off-the-shelf methods as they are used in practice. This excludes most of the supervised methods which require labeled sets for training, as these are usually not available for practitioners. Moreover, most of the supervised solutions do not share the source code or a trained model to be used with no supervision.
Our experimental results unveil a number of important findings. First, we show that there is no single method that always achieves the best prediction performance for all dif-ferent datasets, a result consistent with the ‘there is no free lunch theorem’ []. We also show that existing methods vary widely regarding their agreement, even across similar datasets. This suggests that the same content could be interpreted very differently depend-ing on the choice of a sentiment method. We noted that most methods are more accurate in correctly classifying positive than negative text, suggesting that current approaches tend to be biased in their analysis towards positivity. Finally, we quantify the relative prediction performance of existing efforts in the field across different types of datasets, identifying those with higher prediction performance across different datasets.
Based on these observations, our final contribution consists on releasing our gold stan-dard dataset and the codes of the compared methods.bWe also created a Web system
through which we allow other researchers to easily use our data and codes to compare re-sults with the existing methods.cMore importantly, by using our system one could easily
test which method would be the most suitable to a particular dataset and/or application. We hope that our tool will not only help researchers and practitioners for accessing and comparing a wide range of sentiment analysis techniques, but can also help towards the development of this research field as a whole.
The remainder of this paper is organized as follows. In Section , we briefly describe related efforts. Then, in Section we describe the sentiment analysis methods we compare. Section presents the gold standard data used for comparison. Section summarizes our results and findings. Finally, Section concludes the article and discusses directions for future work.
2 Background and related work
2.1 Focus on sentence-level sentiment analysis
Since sentiment analysis can be applied to different tasks, we restrict our focus on com-paring those efforts related to detect the polarity (i.e. positivity or negativity) of a given short text (i.e. sentence-level). Polarity detection is a common function across all sen-timent methods considered in our work, providing valuable information to a number of different applications, specially those that explore short messages that are commonly avail-able in social media [].
Sentence-level sentiment analysis can be performed with supervision (i.e. requiring la-beled training data) or not. An advantage of supervised methods is their ability to adapt and create trained models for specific purposes and contexts. A drawback is the need of labeled data, which might be highly costly, or even prohibitive, for some tasks. On the other hand, the lexical-based methods make use of a pre-defined list of words, where each word is associated with a specific sentiment. The lexical methods vary according to the context in which they were created. For instance, LIWC [] was originally proposed to analyze sentiment patterns in English texts, whereas PANAS-t [] and POMS-ex [] are psychometric scales adapted to the Web context. Although lexical-based methods do not rely on labeled data, it is hard to create a unique lexical-based dictionary to be used for all different contexts.
We focus our effort on evaluating unsupervised efforts as they can be easily deployed in Web services and applications without the need of human labeling or any other type of manual intervention. As described in Section , some of the methods we consider have used machine learning to build lexicon dictionaries or even to build models and tune specific parameters. We incorporate those methods in our study, since they have been released as black-box tools that can be used in an unsupervised manner.
2.2 Existing efforts on comparison of methods
Despite the large number of existing methods, only a limited number of them have per-formed a comparison among sentiment analysis methods, usually with restricted datasets. Overall, lexical methods and machine learning approaches have been evolving in parallel in the last years, and it comes as no surprise that studies have started to compare their per-formance on specific datasets and use one or another strategy as baseline for comparison. A recent survey summarizes several of these efforts [] and conclude that a systematic comparative study that implements and evaluates all relevant algorithms under the same framework is still missing in the literature. As new methods emerge and compare them-selves only against one, at most two other methods, using different evaluation datasets and experimental methodologies, it is hard to conclude if a single method triumphs over the remaining ones, or even in specific scenarios. To the best of our knowledge, our effort is the first of kind to create a benchmark that provides such thorough comparison.
data, such as tweets, and do not represent a wide range of social media data. In our evalua-tion effort, we consider one dataset from SemEval and two methods that participated in the competition in that same year.
Ahmadi et al. [] performed a comparison of Twitter-based sentiment analysis tools. They selected twenty tools and tested them across five Twitter datasets. This benchmark is the work that most approximate from ours, but it is different in some meaningful as-pects. Firstly, we embraced distinct contexts such as reviews, comments and social net-works aiming at providing a broader evaluation of the tools. Secondly, the methods they selected included supervised and unsupervised approaches which, in our view, could be unfair for the unsupervised ones. Although the results have been presented separately, the supervised methods, as mentioned by authors, required extensive parameter tuning and validation in a training environment. Therefore, supervised approaches tend to adapt to the context they were applied to. As previously highlighted, our focus is on off-the-shelf tools as they have been extensively and recently used. Many researchers and practitioners have also used supervised approaches but this is out of scope of our work. Finally, most of the unsupervised methods selected in the Twitter Benchmark are paid tools, except from two of them, both of which were developed as a result of published academic research. Oppositely we made an extensive bibliography review to include relevant academic out-comes without excluding the most used commercial options.
Finally, in a previous effort [], we compared eight sentence-level sentiment analysis methods, based on one public dataset used to evaluate SentiStrength []. This article largely extends our previous work by comparing a much larger set of methods across many different datasets, providing a much deeper benchmark evaluation of current popular sen-timent analysis methods. The methods used in this paper were also incorporated as part of an existing system, namely iFeel [].
3 Sentiment analysis methods
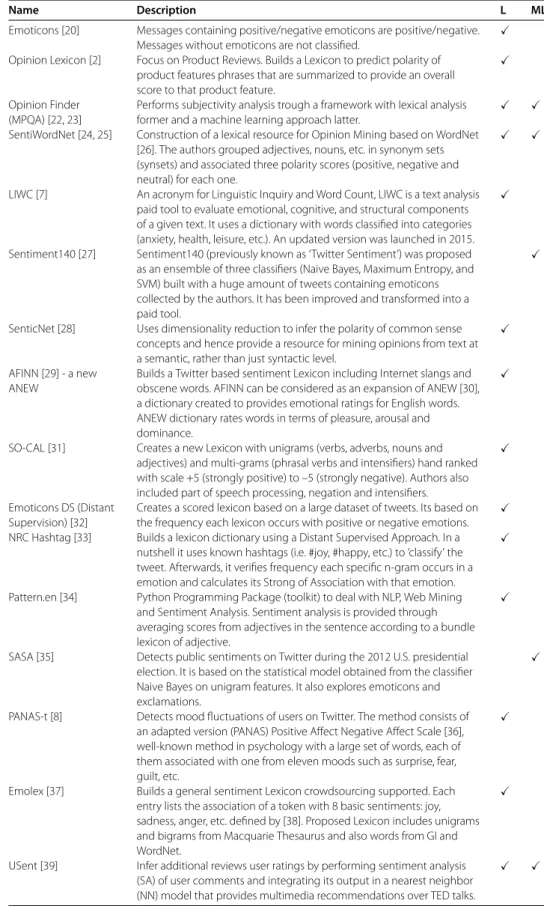
This section provides a brief description of the twenty-four sentence-level sentiment anal-ysis methods investigated in this article. Our effort to identify important sentence-level sentiment analysis methods consisted of systematically search for them in the main con-ferences in the field and then checking for papers that cited them as well as their own ref-erences. Some of the methods are available for download on the Web; others were kindly shared by their authors under request; and a small part of them were implemented by us based on their descriptions in the original paper. This usually happened when authors shared only the lexical dictionaries they created, letting the implementation of the method that use the lexical resource to ourselves.
Table 1 Overview of the sentence-level methods available in the literature
Name Description L ML
Emoticons [20] Messages containing positive/negative emoticons are positive/negative. Messages without emoticons are not classified.
Opinion Lexicon [2] Focus on Product Reviews. Builds a Lexicon to predict polarity of product features phrases that are summarized to provide an overall score to that product feature.
Opinion Finder (MPQA) [22, 23]
Performs subjectivity analysis trough a framework with lexical analysis former and a machine learning approach latter.
SentiWordNet [24, 25] Construction of a lexical resource for Opinion Mining based on WordNet [26]. The authors grouped adjectives, nouns, etc. in synonym sets (synsets) and associated three polarity scores (positive, negative and neutral) for each one.
LIWC [7] An acronym for Linguistic Inquiry and Word Count, LIWC is a text analysis paid tool to evaluate emotional, cognitive, and structural components of a given text. It uses a dictionary with words classified into categories (anxiety, health, leisure, etc.). An updated version was launched in 2015.
Sentiment140 [27] Sentiment140 (previously known as ‘Twitter Sentiment’) was proposed as an ensemble of three classifiers (Naive Bayes, Maximum Entropy, and SVM) built with a huge amount of tweets containing emoticons collected by the authors. It has been improved and transformed into a paid tool.
SenticNet [28] Uses dimensionality reduction to infer the polarity of common sense concepts and hence provide a resource for mining opinions from text at a semantic, rather than just syntactic level.
AFINN [29] - a new ANEW
Builds a Twitter based sentiment Lexicon including Internet slangs and obscene words. AFINN can be considered as an expansion of ANEW [30], a dictionary created to provides emotional ratings for English words. ANEW dictionary rates words in terms of pleasure, arousal and dominance.
SO-CAL [31] Creates a new Lexicon with unigrams (verbs, adverbs, nouns and adjectives) and multi-grams (phrasal verbs and intensifiers) hand ranked with scale +5 (strongly positive) to –5 (strongly negative). Authors also included part of speech processing, negation and intensifiers.
Emoticons DS (Distant Supervision) [32]
Creates a scored lexicon based on a large dataset of tweets. Its based on the frequency each lexicon occurs with positive or negative emotions.
NRC Hashtag [33] Builds a lexicon dictionary using a Distant Supervised Approach. In a nutshell it uses known hashtags (i.e. #joy, #happy, etc.) to ‘classify’ the tweet. Afterwards, it verifies frequency each specific n-gram occurs in a emotion and calculates its Strong of Association with that emotion.
Pattern.en [34] Python Programming Package (toolkit) to deal with NLP, Web Mining and Sentiment Analysis. Sentiment analysis is provided through averaging scores from adjectives in the sentence according to a bundle lexicon of adjective.
SASA [35] Detects public sentiments on Twitter during the 2012 U.S. presidential election. It is based on the statistical model obtained from the classifier Naive Bayes on unigram features. It also explores emoticons and exclamations.
PANAS-t [8] Detects mood fluctuations of users on Twitter. The method consists of an adapted version (PANAS) Positive Affect Negative Affect Scale [36], well-known method in psychology with a large set of words, each of them associated with one from eleven moods such as surprise, fear, guilt, etc.
Emolex [37] Builds a general sentiment Lexicon crowdsourcing supported. Each entry lists the association of a token with 8 basic sentiments: joy, sadness, anger, etc. defined by [38]. Proposed Lexicon includes unigrams and bigrams from Macquarie Thesaurus and also words from GI and WordNet.
USent [39] Infer additional reviews user ratings by performing sentiment analysis (SA) of user comments and integrating its output in a nearest neighbor (NN) model that provides multimedia recommendations over TED talks.
Table 1 (Continued)
Name Description L ML
Sentiment140 Lexicon [40]
A lexicon dictionary based on the same dataset used to train the Sentiment140 Method. The lexicon was built in a similar way to [33] but authors used the occurrence of emoticons to classify the tweet as positive or negative. Then, the n-gram score was calculated based on the frequency of occurrence in each class of tweets.
SentiStrength [11] Builds a lexicon dictionary annotated by humans and improved with the use of Machine Learning.
Stanford Recursive Deep Model [41]
Proposes a model called Recursive Neural Tensor Network (RNTN) that processes all sentences dealing with their structures and compute the interactions between them. This approach is interesting since RNTN take into account the order of words in a sentence, which is ignored in most of methods.
Umigon [18] Disambiguates tweets using lexicon with heuristics to detect negations plus elongated words and hashtags evaluation.
ANEW_SUB [42] Another extension of the ANEW dictionary [30] including the most common words from the SubtlexUS corpus [43]. SubtlexUS was an effort to propose a different manner to calculate word frequencies
considering film and TV subtitles.
VADER [15] It is a human-validated sentiment analysis method developed for Twitter and social media contexts. VADER was created from a generalizable, valence-based, human-curated gold standard sentiment lexicon.
Semantria [44] It is a paid tool that employs multi-level analysis of sentences. Basically it has four levels: part of speech, assignment of previous scores from dictionaries, application of intensifiers and finally machine learning techniques to delivery a final weight to the sentence.
the latest version, from , respectively. We considered both versions because the first one was extensively used in the literature. This also allows to compare the improvements between both versions.
3.1 Adapting lexicons for the sentence level task
Since we are comparing sentiment analysis methods on a sentence-level basis, we need to work with mechanisms that are able to receive sentences as input and produce polarities as output. Some of the approaches considered in this paper, shown in Table , are complex dictionaries built with great effort. However, a lexicon alone has no natural ability to infer polarity in sentence level tasks. The purpose of a lexicon goes beyond the detection of polarity of a sentence [, ], but it can also be used with that purpose [, ].
Several existing sentence-level sentiment analysis methods, like VADER [] and SO-CAL [], combine a lexicon and the processing of the sentence characteristics to deter-mine a sentence polarity. These approaches make use of a series of intensifiers, punctua-tion transformapunctua-tion, emoticons, and many other heuristics.
Thus, to evaluate each lexicon dictionaries as the basis for a sentence-level sentiment analysis method, we considered the VADER’s implementation. In other words, we used VADER’s code for determining if a sentence is positive or not considering different lexi-cons. The reasons for choosing VADER are twofold: (i) the fact it is an open source tool, allowing easy replication of the procedures we performed in our study; and (ii) VADER’s expressive results observed in previous experiments.
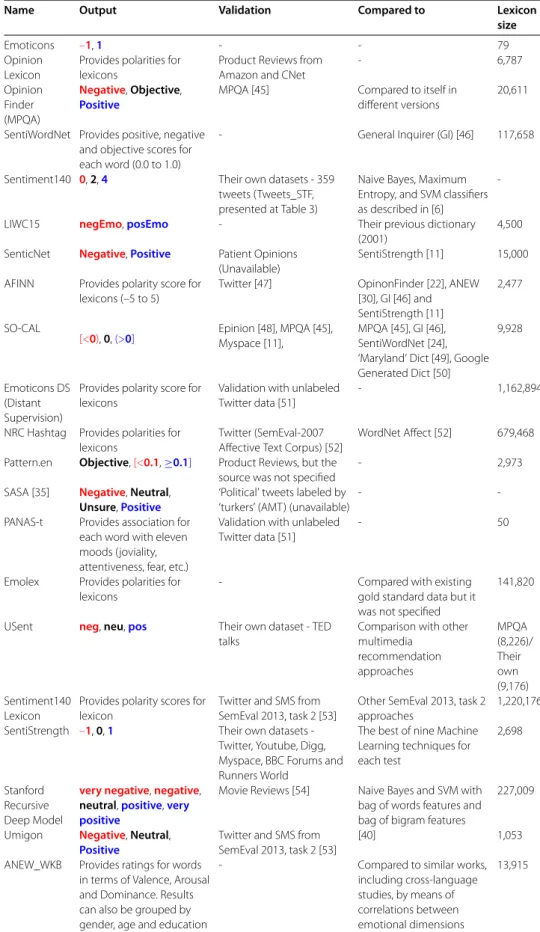
Table 2 Overview of the sentence-level methods available in the literature
Name Output Validation Compared to Lexicon
size
Emoticons –1,1 - - 79
Opinion Lexicon
Provides polarities for lexicons
Product Reviews from Amazon and CNet
- 6,787
Opinion Finder (MPQA)
Negative,Objective,
Positive
MPQA [45] Compared to itself in different versions
20,611
SentiWordNet Provides positive, negative and objective scores for each word (0.0 to 1.0)
- General Inquirer (GI) [46] 117,658
Sentiment140 0,2,4 Their own datasets - 359 tweets (Tweets_STF, presented at Table 3)
Naive Bayes, Maximum Entropy, and SVM classifiers as described in [6]
-LIWC15 negEmo,posEmo - Their previous dictionary (2001)
4,500
SenticNet Negative,Positive Patient Opinions (Unavailable)
SentiStrength [11] 15,000
AFINN Provides polarity score for lexicons (–5 to 5)
Twitter [47] OpinonFinder [22], ANEW [30], GI [46] and SentiStrength [11]
2,477
SO-CAL
[<0),0,(>0] Epinion [48], MPQA [45],Myspace [11], MPQA [45], GI [46],SentiWordNet [24], ‘Maryland’ Dict [49], Google Generated Dict [50]
9,928
Emoticons DS (Distant Supervision)
Provides polarity score for lexicons
Validation with unlabeled Twitter data [51]
- 1,162,894
NRC Hashtag Provides polarities for lexicons
Twitter (SemEval-2007 Affective Text Corpus) [52]
WordNet Affect [52] 679,468
Pattern.en Objective,[<0.1,≥0.1] Product Reviews, but the source was not specified
- 2,973
SASA [35] Negative,Neutral,
Unsure,Positive
‘Political’ tweets labeled by ‘turkers’ (AMT) (unavailable)
-
-PANAS-t Provides association for each word with eleven moods (joviality, attentiveness, fear, etc.)
Validation with unlabeled Twitter data [51]
- 50
Emolex Provides polarities for lexicons
- Compared with existing
gold standard data but it was not specified
141,820
USent neg,neu,pos Their own dataset - TED talks
Comparison with other multimedia recommendation approaches MPQA (8,226)/ Their own (9,176) Sentiment140 Lexicon
Provides polarity scores for lexicon
Twitter and SMS from SemEval 2013, task 2 [53]
Other SemEval 2013, task 2 approaches
1,220,176
SentiStrength –1,0,1 Their own datasets -Twitter, Youtube, Digg, Myspace, BBC Forums and Runners World
The best of nine Machine Learning techniques for each test
2,698
Stanford Recursive Deep Model
very negative,negative,
neutral,positive,very positive
Movie Reviews [54] Naive Bayes and SVM with bag of words features and bag of bigram features
227,009
Umigon Negative,Neutral,
Positive
Twitter and SMS from SemEval 2013, task 2 [53]
[40] 1,053
ANEW_WKB Provides ratings for words in terms of Valence, Arousal and Dominance. Results can also be grouped by gender, age and education
- Compared to similar works, including cross-language studies, by means of correlations between emotional dimensions
Table 2 (Continued)
Name Output Validation Compared to Lexicon
size
VADER [< –.), (–.,. . .,.), (>.]
Their own datasets -Twitter, Movie Reviews, Technical Product Reviews, NYT User’s Opinions
GI [46], LIWC, [7], SentiWordNet [24], ANEW [30], SenticNet [55] and some Machine Learning approaches
7,517
LIWC15 negEmo,posEmo - Their previous dictionary (2007)
6,400
Semantria negative,neutral,
positive
Not available Not available Not available
treatments for: () punctuation (e.g. number of ‘!’s); () capitalization (e.g. ‘I HATE YOU’ is more intense than ‘i hate you’); () degree modifiers (e.g. ‘The service here is extremely good’ is more intense than ‘The service here is good’); () constructive conjunction ‘but’ to shift the polarity; () tri-gram examination to identify negation (e.g. ‘The food here isn’t really all that great’). We choose VADER as a basis for such heuristics as it is one of the most recent methods among those we considered. Moreover, it is becoming widely used, being even implemented as part of the well-known NLTK python library.d
We applied such heuristics to the following lexicons: ANEW_SUB, AFINN, Emolex, EmoticonsDS, NRC Hashtag, Opinion Lexicon, PANAS-t, Sentiment Lexicon and SentiWordNet. We notice that those strategies drastically improved most of the results of the lexicons for sentence-level sentiment analysis in comparison with a simple base-line approach that averages the occurrence of positive and negative words to classify the polarity of a sentence. The results for the simplest usage of the above lexicons as plain methods are available in the last four tables in Additional file of the electronic version of the manuscript. LIWC dictionary was not included in these adaptations due to its very restrictive license, which does not allow any derivative work based on the original appli-cation and lexicon. Table has also a column (Lexicon size) that describes the number of terms contained in the proposed dictionary.
3.2 Output adaptations
It is worth noticing that the output of each method varies drastically depending on the goal it was developed for and the approach it employs. PANAS-t, for instance, associates each word with eleven moods as described in Table and it was designed to track any increase or decrease in sentiments over time. Emolex lexicon provides the association of each word with eight sentiments. The word ‘unhappy’ for example is related to anger, disgust, and sadness and it is not related to joy, surprise, etc. SentiWordNet links each word with a synset (i.e. a set of synonyms) characterized by a positive and a negative score, both of them represented with a value between and .
from negative value defined to that word. For example, the positive value for the word faithful is . while its negative score is .. Then the overall score is .. Finally, for ANEW_SUB we employed only the valence emotion of each word. This metric ranges from to and indicates the level of pleasantness of a specific word - we considered the values one to four as negative, five as neutral, and six to nine as positive.
Other lexicons included in our evaluation already provide positive and negative scores such as SentiWordNet or an overall score ranging from a negative to a positive value. After applying VADER’s heuristics for each one of these lexicons we get scores in the same way VADER’s output (see Table ).
Other methods also required some output handling. The available implementation of OpinionFinder,efor instance, generates polarity outputs (–, , or ) for each sentiment
clue found in a sentence so that a single sentence can have more than one clue. We con-sidered the polarity of a single sentence as the sum of the polarities of all the clues.
The outputs from the remaining methods were easily adapted and converted to pos-itive, negative or neutral. SO-CAL and Pattern.en delivery float numbers greater than a threshold, indicating positive, and lesser than the threshold, indicating negative. LIWC, SenticNet, SASA, USent, SentiStrength, Umigon, VADER and Semantria already provide fixed outputs indicating one of three desired classes while Stanford Recursive Deep Model yields very negative and very positive which in our experiments are handled as negative and positive, respectively.
3.3 Paid softwares
Seven out of the twenty-four methods evaluated in this work are closed paid softwares: LIWC ( and ), Semantria, SenticNet ., Sentiment and SentiStrength. Al-though SentiStrength is paid, it has a free of charge academic license. SenticNet’s authors kindly processed all datasets with the commercial version and return the polarities for us. For SentiStrength we used the Java version from May in a package with all features of the commercial version. For LIWC we acquired the licenses from (LIWC) and (LIWC) versions. Finally, for Semantria and Sentiment we used a trial account free of charge for a limited number of sentences, which was sufficient to run our experi-ments.
3.4 Methods not included
3.5 Datasets and comparison among methods
From Table we can note that the validation strategy, the datasets used, and the compar-ison with baselines performed by these methods vary greatly, from toy examples to large labeled datasets. PANAS-t and Emoticons DS used manually unlabeled Twitter data to validate their methods, by presenting evaluations of events in which some bias towards positivity and negativity would be expected. PANAS-t is tested with unlabeled Twitter data related to Michael Jackson’s death and the release of a Harry Potter movie whereas Emoticons DS verified the influence of weather and time on the aggregate sentiment from Twitter. Lexical dictionaries were validated in very different ways. AFINN [] compared its Lexicon with other dictionaries. Emoticon Distance Supervised [] used Pearson Cor-relation between human labeling and the predicted value. SentiWordNet [] validates the proposed dictionary with comparisons with other dictionaries, but it also used human validation of the proposed lexicon. These efforts attempt to validate the created lexicon, without comparing the lexicon as a sentiment analysis method by itself. VADER [] com-pared results with lexical approaches considering labeled datasets from different social media data. SenticNet [] was compared with SentiStrength [] with a specific dataset related to patient opinions, which could not be made available. Stanford Recursive Deep Model [] and SentiStrength [] were both compared with standard machine learning approaches, with their own datasets.
This scenario, where every new developed solution compares itself with different solu-tions using different datasets, happens because there is no standard benchmark for eval-uating new methods. This problem is exacerbated because many methods have been pro-posed in different research communities (e.g. NLP, Information Science, Information Re-trieval, Machine Learning), exploiting different techniques, with low knowledge about re-lated efforts in other communities. Next, we describe how we created a large gold standard to properly compare all the considered sentiment analysis methods.
4 Gold standard data
A key aspect in evaluating sentiment analysis methods consists of using accurate gold standard labeled datasets. Several existing efforts have generated labeled data produced by experts or non-experts evaluators. Previous studies suggest that both efforts are valid as non-expert labeling may be as effective as annotations produced by experts for affect recognition, a very related task []. Thus, our effort to build a large and representative gold standard dataset consists of obtaining labeled data from trustful previous efforts that cover a wide range of sources and kinds of data. We also attempt to assess the ‘quality’ of our gold standard in terms of the accuracy of the labeling process.
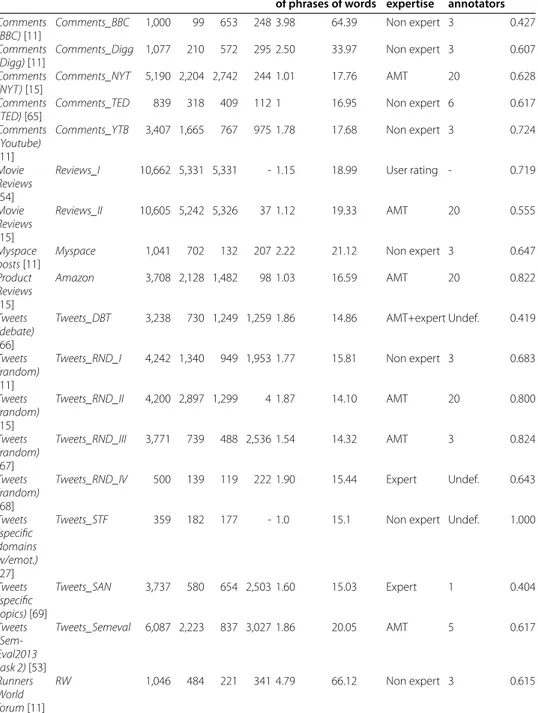
Table summarizes the main characteristics of the eighteen exploited datasets, such as number of messages and the average number of words per message in each dataset. It also defines a simpler nomenclature that is used in the remainder of this paper. The table also presents the methodology employed in the classification. Human labeling was implemented in almost all datasets, usually done with the use of non-expert reviewers. Reviews_I dataset relies on five stars rates, in which users rate and provide a comment about an entity of interest (e.g. a movie or an establishment).
Table 3 Labeled datasets
Dataset Nomenclature # Msgs # Pos # Neg # Neu Average # of phrases Average # of words Annotators expertise # of annotators CK Comments (BBC)[11]
Comments_BBC 1,000 99 653 248 3.98 64.39 Non expert 3 0.427
Comments (Digg)[11]
Comments_Digg 1,077 210 572 295 2.50 33.97 Non expert 3 0.607
Comments (NYT)[15]
Comments_NYT 5,190 2,204 2,742 244 1.01 17.76 AMT 20 0.628
Comments (TED)[65]
Comments_TED 839 318 409 112 1 16.95 Non expert 6 0.617
Comments (Youtube) [11]
Comments_YTB 3,407 1,665 767 975 1.78 17.68 Non expert 3 0.724
Movie Reviews [54]
Reviews_I 10,662 5,331 5,331 - 1.15 18.99 User rating - 0.719
Movie Reviews [15]
Reviews_II 10,605 5,242 5,326 37 1.12 19.33 AMT 20 0.555
Myspace posts[11]
Myspace 1,041 702 132 207 2.22 21.12 Non expert 3 0.647
Product Reviews [15]
Amazon 3,708 2,128 1,482 98 1.03 16.59 AMT 20 0.822
Tweets (debate) [66]
Tweets_DBT 3,238 730 1,249 1,259 1.86 14.86 AMT+expert Undef. 0.419
Tweets (random) [11]
Tweets_RND_I 4,242 1,340 949 1,953 1.77 15.81 Non expert 3 0.683
Tweets (random) [15]
Tweets_RND_II 4,200 2,897 1,299 4 1.87 14.10 AMT 20 0.800
Tweets (random) [67]
Tweets_RND_III 3,771 739 488 2,536 1.54 14.32 AMT 3 0.824
Tweets (random) [68]
Tweets_RND_IV 500 139 119 222 1.90 15.44 Expert Undef. 0.643
Tweets (specific domains w/emot.) [27]
Tweets_STF 359 182 177 - 1.0 15.1 Non expert Undef. 1.000
Tweets (specific topics)[69]
Tweets_SAN 3,737 580 654 2,503 1.60 15.03 Expert 1 0.404
Tweets (Sem-Eval2013 task 2)[53]
Tweets_Semeval 6,087 2,223 837 3,027 1.86 20.05 AMT 5 0.617
Runners World forum[11]
RW 1,046 484 221 341 4.79 66.12 Non expert 3 0.615
were used in ten datasets. Usually, an agreement strategy (i.e. majority voting) is applied to ensure that, in the end, each sentence has an agreed-upon polarity assigned to it. The number of annotators used to build the datasets is also shown in Table .
as they were deleted. We plan to release all gold standard datasets in a request basis, which is in agreement with Twitter policies.
In order to assess the extent to which these datasets are trustful, we used a strategy similar to the one used by Tweets_DBT. Our goal was not to redo all the performed human evaluation, but simply inspecting a small sample of them to infer the level of agreement with our own evaluation. We randomly select % of all sentences to be evaluated by experts (two of the authors) as an attempt to assess if these gold standard data are really trustful. It is important to mention that we did not have access to the instructions provided by the authors. We also could not get access to small amount of the raw data in a few datasets, which was discarded. Finally, our manual inspection unveiled a few sentences in idioms other than English in a few datasets, such as Tweets_STA and TED, which were obviously discarded.
Column CK from Table exhibits the level of agreement of each dataset in our evalu-ation by means of Cohen’s Kappa, an extensively used metric to calculate inter-anotator agreement. After a close look in the cases of disagreement with the evaluations in the Gold standard, we realized that other interpretations could be possible for the given text, find-ing cases of sentences with mixed polarity. Some of them are strongly linked to original context and are very hard to evaluate. Some NYT comments, for instance, are directly re-lated to the news they were inserted to. We can also note that some of the datasets do not contain neutral messages. This might be a characteristic of the data or even a result of how annotators were instructed to label their pieces of text. Most of the cases of disagreement involve neutral messages. Thus, we considered these cases, as well as the amount of dis-agreement we had with the gold standard data, reasonable and expected, specially when taking into account that Landis and Koch [] suggest that Kappa values between . and . indicate moderate agreement and values amid . and . correspond to substantial agreements.
5 Comparison results
Next, we present comparison results for the twenty-four methods considered in this paper based on the eighteen considered gold standard datasets.
5.1 Experimental details
At least three distinct approaches have been proposed to deal with sentiment analysis of sentences. The first of them, applied by OpinionFinder and Pattern.en, for instance, splits this task into two steps: (i) identifying sentences with no sentiment, also named as objec-tive vs. neutral sentences and then (ii) detecting the polarity (posiobjec-tive or negaobjec-tive), only for the subjective sentences. Another common way to detect sentence polarity considers three distinct classes (positive, negative and neutral) in a single task, an approach used by VADER, SO-CAL, USent and others. Finally, some methods like SenticNet and LIWC, classify a sentence as positive or negative only, assuming that only polarized sentences are presented, given the context of a given application. As an example, reviews of products are expected to contain only polarized opinion.
needs to be executed firstly. In the -class experiments we used only datasets containing a considerable number of neutral messages (which excludes Tweets_RND_II, Amazon, and Reviews_II). Despite being -class methods, as highlighted in Table , we decided to include LIWC, Emoticons and SenticNet in the -class experiments to present a full set of comparative experiments. LIWC, Emoticons, and SenticNet cannot define, for some sentences, their positive or negative polarity, considering it as undefined. It occurs due to the absence in the sentence of emoticons (in the case of Emoticons method) or of words belonging to the methods’ sentiment lexicon. As neutral (objective) sentences do not con-tain sentiments, we assumed, in the case of these -class methods, that sentences with undefined polarities are equivalent to neutral sentences.
The -class experiments, on the other hand, were performed with all datasets described in Table excluding the neutral sentences. We also included all methods in these experi-ments, even those that produce neutral outputs. As discussed before, when -class meth-ods cannot detect the polarity (positive or negative) of a sentences they usually assign it to an undefined polarity. As we know all sentences in the -class experiments are posi-tive or negaposi-tive, we create the coverage metric to determine the percentage of sentences a method can in fact classify as positive or negative. For instance, suppose that Emoticons’ method can classify only % of the sentences in a dataset, corresponding to the actual percentage of sentences with emoticons. It means that the coverage of this method in this specific dataset is %. Note that, the coverage is quite an important metric for a more complete evaluation in the -class experiments. Even though Emoticons presents high accuracy for the classified phrases, it was not able to make a prediction for % of the sentences. More formally, coverage is calculated as the number of total sentences minus the number of undefined sentences, all of this divided by the total of sentences, where the number of undefined sentences includes neutral outputs for -class methods.
Coverage=#Sentences–#Undefined
#Sentences .
5.2 Comparison metrics
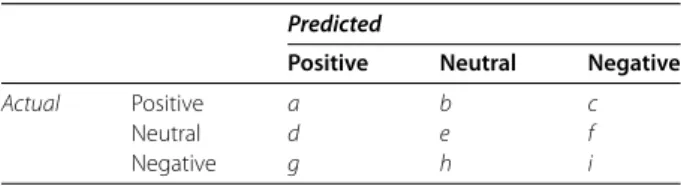
Considering the -class comparison experiments, we used the traditional Precision, Re-call, andF measures for the automated classification.
Each letter in Table represents the number of instances which are actually in class
Xand predicted as classY, whereX;Y∈ {positive; neutral; negative}. The recall (R) of a classXis the ratio of the number of elements correctly classified asXto the number of known elements in classX. Precision (P) of a classXis the ratio of the number of elements classified correctly asXto the total predicted as the classX. For example, the precision of the negative class is computed as:P(neg) =i/(c+f +i); its recall, as:R(neg) =i/(g+h+i); and theF measure is the harmonic mean between both precision and recall. In this case,
F(neg) =PP(neg(neg)+)·RR((negneg)).
Table 4 Confusion matrix for experiments with three classes
Predicted
Positive Neutral Negative
Actual Positive a b c
Neutral d e f
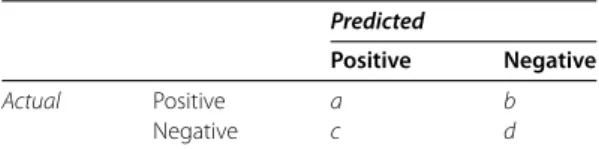
Table 5 Confusion matrix for experiments with two classes
Predicted
Positive Negative
Actual Positive a b
Negative c d
We also compute the overall accuracy as:A=a+b+c+ad++ee++if+g+h+i. It considers equally im-portant the correct classification of each sentence, independently of the class, and basi-cally measures the capability of the method to predict the correct output. A variation ofF, namely, Macro-F, is normally reported to evaluate classification effectiveness on skewed datasets. Macro-F values are computed by first calculatingF values for each class in isolation, as exemplified above for negative, and then averaging over all classes. Macro-F considers equally important the effectiveness ineach class, independently of the relative size of the class. Thus, accuracy and Macro-F provide complementary assessments of the classification effectiveness. Macro-F is especially important when the class distribu-tion is very skewed, to verify the capability of the method to perform well in the smaller classes.
The described metrics can be easily computed for the -class experiments by just re-moving neutral columns and rows as in Table .
In this case, the precision of positive class is computed as:P(pos) =a/(a+c); its recall as:R(pos) =a/(a+b); while itsF isF(pos) =PP(pos(pos)+)·RR((pospos)).
As we have a large number of combinations among the base methods, metrics and datasets, a global analysis of the performance of all these combinations is not an easy task. We propose a simple but informative measure to assess the overall performance ranking. The Mean Ranking is basically the sum of ranks obtained by a method in each dataset divided by the total number of datasets, as below:
MR=
nd j=ri
nd
wherend is the number of datasets andriis the rank of the method for dataseti. It is important to notice that the rank was calculated based on Macro-F.
The last evaluation metric we exploit is the Friedman’s Test []. It allows one to ver-ify whether, in a specific experiment, the observed values are globally similar. We used this test to tell if the methods present similar performance across different datasets. More specifically, suppose thatkexpert raters evaluatednitem - the question that arises is: are rates provided by judges consistent with each other or do they follow completely different patterns? The application in our context is very similar: the datasets are the judges and the Macro-F achieved by a method is the rating from the judges.
The Friedman’s Test is applied to rankings. Then, to proceed with this statistical test, we sort the methods in decreasing order of Macro-F for each dataset. More formally, the Friedman’s rank test in our experiment is defined as:
FR=
rc(c+ )
c
j=
Rj
where
Rj = square of the sum of rank positions of methodj (j= , , . . . ,c),
r= number of datasets,
c= number of methods.
As the number of datasets increases, the statistical test can be approximated by using the chi-square distribution withc– degrees of freedom []. Then, if theFRcomputed
value is larger than the critical value for the chi-square distribution the null hypothesis is rejected. This null hypothesis states that ranks obtained per dataset are globally simi-lar. Accordingly, rejecting the null hypothesis means that there are significant differences in the ranks across datasets. It is important to note that, in general, the critical value is obtained with significance levelα= .. Synthesizing, the null hypothesis should be
re-jected ifFR>Xα, whereX
αis the critical value verified in the chi-square distribution table
withc– degrees of freedom andαequals ..
5.3 Comparing prediction performance
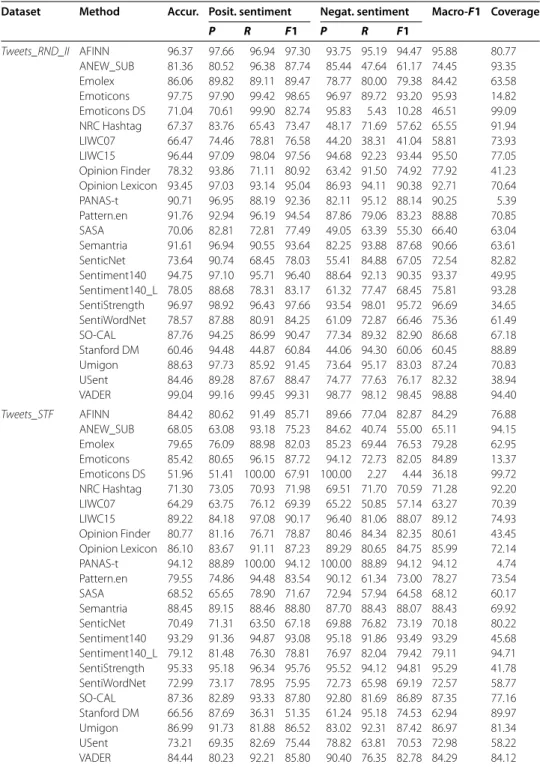
We start the analysis of our experiments by comparing the results of all previously dis-cussed metrics for all datasets. Table and Table present accuracy, precision, and
Macro-F for all methods considering four datasets for the -class and -class experiments, re-spectively. For simplicity, we choose to discuss results only for these datasets as they come from different sources and help us to illustrate the main findings from our analysis. Re-sults for all the other datasets are presented in Additional file . There are many interesting observations we can make from these results, summarized next.
Table 6 2-classes experiments results with 4 datasets
Dataset Method Accur. Posit. sentiment Negat. sentiment Macro-F1 Coverage
P R F1 P R F1
Tweets_RND_II AFINN 96.37 97.66 96.94 97.30 93.75 95.19 94.47 95.88 80.77 ANEW_SUB 81.36 80.52 96.38 87.74 85.44 47.64 61.17 74.45 93.35 Emolex 86.06 89.82 89.11 89.47 78.77 80.00 79.38 84.42 63.58 Emoticons 97.75 97.90 99.42 98.65 96.97 89.72 93.20 95.93 14.82 Emoticons DS 71.04 70.61 99.90 82.74 95.83 5.43 10.28 46.51 99.09 NRC Hashtag 67.37 83.76 65.43 73.47 48.17 71.69 57.62 65.55 91.94 LIWC07 66.47 74.46 78.81 76.58 44.20 38.31 41.04 58.81 73.93 LIWC15 96.44 97.09 98.04 97.56 94.68 92.23 93.44 95.50 77.05 Opinion Finder 78.32 93.86 71.11 80.92 63.42 91.50 74.92 77.92 41.23 Opinion Lexicon 93.45 97.03 93.14 95.04 86.93 94.11 90.38 92.71 70.64 PANAS-t 90.71 96.95 88.19 92.36 82.11 95.12 88.14 90.25 5.39 Pattern.en 91.76 92.94 96.19 94.54 87.86 79.06 83.23 88.88 70.85 SASA 70.06 82.81 72.81 77.49 49.05 63.39 55.30 66.40 63.04 Semantria 91.61 96.94 90.55 93.64 82.25 93.88 87.68 90.66 63.61 SenticNet 73.64 90.74 68.45 78.03 55.41 84.88 67.05 72.54 82.82 Sentiment140 94.75 97.10 95.71 96.40 88.64 92.13 90.35 93.37 49.95 Sentiment140_L 78.05 88.68 78.31 83.17 61.32 77.47 68.45 75.81 93.28 SentiStrength 96.97 98.92 96.43 97.66 93.54 98.01 95.72 96.69 34.65 SentiWordNet 78.57 87.88 80.91 84.25 61.09 72.87 66.46 75.36 61.49 SO-CAL 87.76 94.25 86.99 90.47 77.34 89.32 82.90 86.68 67.18 Stanford DM 60.46 94.48 44.87 60.84 44.06 94.30 60.06 60.45 88.89 Umigon 88.63 97.73 85.92 91.45 73.64 95.17 83.03 87.24 70.83 USent 84.46 89.28 87.67 88.47 74.77 77.63 76.17 82.32 38.94 VADER 99.04 99.16 99.45 99.31 98.77 98.12 98.45 98.88 94.40 Tweets_STF AFINN 84.42 80.62 91.49 85.71 89.66 77.04 82.87 84.29 76.88 ANEW_SUB 68.05 63.08 93.18 75.23 84.62 40.74 55.00 65.11 94.15 Emolex 79.65 76.09 88.98 82.03 85.23 69.44 76.53 79.28 62.95 Emoticons 85.42 80.65 96.15 87.72 94.12 72.73 82.05 84.89 13.37 Emoticons DS 51.96 51.41 100.00 67.91 100.00 2.27 4.44 36.18 99.72 NRC Hashtag 71.30 73.05 70.93 71.98 69.51 71.70 70.59 71.28 92.20 LIWC07 64.29 63.75 76.12 69.39 65.22 50.85 57.14 63.27 70.39 LIWC15 89.22 84.18 97.08 90.17 96.40 81.06 88.07 89.12 74.93 Opinion Finder 80.77 81.16 76.71 78.87 80.46 84.34 82.35 80.61 43.45 Opinion Lexicon 86.10 83.67 91.11 87.23 89.29 80.65 84.75 85.99 72.14 PANAS-t 94.12 88.89 100.00 94.12 100.00 88.89 94.12 94.12 4.74 Pattern.en 79.55 74.86 94.48 83.54 90.12 61.34 73.00 78.27 73.54 SASA 68.52 65.65 78.90 71.67 72.94 57.94 64.58 68.12 60.17 Semantria 88.45 89.15 88.46 88.80 87.70 88.43 88.07 88.43 69.92 SenticNet 70.49 71.31 63.50 67.18 69.88 76.82 73.19 70.18 80.22 Sentiment140 93.29 91.36 94.87 93.08 95.18 91.86 93.49 93.29 45.68 Sentiment140_L 79.12 81.48 76.30 78.81 76.97 82.04 79.42 79.11 94.71 SentiStrength 95.33 95.18 96.34 95.76 95.52 94.12 94.81 95.29 41.78 SentiWordNet 72.99 73.17 78.95 75.95 72.73 65.98 69.19 72.57 58.77 SO-CAL 87.36 82.89 93.33 87.80 92.80 81.69 86.89 87.35 77.16 Stanford DM 66.56 87.69 36.31 51.35 61.24 95.18 74.53 62.94 89.97 Umigon 86.99 91.73 81.88 86.52 83.02 92.31 87.42 86.97 81.34 USent 73.21 69.35 82.69 75.44 78.82 63.81 70.53 72.98 58.22 VADER 84.44 80.23 92.21 85.80 90.40 76.35 82.78 84.29 84.12
Table 6 (Continued)
Dataset Method Accur. Posit. sentiment Negat. sentiment Macro-F1 Coverage
P R F1 P R F1
Comments_Digg AFINN 70.94 47.01 81.82 59.72 91.17 67.05 77.27 68.49 74.81 ANEW_SUB 43.25 30.98 92.31 46.39 90.13 25.46 39.71 43.05 93.73 Emolex 61.71 34.60 75.83 47.52 88.93 57.53 69.87 58.69 67.14 Emoticons 73.08 72.22 86.67 78.79 75.00 54.55 63.16 70.97 3.32 Emoticons DS 28.24 27.30 100.00 42.89 100.00 1.77 3.48 23.19 98.72 NRC Hashtag 74.69 51.01 40.64 45.24 80.80 86.48 83.54 64.39 92.97 LIWC07 46.15 27.44 58.40 37.34 72.49 41.52 52.79 45.07 58.18 LIWC15 70.67 49.81 90.91 64.36 94.35 62.36 75.09 69.72 62.79 Opinion Finder 71.14 43.04 64.76 51.71 86.88 73.13 79.42 65.56 56.27 Opinion Lexicon 71.82 47.45 86.43 61.27 93.40 66.75 77.86 69.56 69.44 PANAS-t 68.00 12.50 50.00 20.00 94.12 69.57 80.00 50.00 3.20 Pattern.en 60.05 43.73 92.14 59.31 92.57 45.21 60.75 60.03 56.65 SASA 65.54 40.26 66.91 50.27 84.82 65.06 73.64 61.95 68.29 Semantria 82.46 62.72 88.33 73.36 94.81 80.25 86.93 80.14 56.14 SenticNet 69.40 46.30 72.46 56.50 86.77 68.25 76.40 66.45 96.55 Sentiment140 85.06 62.50 78.95 69.77 93.65 86.76 90.08 79.92 33.38 Sentiment140_L 67.76 42.07 73.45 53.50 88.01 65.84 75.33 64.41 89.64 SentiStrength 92.09 78.69 92.31 84.96 97.40 92.02 94.64 89.80 27.49 SentiWordNet 62.17 36.86 77.68 50.00 88.84 57.18 69.58 59.79 58.82 SO-CAL 76.55 52.86 77.08 62.71 90.65 76.37 82.90 72.81 71.99 Stanford DM 69.16 35.29 20.27 25.75 75.21 86.68 80.54 53.15 78.90 Umigon 83.37 66.22 75.38 70.50 90.72 86.23 88.42 79.46 63.04 USent 55.98 36.06 80.65 49.83 86.67 46.80 60.78 55.31 43.86 VADER 69.05 45.48 85.88 59.47 92.55 63.00 74.97 67.22 82.23 Comments_BBC AFINN 66.56 23.08 81.08 35.93 96.32 64.66 77.38 56.65 85.11 ANEW_SUB 31.37 15.48 95.79 26.65 97.18 21.73 35.52 31.08 97.07 Emolex 59.64 21.52 89.04 34.67 97.38 55.62 70.80 52.73 80.72 Emoticons 33.33 0.00 0.00 0.00 100.00 33.33 50.00 25.00 0.40 Emoticons DS 13.33 13.10 100.00 23.17 100.00 0.31 0.61 11.89 99.73 NRC Hashtag 84.45 33.33 25.27 28.75 89.76 92.83 91.27 60.01 97.47 LIWC07 50.10 15.38 58.33 24.35 88.00 48.78 62.77 43.56 69.55 LIWC15 63.21 25.86 90.67 40.24 97.55 58.86 73.42 56.83 73.01 Opinion Finder 74.43 21.74 62.50 32.26 94.93 75.72 84.24 58.25 76.46 Opinion Lexicon 74.14 29.81 84.93 44.13 97.24 72.66 83.17 63.65 80.72 PANAS-t 58.73 20.00 75.00 31.58 93.94 56.36 70.45 51.02 8.38 Pattern.en 41.75 19.73 93.55 32.58 96.61 32.57 48.72 40.65 54.79 SASA 61.61 23.50 66.20 34.69 90.80 60.77 72.81 53.75 61.30 Semantria 83.43 40.00 84.75 54.35 97.64 83.26 89.88 72.11 67.42 SenticNet 66.07 24.44 74.16 36.77 94.24 64.83 76.81 56.79 88.96 Sentiment140 68.51 24.00 69.77 35.71 94.04 68.33 79.15 57.43 45.61 Sentiment140_L 56.85 18.52 69.15 29.21 92.35 55.03 68.97 49.09 97.07 SentiStrength 93.93 64.29 78.26 70.59 97.72 95.54 96.61 83.60 32.85 SentiWordNet 57.49 20.00 88.06 32.60 97.13 53.45 68.96 50.78 76.33 SO-CAL 75.28 28.93 80.28 42.54 96.71 74.64 84.25 63.40 82.85 Stanford DM 89.45 63.16 40.91 49.66 91.81 96.52 94.11 71.88 92.02 Umigon 79.37 39.13 61.02 47.68 92.10 82.72 87.15 67.42 50.93 USent 52.60 18.33 80.49 29.86 94.56 48.60 64.20 47.03 43.48 VADER 62.76 22.68 85.54 35.86 96.75 59.60 73.76 54.81 90.69
the newest version, as LIWC appears among the top five methods for -class and -class experiments (see Table ).
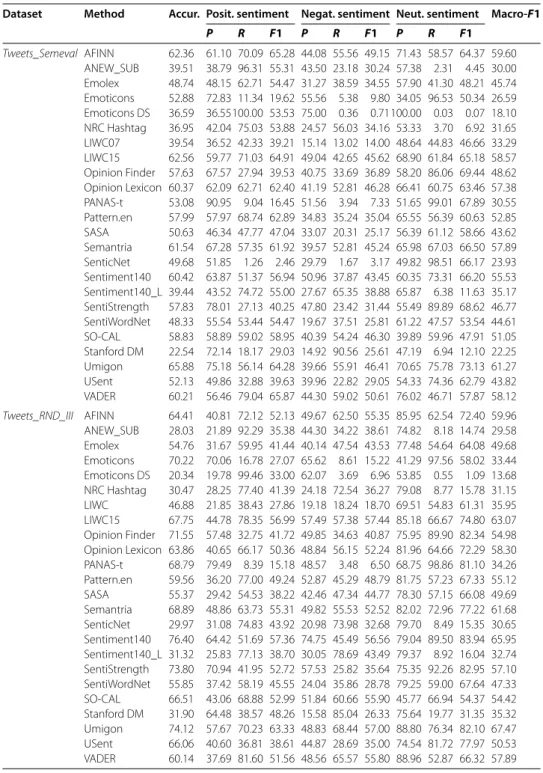
Table 7 3-classes experiments results with 4 datasets
Dataset Method Accur. Posit. sentiment Negat. sentiment Neut. sentiment Macro-F1
P R F1 P R F1 P R F1 Tweets_Semeval AFINN 62.36 61.10 70.09 65.28 44.08 55.56 49.15 71.43 58.57 64.37 59.60
ANEW_SUB 39.51 38.79 96.31 55.31 43.50 23.18 30.24 57.38 2.31 4.45 30.00 Emolex 48.74 48.15 62.71 54.47 31.27 38.59 34.55 57.90 41.30 48.21 45.74 Emoticons 52.88 72.83 11.34 19.62 55.56 5.38 9.80 34.05 96.53 50.34 26.59 Emoticons DS 36.59 36.55100.00 53.53 75.00 0.36 0.71100.00 0.03 0.07 18.10 NRC Hashtag 36.95 42.04 75.03 53.88 24.57 56.03 34.16 53.33 3.70 6.92 31.65 LIWC07 39.54 36.52 42.33 39.21 15.14 13.02 14.00 48.64 44.83 46.66 33.29 LIWC15 62.56 59.77 71.03 64.91 49.04 42.65 45.62 68.90 61.84 65.18 58.57 Opinion Finder 57.63 67.57 27.94 39.53 40.75 33.69 36.89 58.20 86.06 69.44 48.62 Opinion Lexicon 60.37 62.09 62.71 62.40 41.19 52.81 46.28 66.41 60.75 63.46 57.38 PANAS-t 53.08 90.95 9.04 16.45 51.56 3.94 7.33 51.65 99.01 67.89 30.55 Pattern.en 57.99 57.97 68.74 62.89 34.83 35.24 35.04 65.55 56.39 60.63 52.85 SASA 50.63 46.34 47.77 47.04 33.07 20.31 25.17 56.39 61.12 58.66 43.62 Semantria 61.54 67.28 57.35 61.92 39.57 52.81 45.24 65.98 67.03 66.50 57.89 SenticNet 49.68 51.85 1.26 2.46 29.79 1.67 3.17 49.82 98.51 66.17 23.93 Sentiment140 60.42 63.87 51.37 56.94 50.96 37.87 43.45 60.35 73.31 66.20 55.53 Sentiment140_L 39.44 43.52 74.72 55.00 27.67 65.35 38.88 65.87 6.38 11.63 35.17 SentiStrength 57.83 78.01 27.13 40.25 47.80 23.42 31.44 55.49 89.89 68.62 46.77 SentiWordNet 48.33 55.54 53.44 54.47 19.67 37.51 25.81 61.22 47.57 53.54 44.61 SO-CAL 58.83 58.89 59.02 58.95 40.39 54.24 46.30 39.89 59.96 47.91 51.05 Stanford DM 22.54 72.14 18.17 29.03 14.92 90.56 25.61 47.19 6.94 12.10 22.25 Umigon 65.88 75.18 56.14 64.28 39.66 55.91 46.41 70.65 75.78 73.13 61.27 USent 52.13 49.86 32.88 39.63 39.96 22.82 29.05 54.33 74.36 62.79 43.82 VADER 60.21 56.46 79.04 65.87 44.30 59.02 50.61 76.02 46.71 57.87 58.12 Tweets_RND_III AFINN 64.41 40.81 72.12 52.13 49.67 62.50 55.35 85.95 62.54 72.40 59.96 ANEW_SUB 28.03 21.89 92.29 35.38 44.30 34.22 38.61 74.82 8.18 14.74 29.58 Emolex 54.76 31.67 59.95 41.44 40.14 47.54 43.53 77.48 54.64 64.08 49.68 Emoticons 70.22 70.06 16.78 27.07 65.62 8.61 15.22 41.29 97.56 58.02 33.44 Emoticons DS 20.34 19.78 99.46 33.00 62.07 3.69 6.96 53.85 0.55 1.09 13.68 NRC Hashtag 30.47 28.25 77.40 41.39 24.18 72.54 36.27 79.08 8.77 15.78 31.15 LIWC 46.88 21.85 38.43 27.86 19.18 18.24 18.70 69.51 54.83 61.31 35.95 LIWC15 67.75 44.78 78.35 56.99 57.49 57.38 57.44 85.18 66.67 74.80 63.07 Opinion Finder 71.55 57.48 32.75 41.72 49.85 34.63 40.87 75.95 89.90 82.34 54.98 Opinion Lexicon 63.86 40.65 66.17 50.36 48.84 56.15 52.24 81.96 64.66 72.29 58.30 PANAS-t 68.79 79.49 8.39 15.18 48.57 3.48 6.50 68.75 98.86 81.10 34.26 Pattern.en 59.56 36.20 77.00 49.24 52.87 45.29 48.79 81.75 57.23 67.33 55.12 SASA 55.37 29.42 54.53 38.22 42.46 47.34 44.77 78.30 57.15 66.08 49.69 Semantria 68.89 48.86 63.73 55.31 49.82 55.53 52.52 82.02 72.96 77.22 61.68 SenticNet 29.97 31.08 74.83 43.92 20.98 73.98 32.68 79.70 8.49 15.35 30.65 Sentiment140 76.40 64.42 51.69 57.36 74.75 45.49 56.56 79.04 89.50 83.94 65.95 Sentiment140_L 31.32 25.83 77.13 38.70 30.05 78.69 43.49 79.37 8.92 16.04 32.74 SentiStrength 73.80 70.94 41.95 52.72 57.53 25.82 35.64 75.35 92.26 82.95 57.10 SentiWordNet 55.85 37.42 58.19 45.55 24.04 35.86 28.78 79.25 59.00 67.64 47.33 SO-CAL 66.51 43.06 68.88 52.99 51.84 60.66 55.90 45.77 66.94 54.37 54.42 Stanford DM 31.90 64.48 38.57 48.26 15.58 85.04 26.33 75.64 19.77 31.35 35.32 Umigon 74.12 57.67 70.23 63.33 48.83 68.44 57.00 88.80 76.34 82.10 67.47 USent 66.06 40.60 36.81 38.61 44.87 28.69 35.00 74.54 81.72 77.97 50.53 VADER 60.14 37.69 81.60 51.56 48.56 65.57 55.80 88.96 52.87 66.32 57.89
method in a novel dataset, it is crucial to test different methods in a sample of data before simply choose one that is acceptable by the research community.
bench-Table 7 (Continued)
Dataset Method Accur. Posit. sentiment Negat. sentiment Neut. sentiment Macro-F1
P R F1 P R F1 P R F1 Comments_BBC AFINN 50.10 16.22 60.61 25.59 82.62 56.05 66.79 40.11 30.24 34.48 42.29
ANEW_SUB 24.30 11.38 91.92 20.24 84.15 21.13 33.78 38.89 5.65 9.86 21.30 Emolex 44.10 15.51 65.66 25.10 83.19 45.48 58.81 35.27 31.85 33.47 39.13 Emoticons 24.60 0.00 0.00 0.00 33.33 0.15 0.30 19.77 98.79 32.95 11.09 Emoticons DS 10.00 9.85 98.99 17.92 66.67 0.31 0.61 0.00 0.00 0.00 6.18 NRC Hashtag 64.00 20.72 23.23 21.90 70.20 91.27 79.36 52.50 8.47 14.58 38.62 LIWC07 33.00 11.11 42.42 17.61 67.69 33.69 44.99 22.90 27.42 24.95 29.18 LIWC15 43.70 17.94 68.69 28.45 85.06 42.73 56.88 30.72 36.29 33.27 39.53 Opinion Finder 51.80 14.96 35.35 21.02 78.76 60.18 68.23 33.71 36.29 34.95 41.40 Opinion Lexicon 55.00 20.67 62.63 31.08 85.27 59.42 70.04 40.82 40.32 40.57 47.23 PANAS-t 27.10 16.67 6.06 8.89 75.61 4.75 8.93 25.35 94.35 39.97 19.26 Pattern.en 28.70 14.25 58.59 22.92 82.61 17.46 28.82 25.27 46.37 32.72 28.16 SASA 38.20 17.03 47.47 25.07 70.75 36.29 47.98 25.19 39.52 30.77 34.60 Semantria 56.00 28.90 50.51 36.76 83.82 57.12 67.94 35.86 55.24 43.49 49.40 SenticNet 47.10 17.74 66.67 28.03 72.87 57.58 64.33 25.89 11.69 16.11 36.16 Sentiment140 40.00 17.75 30.30 22.39 79.77 31.39 45.05 28.75 66.53 40.15 35.86 Sentiment140_L 43.10 13.32 65.66 22.15 73.84 53.60 62.11 42.11 6.45 11.19 31.82 SentiStrength 44.20 47.37 18.18 26.28 86.64 32.77 47.56 29.37 84.68 43.61 39.15 SentiWordNet 42.40 14.90 59.60 23.84 81.63 41.50 55.03 34.56 37.90 36.15 38.34 SO-CAL 55.50 20.88 57.58 30.65 80.47 63.09 70.73 28.57 34.68 31.33 44.23 Stanford DM 65.50 43.37 36.36 39.56 71.01 89.28 79.10 37.50 14.52 20.93 46.53 Umigon 45.70 28.35 36.36 31.86 76.35 41.04 53.39 29.31 61.69 39.74 41.66 USent 33.80 13.75 33.33 19.47 82.25 21.29 33.82 28.09 66.94 39.57 30.95 VADER 49.40 16.36 71.72 26.64 83.02 54.67 65.93 48.53 26.61 34.38 42.31 Comments_NYT AFINN 42.45 64.81 41.79 50.81 80.29 39.82 53.24 7.89 77.87 14.32 39.46 ANEW_SUB 51.12 48.35 88.57 62.55 79.65 24.69 37.69 7.92 9.84 8.78 36.34 Emolex 42.97 55.12 53.72 54.41 75.35 33.33 46.22 7.22 54.10 12.74 37.79 Emoticons 4.68 0.00 0.00 0.00 0.00 0.00 0.00 4.47 99.59 8.56 2.85 Emoticons DS 42.58 42.55 99.77 59.66 78.57 0.40 0.80 0.00 0.00 0.00 20.15 NRC Hashtag 54.84 55.38 45.74 50.10 61.55 65.68 63.55 8.33 15.16 10.76 41.47 LIWC07 24.35 42.88 27.72 33.67 53.42 19.07 28.11 4.67 53.28 8.58 23.45 LIWC15 36.49 65.29 40.29 49.83 81.50 29.25 43.05 7.17 83.61 13.20 35.36 Opinion Finder 29.38 68.77 18.78 29.51 76.52 32.68 45.80 6.29 88.11 11.75 29.02 Opinion Lexicon 44.57 65.95 43.15 52.17 79.81 43.11 55.98 7.94 73.77 14.34 40.83 PANAS-t 5.88 69.23 1.23 2.41 62.07 1.31 2.57 4.75 99.18 9.07 4.68 Pattern.en 31.60 55.23 45.05 49.63 72.80 17.76 28.55 5.88 65.57 10.79 29.66 SASA 30.04 49.92 30.13 37.58 59.11 27.21 37.26 5.74 61.07 10.49 28.44 Semantria 44.59 70.60 41.83 52.54 80.54 44.24 57.11 7.53 73.36 13.65 41.10 SenticNet 61.85 58.19 59.48 58.83 65.01 69.26 67.07 0.00 0.00 0.00 41.97 Sentiment140 13.58 77.32 6.81 12.51 75.40 11.96 20.65 4.98 93.03 9.45 14.20 Sentiment140_L 54.61 54.72 59.12 56.84 67.00 54.41 60.05 6.70 15.98 9.44 42.11 SentiStrength 18.17 78.51 8.62 15.54 81.12 18.96 30.74 5.41 95.49 10.24 18.84 SentiWordNet 32.20 57.35 34.53 43.10 70.31 26.95 38.97 6.08 70.08 11.19 31.09 SO-CAL 50.79 64.36 51.13 56.99 77.25 49.16 60.08 8.68 65.98 15.34 44.14 Stanford DM 51.93 73.39 21.14 32.83 59.48 77.90 67.46 9.65 38.11 15.40 38.56 Umigon 24.08 68.76 16.38 26.46 68.78 24.51 36.14 5.88 88.93 11.04 24.54 USent 27.44 56.61 28.95 38.31 77.69 21.59 33.79 5.88 79.51 10.94 27.68 VADER 48.03 62.67 51.63 56.62 79.91 43.07 55.97 9.18 71.31 16.26 42.95
mark presents valuable information for researchers and companies that are planning to develop research and solutions on sentiment analysis.
ex-Table 8 Mean rank table for all datasets
3-classes 2-classes
Pos Method Mean Rank Pos Method Mean Rank Coverage (%)
1 VADER 4.00 (4.17) 1 SentiStrength 2.33 (3.00) 29.30 (28.91)
2 LIWC15 4.62 2 Sentiment140 3.44 39.29
3 AFINN 4.69 3 Semantria 4.61 62.34
4 Opinion Lexicon 5.00 4 Opinion Lexicon 6.72 69.50
5 Semantria 5.31 5 LIWC15 7.33 68.28
6 Umigon 5.77 6 SO-CAL 7.61 72.64
7 SO-CAL 7.23 7 AFINN 8.11 73.05
8 Pattern.en 9.92 8 VADER 9.17 (9.79) 82.20 (83.18)
9 Sentiment140 10.92 9 Umigon 9.39 64.11
10 Emolex 11.38 10 PANAS-t 10.17 5.10
11 Opinion Finder 13.08 11 Emoticons 10.39 10.69
12 SentiWordNet 13.38 12 Pattern.en 12.61 65.02
13 Sentiment140_L 13.54 13 SenticNet 13.61 84.00
14 SenticNet 13.62 14 Emolex 14.50 66.12
15 SentiStrength 13.69 (13.71) 15 Opinion Finder 14.72 46.63
16 SASA 14.77 16 USent 14.89 44.00
17 Stanford DM 15.85 17 Sentiment140_L 14.94 93.36
18 USent 15.92 18 NRC Hashtag 17.17 93.52
19 NRC Hashtag 16.31 19 Stanford DM 17.39 87.32
20 LIWC 16.46 20 SentiWordNet 17.50 61.77
21 ANEW_SUB 18.54 21 SASA 18.94 60.12
22 Emoticons 21.00 22 LIWC 19.67 61.82
23 PANAS-t 21.77 23 ANEW_SUB 21.17 94.20
24 Emoticons DS 23.23 24 Emoticons DS 23.61 99.36
Table 9 Friedman’s test results
2-class experiments 3-class experiments
FR 275.59 FR 197.52
Critical value 35.17 Critical value 35.17 Reject null hypothesis Reject null hypothesis
periments and only . for the -class experiment. Considering that we are looking at the performance of the best methods out of unsupervised tools, these numbers suggest that current sentence-level sentiment analysis methods still let a lot of space for improvements. Additionally, we also noted that the best method for each dataset varies considerably from one dataset to another. This might indicate that each method complements the others in different ways.
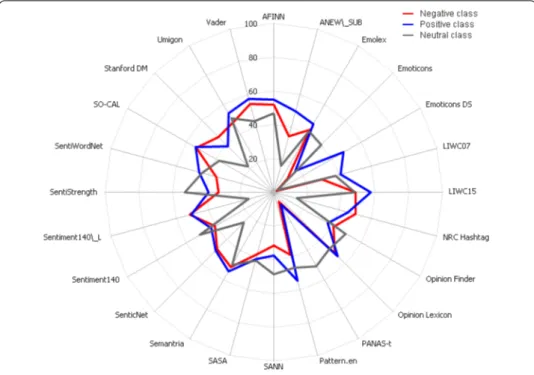
Most methods are better to classify positive than negative or neutral sentences: Figure presents the averageF score for the -class experiments. It is easier to notice that twelve out of twenty-four methods are more accurate while classifying positive than negative or neutral messages, suggesting that some methods may be more biased towards positivity. Neutral messages showed to be even harder to detect by most methods.
Figure 2 AverageF1 score for each class.This figure presents the averageF1 of positive and negative class and as we can see, methods use to achieve better prediction performance on positive messages.
The overall poor performance of this specific method is credited to its lack of treatment of neutral messages and the focus on Twitter messages.
Some methods are consistently among the best ones: Table presents the mean rank value, detailed before, for -class and -class experiments. The elements are sorted by the overall mean rank each method achieved based on Macro-F for all datasets. The top nine meth-ods based on Macro-F for the -class experiments are: SentiStrength, Sentiment, Semantria, OpinionLexicon, LIWC, SO-CAL, AFINN and VADER and Umigon. With the exception of SentiStrength, replaced by Pattern.en, the other eight methods produce the best results across several datasets for both, -class and -class tasks. These methods would be preferable in situations in which any sort of preliminary evaluation is not pos-sible to be done. The mean rank for -class experiments is accompanied by the coverage metric, which is very important to avoid misinterpretation of the results. Observe that SentiStrength and Sentiment exhibited the best mean ranks for these experiments, however both present very low coverage, around % and %, a very poor result com-pared with Semantria and OpinionLexicon that achieved a worse mean rank (. and . respectively) but an expressive better coverage, above %. Note also that SentiStrength and Sentiment present poor results in the -class experiments which can be explained by their bias to the neutral class as mentioned before.
Table 10 Best method for each dataset - 2-class experiments
Dataset Method F1-Pos F1-Neg Macro-F1 Coverage
Comments_BBC SentiStrength 70.59 96.61 83.60 32.85
Comments_Digg SentiStrength 84.96 94.64 89.80 27.49
Comments_NYT SentiStrength 70.11 86.52 78.32 17.63
Comments_TED Emoticons 85.71 94.12 89.92 1.65
Comments_YTB SentiStrength 96.94 89.62 93.28 38.24
Reviews_I SenticNet 97.39 93.66 95.52 69.41
Reviews_II SenticNet 94.15 93.87 94.01 94.25
Myspace SentiStrength 98.73 88.46 93.6 31.53
Amazon SentiStrength 93.85 79.38 86.62 19.58
Tweets_DBT Sentiment140 72.86 83.55 78.2 18.75
Tweets_RND_I SentiStrength 95.28 90.6 92.94 27.13
Tweets_RND_II VADER 99.31 98.45 98.88 94.4
Tweets_RND_III Sentiment140 97.57 95.9 96.73 50.77
Tweets_RND_IV Emoticons 94.74 86.76 88.6 58.27
Tweets_STF SentiStrength 95.76 94.81 95.29 41.78
Tweets_SAN SentiStrength 90.23 88.59 89.41 29.61
Tweets_Semeval SentiStrength 93.93 83.4 88.66 28.66
RW SentiStrength 90.04 75.79 82.92 23.12
Table 11 Best method for each dataset - 3-class experiments
Dataset Method F1-Pos F1-Neg F1-Neu Macro-F1
Comments_BBC Semantria 36.76 67.94 43.49 49.40
Comments_Digg Umigon 49.62 62.04 44.27 51.98
Comments_NYT SO-CAL 56.99 60.08 15.34 44.14
Comments_TED Opinion Lexicon 64.95 56.59 30.77 50.77
Comments_YTB LIWC15 73.68 49.72 48.79 57.4
Myspace LIWC15 78.83 41.74 43.76 54.78
Tweets_DBT Opinion Lexicon 43.44 47.71 48.84 46.66
Tweets_RND_I Umigon 60.53 51.39 65.22 59.05
Tweets_RND_III Umigon 63.33 57.00 82.10 67.47
Tweets_RND_IV Umigon 75.86 76.33 71.54 74.58
Tweets_SAN Umigon 44.16 45.95 70.45 53.52
Tweets_Semeval Umigon 64.28 46.41 73.13 61.27
RW Sentiment140 62.24 51.17 42.66 52.02
emphasize that is possible that other methods, such as paid softwares, make use of some of the datasets used in this benchmark to improve their performance as most of gold standard used in this work is available in the Web or under request to authors.
Some methods showed to be better for specific contexts: In order to better understand the prediction performance of methods in types of data, we divided all datasets in three specific contexts - Social Networks, Comments, and Reviews - and calculated mean rank of the methods for each of them. Table presents the contexts and the respective datasets. Tables , and present the mean rank for each context separately. In the context of Social Networks the best method for -class experiments was Umigon, followed by LIWC and VADER. In the case of -class the winner was SentiStrength with a coverage around % and the third and sixth place were Emoticons and PANAS-t with about % and % of coverage, respectively. This highlights the importance to analyze the -class results together with the coverage. Overall, when there is an emoticon on the text or a word from the psychometric scale PANAS, these methods are able to tell the polarity of the sentences, but they are not able to identify the polarity of the input text for the large majority of the input text. Recent efforts suggest these properties are useful for combina-tion of methods []. Sentiment, LIWC, Semantria, OpinionLexicon and Umigon
Table 12 Contexts’ groups
Context groups
Social Networks Myspace, Tweets_DBT, Tweets_RND_I, Tweets_RND_ II, Tweets_RND_III, Tweets_RND_IV, Tweets_STF, Tweets_SAN, Tweets_Semeval
Comments Comments_BBC, Comments_DIGG, Comments_NYT, Comments_ TED, Comments_YTB, RW Reviews Reviews_I, Reviews_I, Amazon
Table 13 Mean rank table for datasets of social networks
3-classes 2-classes
Pos Method Mean Rank Pos Method Mean Rank Coverage (%)
1 Umigon 2.57 1 SentiStrength 2.22 (2.57) 31.54 (32.18)
2 LIWC15 3.29 2 Sentiment140 3.00 46.98
3 VADER 4.57 (4.57) 3 Emoticons 5.11 18.04
4 AFINN 5.00 4 LIWC15 5.67 71.73
5 Opinion Lexicon 5.57 5 Semantria 5.89 61.98
6 Semantria 6.00 6 PANAS-t 6.33 5.87
7 Sentiment140 7.00 7 Opinion Lexicon 7.56 66.56
8 Pattern.en 7.57 8 Umigon 8.00 71.67
9 SO-CAL 9.00 9 AFINN 8.67 73.37
10 Emolex 12.29 10 SO-CAL 8.78 67.81
11 SentiStrength 12.43 (11.60) 11 VADER 8.78 (9.75) 83.29 (81.90)
12 Opinion Finder 13.00 12 Pattern.en 11.22 69.47
13 SentiWordNet 13.57 13 Sentiment140_L 14.00 94.61
14 SenticNet 14.14 14 Opinion Finder 14.33 39.58
15 SASA 14.86 15 Emolex 14.56 62.63
16 LIWC 15.43 16 USent 15.22 38.60
17 Sentiment140_L 15.43 17 SenticNet 17.22 75.46
18 USent 16.00 18 SentiWordNet 18.44 61.41
19 ANEW_SUB 19.14 19 NRC Hashtag 19.11 94.20
20 Emoticons 19.14 20 SASA 19.44 58.57
21 Stanford DM 19.43 21 LIWC 19.56 61.24
22 NRC Hashtag 20.00 22 ANEW_SUB 20.56 93.51
23 PANAS-t 20.86 23 Stanford DM 22.56 89.06