ENVIRONMENTAL LITERACY IN 9
thGRADE STUDENTS FROM MADEIRA
ISLAND (PORTUGAL)
Hélder Spínola*
*Research and Development Centre in Education, University of Madeira, Campus Universitário da Penteada, 9000-390 Funchal, Portugal
Abstract: Has a contribution to evaluate present levels of environmental literacy in Madeira Island (Portugal), we developed a survey involving 491 9th grade students and found a good level of knowledge (71.8%), a strong tendency to agree with the New Ecological Paradigm (58.2%) and an encouraging level of environmentally responsible behaviors (47.9%) in a ‘very often’ and ‘always’ basis. Results from present study should be considered to improve environmental education programs in place, especially in Portugal and Madeira Island, but new surveys were needed to evaluate other age groups as also the relationship between different components of environmental literacy.
INTRODUCTION
Environmentally literate citizenry, being an important prerequisite to maintain and improve the quality of the environment, becomes the environmental education main purpose (Disinger & Roth, 1992). Since environmental literacy is a complex concept and also, in practice, difficult to be achieved, along past decades different authors considered a wide spectrum of components to be included in it, making its definition a dynamic undertaking. Nowadays, it is commonly accepted that environmental literacy must include knowledge and understanding of environmental concepts, problems, and issues, a set of cognitive and affective dispositions, and a set of cognitive skills and abilities, together with the appropriate behavioral strategies to apply such knowledge and understanding in order to make sound and effective decisions in a range of environmental contexts (Hollweg et. al., 2011).
As a simple definition, environmental literacy could be seen as a domain of four interrelated components: knowledge, dispositions, competencies, and environmentally responsible behavior (Hungerford & Volk, 1990; Cook & Berrenberg, 1981; Stern, 2000; Hollweg et. al., 2011). Nevertheless this simplification, each of the above four components hold a complex structure that needs to be taken in consideration in environmental education practices, namely the fact that, among others: knowledge should include physical, ecological, social, cultural and political systems; that dispositions involves sensitivity, attitudes, personal responsibility and motivation; that competencies implies identify, analyze, investigate, evaluate and resolve environmental issues; and that environmentally responsible behavior includes practices in eco-management, persuasion, consumer/economic action, political action and legal action (Hollweg et. al., 2011).
Evaluating environmental literacy in a population is the best strategy to assess the efficiency of the environmental education efforts, as also to address the needs for better strategies. However, environmental literacy has a complex structure that makes difficult include all their components in any single assessment, being of fundamental importance to identify the essential elements to be addressed in the survey. In order to overcome this problem, several authors identified knowledge, attitude and environmentally responsible behavior as the major components of the environmental literacy to be included in the surveys (Hallfreðsdóttir, 2011; Krnel & Naglič, 2009; Igbokwe, 2012; McBeth & Volk, 2010; Kuhlemeier, et. al., 1999; Pe'er et. al., 2007).
METHOD
Our survey design is based in others already applied to assess environmental literacy among students but adjusted to the local specificities (Krnel & Naglič, 2009; Hallfreðsdóttir, 2011; Pauw & Van Petegem, 2011 and 2013; Ozsoy et. al., 2012). The questionnaire was anonymous with close-ended questions consisting of three main sections, each one measuring and assessing: knowledge (10 questions), attitude (15 questions) and environmentally responsible behavior (15 questions) (questionnaire available upon request). First section goes through the 3 themes mostly involved in environmental education activities on Portuguese schools: water (3 questions), energy (3 questions), and wastes (4 questions); each one going along 3 main aspects: cause of problems, regional context and behavior options. In each question, the respondents were asked to select the correct answer. To measure pro-environmental attitude the questionnaire used the New Ecologic Paradigm (NEP) Scale, an instrument widely used and validated in the measure of pro-environmental orientation (Dunlap et. al., 2000; Ogunbode, 2013; Trobe & Acott, 2000; Watne et. al., 2012; Shoukry et. al., 2012; Ogunjinmi et al., 2012; Kostova et. al., 2011). The environmentally responsible behaviors were assessed through statements spanning across the 3 main themes already selected for knowledge section: water (4 statements), energy (6 statements) and wastes (5 statements). Each statement addresses specific everyday behaviors and students were asked to select their frequency in a Likert-type scale ranging from 1 (never) to 5 (always). A special care was taken to overcome potential social desirability bias that could overcome in self-reported assessments (Bryman, 2004, p.134; Nederhof, 1985). In order to obtain an internal validity indicator, two redundant questions [“a) I put paper, glass bottles and plastic bags in different containers” and j) “I put all kind of wastes in the same container”] were added. The questionnaire was pre-tested and the final version was applied to all sample students between April and May 2013, after informed consent from each school board.
The sample included 491 9th grade students from 5 elementary schools in Madeira Island (Portugal). Data collected in the survey was analyzed with SPSS (version 20) statistical software. Accordingly to the student’s responses, the data were converted to numeral scores ranging from 1 to 5, for the items in the attitude and behavioral domains, and, for knowledge, scored “1” or “0” if answers were correct or incorrect, respectively. Firstly, reliability (the Cronbach’s Alpha score was 0.705 for the entire measuring instrument) and validity (confirmed by factor analysis and internal validity indicator questions that show a significant positive correlation [r=0.641 p=0.000]) were evaluated followed by a set of descriptive statistics: mean, mode, median, standard deviation, and standard error of the mean. Q-Q plot graphical measure and Kolmogorov-Smirnov test were used to test the normality of distribution before any factor analysis of numerical variables was carried out.
For the overall and each one of the three data domains (knowledge, attitude and behavior), item by item and total average student’s scores were calculated. For knowledge, the frequency of correct answers for total and each theme (water, energy and wastes) was calculated. With the data collected from the questionnaire’s attitude section, we calculated the total attitude score and the level of concordance with the New Ecological Paradigm (NEP) and with the Dominant Social Paradigm (DSP). Also, the level of concordance with each of the five groups items that compose NEP scale were also calculated: limits to growth, anti-anthropocentrism, fragility of nature’s balance, rejection of exemptionalism, and possibility of an eco-crisis. The prevalence of each specific environmental responsible behavior was calculated but also for overall and for water, energy and wastes themes. Significance was addressed through independent sample t-test when comparing means and one sample z-test of proportions (2-tailed) when comparing prevalence’s, with a confidence level of 95%.
RESULTS
The 491 9th grade students involved in this survey had a mean age of 15 years, and males (51.3%) are slightly most prevalent than females (48.7%). Missing values account for 3.1% on total sample. General results are available upon request.
Knowledge.
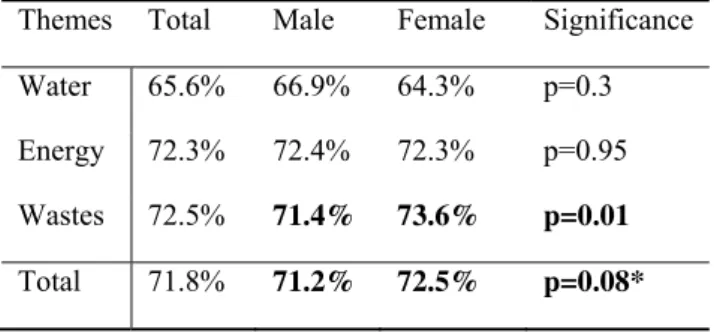
Correct answers in knowledge section reach a score of 71.8%, similar between male (71.2%) and female (72.5%) (p=0.08), despite its significance at 1-tailed (p=0.04) (Table 1). In fact, in 5 specific knowledge’s that showed statistically significant differences between male and female, 4 were better for female (data not shown).
The levels of knowledge in Energy (72.3%) and Wastes (72.5%) are similar (p=0.83) but significantly highest than in Water (65.5%) (p=0.000). In Water (p=0.3) and Energy (p=0.95) the level of knowledge is similar between male and female but significantly higher in this last one for Wastes (p=0.01) (Table 1).
sufficient for the needs, as 47.1% of the students correctly pointed out.
Despite Madeira is dependent on fossil fuels for more than 90% of its energetic needs, almost 53% of 9th grade students believe that renewable energy is, instead, the main source. Also, more than half student (55.2%) doesn’t know that, in their context, air pollution is mostly caused by transports. However, a large majority (86%) is perfectly aware of correct practices to save energy. In fact, more than 80% knows that switching off on the TV button (84.9%), using fluorescent lamps (87.7%), travelling by bus (82.2%) and buying regional products (89.2%) are options that represent lower energy consumption.
On wastes, almost half of the students (49%) realize that its production increased along past decades in Madeira Island, yet, the other half believes that it remained stable (33.6%) or oscillating (7.7%), and even decreasing (9.7%). High levels of agreement were obtained with the fact that ‘we must put the trash in the appropriate containers’ (98.8%), that ‘when we walk in nature, we must bring back the garbage with us’ (89.3%), that ‘disposable products contribute to increase waste production’ (72%), and that, but not so high, ‘returnable packaging will reduce the production of waste’ (62.3%) (data not shown).
Considering the knowledge in how to segregate wastes for recycling, information of much relevance for environmentally responsible behaviors, the average percentage of correct answers was high (72.2%). However, it is concerning that 91% of students doesn’t know the correct container to put a broken windows glass, as also a tea cup (71%), thinking, wrongly, that they should be collected in the green container, together with glass bottles for recycling. In the other extreme is the segregation of a journal (97%), a notebook (94.6%) or a glass bottle (98.3%), since almost all students know the exact container for recycling.
Symbology in wastes shows also very discrepant results. The symbols ‘put garbage in the bin’ (98.3%) and ‘flatten the empty packaging’ (98.7%) were identified by almost all students, but the ‘green dot’ (‘included in the valuable and recycling system for packaging’) (17.9%) and ‘recyclable material’ (17.4%) were acknowledged correctly by a minority. In fact, green dot is misunderstood as meaning ‘recyclable material’ (81%) and ‘recyclable material’ symbol as ‘included in the valuation and recycling system for packaging’ (81.1%).
Table 1. Percentage of correct answers for total, water, energy and wastes environmental knowledge in 9th grade
students, by total and by gender. *Significant at 1-tailed with p≤0.05.
Attitude.
In a five points scale for attitude towards the environment: 1 and 2 (Dominant Social Paradigm- DSP), 3 (Unsure), and 4 and 5 (New Ecological Paradigm- NEP); the overall sample score 3.64 points, which means that, in average, the 9th grade students from Madeira Island places themselves between Undefined and pro New Ecological Paradigm attitude.
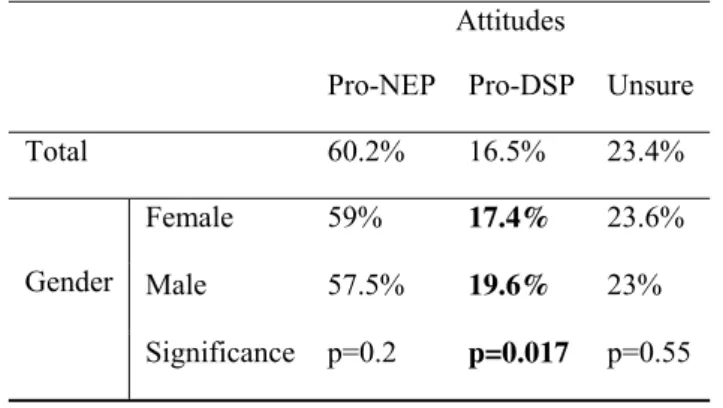
Overall pro-NEP (60.2%) reveals to be in a significantly higher prevalence among 9th grade students than pro-DSP (16.5%) (p=0.000) or Unsure (23.4%) (p=0.000) attitudes (Table 3). Male students showed a significantly higher concordance with the Dominant Social Paradigm than female (p=0.017) (Table 2).
Response prevalence’s for each NEP scale statement in total 9th grade students showed a clear overall tendency to agree with ‘limits to growth’, ‘anti-anthropocentrism’, ‘fragility of nature’s balance’, ‘rejection of exemptionalism’ and ‘possibility of an eco-crisis’, despite it is also high the indecision, specially on ‘rejection of exemptionalism’ and ‘limits to growth’, this last one with the statement “the earth has plenty of natural resources if we just learn how to develop them” showing a clear pro Dominant Social Paradigm attitude (Table 3). Concordance with each one of the five NEP scale facets of an ecological worldview was significantly higher for female students, at 1-tailded, only in ‘anti-anthropocentrism’ (p=0.06) (data not shown). In overall sample, there is a lack of concordance with the existence of ‘limits to growth’ (44.8%) but high levels of ‘anti-anthropocentrism’ (72.3%) and agreement with the ‘fragility of nature’s balance’ (69.1%). Only half of total students (50.9%) agree
Themes Total Male Female Significance
Water 65.6% 66.9% 64.3% p=0.3
Energy 72.3% 72.4% 72.3% p=0.95
Wastes 72.5% 71.4% 73.6% p=0.01
with the ‘rejection of exemptionalism’ but better with the ‘possibility of an eco-crisis’ (61.4%) (Table 3).
The highest value of concordance found among all the NEP scale statements was for ‘plants and animals have as much right as humans to exist’ (89.8%) and, on the other hand, the highest value of discordance was for ‘humans were meant to rule over the rest of nature’ (65.4%), both results rejecting anthropocentrism (Table 3). For the unsure condition, the highest value was for ‘the so-called ecological crisis facing humankind has been greatly exaggerated’ (38.2%) followed by ‘human ingenuity will ensure that we do not make the Earth unlivable’ (36.5%) and ‘we are approaching the limit of the number of people the Earth can support’ (35.5%). The lowest level of indecision was for ‘plants and animals have as much right as humans to exist’ (6.9%), a statement that also get the lowest level of discordance (3.4%) together with ‘despite our special abilities, humans are still subject to the laws of nature’ (5%) and ‘humans are severely abusing the environment (5.6%) (Table 3).
Table 2. Average percentages of pro New Ecological Paradigm NEP), pro Dominant Social Paradigm (Pro-DSP) and Unsure attitudes in 9th grade students by total and gender. Statistical significant differences in bold.
Attitudes
Pro-NEP Pro-DSP Unsure
Total 60.2% 16.5% 23.4%
Gender
Female 59% 17.4% 23.6%
Male 57.5% 19.6% 23%
Significance p=0.2 p=0.017 p=0.55
Table 3. Response prevalence’s for each NEP scale statement in total 9th grade students. The two highest
prevalence’s for each statement in bold. Pro-NEP: Pro New Ecological Paradigm attitude (MA + SA); Pro-DSP: Pro Dominant Social Paradigm attitude (SD + MD); SD- Strongly disagree; MD- Mildly disagree; U- Unsure;
MA- Mildly agree; SA- Strongly agree.
NEP scale statements Percentage (%) of responses
SD MD U MA SA
Limits to growth
(Pro-NEP= 44.8%; Pro-DSP= 26.4%; Unsure= 28.8%):
Q1▪ We are approaching the limit of the number of people the Earth can support.
8.4 19.4 35.5 26.7 10
Q6▪ The earth has plenty of natural resources if we just learn how to develop them.
10.6 15.6 18.3 36.3 19.2
Q11▪ The Earth is like a spaceship with very limited room and resources.
8 15.5 29.6 33.5 13.4
Anti-anthropocentrism
(Pro-NEP= 72.3%; Pro-DSP= 11.3%; Unsure= 16.4%):
Q2▪ Humans have the right to modify the natural environment to suit their needs.
Q7▪ Plants and animals have as much right as humans to exist.
1.5 1.9 6.9 23 66.8
Q12▪ Humans were meant to rule over the rest of nature 32.6 32.8 21.7 8.8 4
Fragility of nature’s balance
(Pro-NEP= 69.1%; Pro-DSP= 11.3%; Unsure= 19.7%):
Q3▪ When humans interfere with nature, it often produces disastrous consequences.
1 6.1 14.3 46.5 32.1
Q8▪ The balance of nature is strong enough to cope with the impacts of modern industrial nations.
20.3 42.2 24.8 10 2.7
Q13▪ The balance of nature is very delicate and easily upset. 1.9 11.9 18.6 42.3 25.3
Rejection of exemptionalism
(Pro-NEP= 51%; Pro-DSP=19%; Unsure= 30%):
Q4▪ Human ingenuity will ensure that we do not make the earth unlivable.
7.3 27.7 36.5 22 6.5
Q9▪ Despite our special abilities, humans are still subject to the laws of nature.
0.8 4.2 19.7 45.5 29.8
Q14▪ Humans will eventually learn enough about how nature works to be able to control it.
12.3 30.9 32.2 19.4 5.2
Possibility of an eco-crisis
(Pro-NEP= 61.4%; Pro-DSP= 14%; Unsure= 24.8%):
Q5▪ Humans are severely abusing the environment. 2.3 3.3 13.8 40.8 39.7
Q10▪ The so-called “ecological crisis” facing humankind has been greatly exaggerated.
8.4 25.7 38.2 21.1 6.7
Q15▪ If things continue on their present course, we will soon experience a major ecological catastrophe?
2.7 6.5 20.8 37.3 32.7
Behavior.
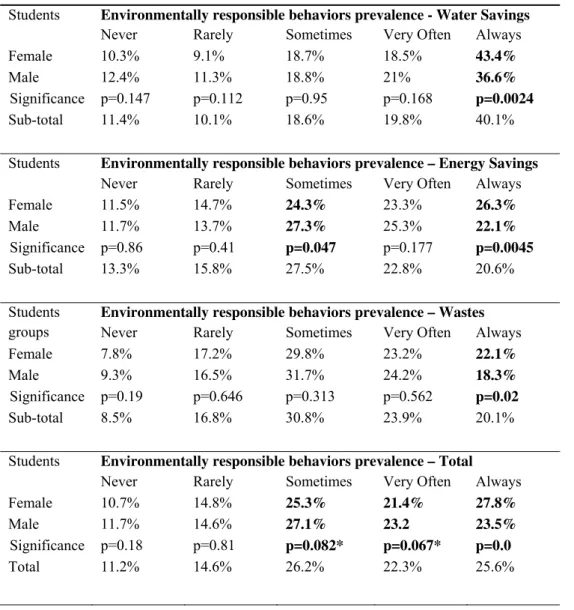
Missing values in behavior section account for 2.1%. In a five points scale for environmentally responsible behavior practices (1-Never, 2- Rarely, 3-Sometimes, 4- Very Often, 5- Always), the overall sample score is 3.37 points, which means that, in average, the 9th grade students from Madeira Island places themselves as practicing environmentally responsible behaviors between ‘sometimes’ and ‘very often’ (data not shown). Environmentally responsible behaviors among overall 9th grade students from Madeira Island reached 25.6% in an ‘always’ basis and 22.3% in ‘very often’. In the other side, only 11.2% refer to ‘never’ practice the behaviors evaluated and only 14.6% ‘rarely’ (Table 4). In the overall sample, female students had shown statistically highest prevalence’s of environmentally responsible behaviors than male, which also occurs for each set of behaviors in water and energy savings, as also in waste management, especially in an ‘always’ basis (Table 4).
68.5% in a very often and always basis but on the shower it is much lower with only 38.9%. Most students prefer to have a shower (74% always and very often) and more than half (58.1% always and very often) avoid unload the toilet unnecessarily. Few students take care to save energy when they open the refrigerator (34.1%) or switch off TV (23.3%) but the majority never or rarely leave lights on unnecessarily (69.6%) and always or very often go to school by bus or on foot (54.7%), despite only 41.1% never or rarely ask for a ride in their parent’s car. The number of students that clearly reject products from abroad, which, as we know, spend more energy due to transportation, doesn't go far beyond a third (36.8%), many prefer them sometimes (43.4%) and one fifth always or very often (19.7%). Sorting wastes for recycling is a behavior followed always and very often by only 40.7% of students, the same number that reduces wastes production by drinking tap water instead of bottled. Despite only 17.7% of students assume that they keep throwing trash on the floor, at least sometimes, almost half (49.4%) witnessed their colleagues practicing that kind of behavior (data not shown).
Table 4. Environmentally responsible behaviors prevalence’s for total, water savings, energy savings and wastes management in 9th grade students by total and by gender. Statistical significant differences in bold. *Significant
at 1-tailed with p≤0.05.
Students Environmentally responsible behaviors prevalence - Water Savings Never Rarely Sometimes Very Often Always Female 10.3% 9.1% 18.7% 18.5% 43.4%
Male 12.4% 11.3% 18.8% 21% 36.6%
Significance p=0.147 p=0.112 p=0.95 p=0.168 p=0.0024 Sub-total 11.4% 10.1% 18.6% 19.8% 40.1%
Students Environmentally responsible behaviors prevalence – Energy Savings Never Rarely Sometimes Very Often Always Female 11.5% 14.7% 24.3% 23.3% 26.3%
Male 11.7% 13.7% 27.3% 25.3% 22.1% Significance p=0.86 p=0.41 p=0.047 p=0.177 p=0.0045 Sub-total 13.3% 15.8% 27.5% 22.8% 20.6%
Students groups
Environmentally responsible behaviors prevalence – Wastes
Never Rarely Sometimes Very Often Always Female 7.8% 17.2% 29.8% 23.2% 22.1%
Male 9.3% 16.5% 31.7% 24.2% 18.3%
Significance p=0.19 p=0.646 p=0.313 p=0.562 p=0.02 Sub-total 8.5% 16.8% 30.8% 23.9% 20.1%
Students Environmentally responsible behaviors prevalence – Total
Never Rarely Sometimes Very Often Always
Female 10.7% 14.8% 25.3% 21.4% 27.8%
Male 11.7% 14.6% 27.1% 23.2 23.5%
Significance p=0.18 p=0.81 p=0.082* p=0.067* p=0.0
Total 11.2% 14.6% 26.2% 22.3% 25.6%
DISCUSSION
and many programs miss to address their effectiveness (Carleton-Hug & Hug, 2010). Present study characterizes knowledge, attitude and environmentally responsible behaviors, the main components of environmental literacy, among 9th grade students from Madeira Island (Portugal). Total 9th grade students shows a good level of knowledge (71.8%), a strong tendency to agree with the New Ecological Paradigm (58.2%) and an encouraging level of environmentally responsible behaviors (47.9% for ‘very often’ plus ‘always’). This environmental literacy structure among 9th grade students from Madeira Island is clearly unbalanced showing that the environmental education programs have been more effective transmitting knowledge than promoting environmentally responsible behaviors, a tendency also found in previous studies (Mcbeth & Volk, 2010; Lewis, 2008; Negev et. al., 2008; Carmi et. al., 2015).
However, despite these good levels of knowledge, there are some aspects that need to be improved. For example, the fact that the majority of students think that broken windows and tea cups should be collected together with glass bottles in green containers could bring serious complications for the recycling process and, as so, it’s a wrong idea that needs to be fight back urgently trough appropriate environmental education. Also, some symbology for waste package are not correctly understood (green dot and recyclable material) and needs specific campaigns to overcome those fails.
Also, considering that gender represents different societal influences to which students are subject, the significant variations found between males and females shows that environmental literacy knowledge, attitude and behavior are subject to the influences of the community context in which each student is inserted. Previous studies add also revealed these influences (Sakar & Ara, 2007; Stevenson et. al., 2013; Negev et. al., 2008) showing that environmental education needs to overcome the barriers imposed by school walls and intermingle their action with the surrounding environment and society. In fact, some authors consider that environmental education is failing because it misses a link between the individual actions taught inside the classroom and the reality found in the society (Blumstein & Saylan, 2007).
The overall tendency for a pro-NEP attitude on the 9th grade students from Madeira Island reveals an exception, the level of concordance with the existence of ‘limits to growth’ (44.8%), the only component lower than 50%. This exception represents a future challenge for environmental education in this insular community since understanding the limits of the Planet is fundamental to engage in sustainability. However, as we can see in the results section, this low levels of concordance with the ‘limits to growth’ was mostly influenced by the statement ‘the Earth has plenty of natural resources if we just learn how to develop them’, which could has been misunderstood by students due to the need for a better translation for Portuguese language.
Our results show also a set of low prevalent environmentally responsible behaviors that needs to be specifically addressed through appropriate environmental education programs, namely the preference for local products or the elimination of the sand by energy consumption.
CONCLUSIONS
Present study shows that 9th grade students from Madeira Island have good levels of environmental literacy but need to improve in several aspects of knowledge and attitude, and much more in environmentally responsible behaviors. Environmental education programs and strategies in Madeira Island need to be suited for this purpose and, especially, be more oriented to promote environmentally responsible behaviors. Since the context where students and schools are inserted seems to exert important influences, and following the best practices in environmental education, the work of education establishments needs to be part of a network involving the local community. Also, new evaluations and studies need to be done not only to include different age group but also to better understand the effects of the social and environmental contexts in the development of the environmental literacy. This enlightenment will be helpful to design environmental education programs and strategies suited and effective for the Portuguese context.
ACKNOWLEDGMENTS
REFERENCES
Blumstein, D.T. & Saylan, C. (2007). The failure of environmental education (and how we can fix it). PLoS Biol 5(5): e120. doi:10.1371/journal. pbio.0050120.
Bryman, A. (2004). Social Research Methods. 2nd edition. Oxford: Oxford University Press.
Carleton-Hug A. & Hug J.W. (2010). Challenge and opportunities for evaluating environmental education programs. Evaluation and Program Planning, 33: 159-164.
Carmi, N., Arnon, S. & Orion, N. (2015). Transforming Environmental Knowledge Into Behavior: The Mediating Role of Environmental Emotions. The Journal of Environmental Education, 46 (3): 183-201.
Cook, S. & Berrenberg, J. L. (1981). Approaches to encouraging conservation behavior: a review and conceptual framework. Journal of Social Issues, 37 (2): 73-107.
Disinger, J.F. & Roth, C.E. (1992). Environmental Education research news. The Environmentalist, 12: 165-168. Dunlap, R.E., Van Liere, K.D., Mertig, A.G. & Jones, R.E. (2000). Measuring Endorsement of the New Ecological Paradigm: A Revised NEP Scale. Journal of Social Issues, 56 (3): 425-442.
Hallfreðsdóttir, S. (2011). Eco Schools – Are They Really Better? Comparison of Environmental Knowledge, Attitude and Actions between Students in Environmentally Certified Schools and Traditional Schools in Iceland A thesis submitted in partial fulfillment of the requirements of Lund University International Master’s. Programme in Environmental Studies and Sustainability Science (LUMES). Lund University Centre for Sustainability Studies, LUND, Sweden.
Hollweg, K. S., Taylor, J. R., Bybee, R. W., Marcinkowski, T. J., McBeth, W. C., & Zoido, P. (2011). Developing a framework for assessing environmental literacy. Washington, DC: North American Association for Environmental Education.
Hungerford, H.R. & Volk, T. (1990). Changing learner behavior through environmental education. The Journal of Environmental Education, 21 (3): 8-22.
Igbokwe, A. B. (2012). Environmental Literacy Assessment: Exploring the Potential for the Assessment of Environmental Education/Programs in Ontario Schools. International Journal for Cross-Disciplinary Subjects in Education (IJCDSE), 3 (1): 640-656.
Kostova, Z., Vladimirova, E., Radoynovska, B. (2011). The environmental concern of nine-grade students from a secondary professional school. Bulgarian Journal of Science and Education Policy (B JSEP), 5 (1): 178-218. Krnel D. & Naglič, S. (2009). Environmental literacy comparison between eco-schools and ordinary schools in Slovenia. Science Education International,20(1/2): 5-24.
Kuhlemeier, H., Bergh, H. & Lagerweij, N. (1999). Environmental Knowledge, Attitudes, and Behavior in Dutch Secondary Education. The Journal of Environmental Education. 30 (2): 4-14.
Lewis, R.M.(2008). Measuring Environmental Literacy in Fargo, North Dakota, and Moorhead, Minnesota. North Dakota State University of Agriculture and Applied Science. Retrieved 23-09-2014 in:
http://www.google.pt/url?sa=t&rct=j&q=&esrc=s&source=web&cd=9&ved=0CGIQFjAI&url=http%3A%2F%2
Fwww.gscience.org%2Fuploads%255Cresources%255C604%255Csurvey-environmental-literacy_ruth-lewis_ms-2008.pdf&ei=b5ghVKGwDsfFPLPTgIAD&usg=AFQjCNEQK5H3HEAGsHIeo_1GFK0XBEhEcg. McBeth, W. & Volk, T.L. (2010). The national environmental literacy project: A baseline study of middle grade students in United States. The Journal of Environmental Education, 41(1): 55-67.
Nederhof, A.J. (1985). Methods of coping with social desirability bias: a review. European Journal of Social Psychology, 15: 263-280.
Negev, M., Sagy, G., Garb, Y., Salzberg, A. & Alon Tal, A. (2008). Evaluating the Environmental Literacy of Israeli Elementary and High School Students. The Journal of Environmental Education, 39 (2): 3-20.
Ogunbode, C.A. (2013). The NEP scale: measuring ecological attitudes/worldviews in an African context. Environment, Development and Sustainability, 15 (6): 1477-1494.
Ogunjinmi, A.A., Onadeko, S.A. & Adewumi, A.A. (2012). An Empirical Study of the Effects of Personal Factors on Environmental Attitudes of Local Communities around Nigeria’s Protected Areas. The Journal of Transdisciplinary Environmental Studies, 11 (1): 40-53.
Ozsoy, S., Ertepinar, H. and Saglam, N. (2012). Can eco-schools improve elementary school students’ environmental literacy levels? Asia-Pacific Forum on Science Learning and Teaching, 13 (2), Article 3: 1-25. Pauw, J.B. and Van Petegem, P. (2011). The Effect of Flemish Eco‐Schools on Student Environmental Knowledge, Attitudes, and Affect. International Journal of Science Education, 33 (11): 1513-1538.
Pauw, J.B. and Van Petegem, P. (2013). The effect of eco-schools on children’s environmental values and behavior. Journal of Biological Education, 47 (2): 96-103.
between_urban_and_rural_areas_of_Natore_district
Shoukry. S.H., Saad, S.G., Eltemsahi, A.M., & Abolfotouh, M.A. (2012). Awareness, Attitude, and Concerns of Workers and Stakeholders of an Environmental Organization Toward the Environment. SAGE Open, October-December 2012: 1–10.
Spínola, H. (2014). Forty years of environmental education in the Portuguese Democracy. The Online Journal of New Horizons in Education, 4 (3): 47-55.
Stern, P. (2000). Toward a coherent theory of environmentally significant behavior. The Journal of Social Issues, 56 (3): 407.
Stevenson, K.T., Peterson, M.N., Bondell, H.D., Mertig, A.G. & Moore, S,E, (2013). Environmental, Institutional, and Demographic Predictors of Environmental Literacy among Middle School Children. PLoS ONE 8(3): e59519. doi:10.1371/journal.pone.0059519.
Trobe, H.L. & Acott, T.G. (2000). A Modified NEP/DSP Environmental Attitudes Scale. The Journal of Environmental Education, 32 (1): 12-20.