ISSN 0104-530X (Print) ISSN 1806-9649 (Online)
Resumo: Segundo a teoria dos stakeholders, empresas que coordenam os interesses dos diversos stakeholders apresentam um desempenho superior àquelas que priorizam apenas os interesses dos shareholders e, portanto, um melhor desempenho social corporativo – CSP, entenda-se melhor atendimento dos interesses dos stakeholders, leva a um melhor desempenho financeiro corporativo – CFP. O interesse desse tema desencadeou a realização de dezenas de pesquisas empíricas testando a relação entre CSP e CFP. No início da década de 2000, a predominância dos estudos empíricos revelava uma associação positiva entre CSP e CFP e, em função disso, a comunidade acadêmica aceitou ser essa relação normalmente positiva. Entretanto, ao menos duas questões chamam atenção: “A predominância da relação positiva entre CSP e CFP ainda persiste em pesquisas mais recentes?” e “Quais stakeholders estão mais associados positivamente ao desempenho financeiro?” Em função dessas questões, o objetivo desta pesquisa é a análise da relação CSP-CFP a partir das pesquisas empíricas dos últimos anos. Empregou-se a técnica de metanálise, aplicando-a aos dados dos artigos empíricos publicados entre 1998 e 2010. Os resultados não confirmam uma generalização da relação positiva entre a CSP e a CFP, além disso, na análise individual, as relações entre o desempenho junto a cada stakeholder e o desempenho financeiro, apenas o stakeholder funcionário apresentou clara relação positiva. Esses resultados sugerem mais cautela no uso gerencial da premissa de uma relação CSP-CFP positiva e a recomendação de mais estudos quanto às nuances dessa relação. Palavras-chave: Stakeholder; Responsabilidade social; Performance social; Performance financeira; Metanálise. Abstract: According to the stakeholder theory, companies which coordinate the interests of their several stakeholders show better performance than companies which prioritize only shareholders’ interests, and thus also show a better corporate social performance (CSP, or better addressing stakeholders’ interests), which leads to a better corporate financial performance (CFP). The interest in this subject has elicited a series of empirical studies testing the relation between CSP and CFP. In the beginning of the 2000’s most part of those studies revealed a positive association between CSP and CFP and consequently academia has taken it to be generally positive. However at least two issues deserve closer examination: “Does the prevalence of a positive relation between CSP and CFP still hold in more recent research?” and “Which stakeholders are more positively associated to the financial performance?” The aim of the present paper is to analyze the relation between CSP and CFP in the light of empirical research in the last few years. The meta-analysis technique, has been employed on articles published between 1998 and 2010. Results do not confirm generalization of a positive relation between CSP and CFP. Furthermore, when the link between each stakeholder’s performance and respective financial performance was tested, only the “employee” stakeholder presented a clear positive relation. Such results suggest a more cautious use of the positive CSP/CFP relation by company management, as well as the pursuit of further studies on the nuances of this relation.
Keywords: Stakeholder; Social responsibility; Social performance; Financial performance; Meta-analysis.
Meta-analysis of the relation between corporate
social performance and corporate financial
performance
Metanálise da relação entre a performance social e a performance financeira corporativa
Ralph Santos da Silva1
João Maurício Gama Boaventura2
Rodrigo Bandeira-de-Mello3
1 Centro de Tecnologia da Informação – CTI, Rodovia Dom Pedro I, Km 143,6, Techno Park, CEP 13092-599, Campinas, SP, Brasil,
e-mail: [email protected]
2 Programa de Pós-graduação em Administração – PPGA, Faculdade de Economia, Administração e Contabilidade – FEA, Universidade
de São Paulo – USP, Av. Prof. Luciano Gualberto, 908, Butantã, CEP 05508-010, São Paulo, SP, Brasil, e-mail: [email protected]
3 Departamento de Administração Geral e Recursos Humanos, Escola de Administração de Empresas de São Paulo – EAESP, Fundação
Getúlio Vargas – FGV, Av. Nove de Julho, 2029, Bela Vista, CEP 01313-902, São Paulo, SP, Brasil, e-mail: [email protected] Received Oct. 9, 2016 - Accepted June 3, 2017
Financial support: CNPQ - National Council for Scientific and Technological Development.
1. Introduction
Slack et al. (2002) classify the objectives of production performance into broad and specific ones. Broad objectives relate to the stakeholders’
Wheelwright (1984). Although the need to address the stakeholders’ interests has been made explicit, Slack et al. (2002) do not specify any order of precedence on addressing the diverse groups of stakeholders. It is therefore unclear whether the shareholders’ interests prevail over the interests of collaborators, clients and suppliers, and vice-versa.
Freeman is categorical regarding this relation of precedence. His proposition states that companies which address the stakeholders’ interests show better financial performance than those seeking to address only the shareholders’. That statement has triggered an intense search for empirical evidence that supports it. A consequence of this argument is that a better corporate social performance (CSP), or better addressing the stakeholders’ interests, would entail a better corporate financial performance (CFP).
The impact of the adoption of the stakeholder theory by company management, based on the vision of a positive CSP/CFP relation, led in the 80’s and 90’s to several researchers testing the hypothesis. In the early 2000’s academia intensely debated which theoretical contribution to this relation would be possible out of the empirical research. Two papers were then published, which have become staples in this field, and which consolidated the findings of empirical research by employing meta-analyses: Margolis & Walsh’s (2003), and Orlitzky et al. (2003). The former work involved a qualitative meta-analysis and the latter a statistical one. Both papers strengthened the viewpoint of a positive CSP-CFP relation, as did the respective proposition in the stakeholder theory.
Nevertheless, would it be reasonable to affirm that the empirical results of both works above on the CSP-CFP relation still hold true after 10 years have elapsed? The present paper justifies its existence by seeking to update the analysis, verify whether the results hold or not, and to answer the following questions: “Does the prevalence of the positive CSP-CFP relation still hold in more recent research?” and “Which stakeholders are more positively associated to the financial performance?” This objective is corroborated by more recent papers, as that of Van Beurden & Gössling (2008), which stresses the need to further study that relation due to its several existing nuances.
Based on the questions above, the present paper aims to analyze the relation between Corporate Social Performance (CSP) and Corporate Financial Performance (CFP) by examining empirical works which have been published in the last few years. The statistical technique of meta-analysis has been employed to operationalize the research. Meta-analysis, according to Hunter & Schmidt (1990), is based on empirical data out of articles published during the considered time frame. It allows for a more general and aggregate conclusion based on a cumulative set
of studies. It is consequently also possible to analyze the data as a whole, avoiding possible distortions posed by the research tools of the original works.
It focuses on the CSP/CFP relation and aims to contribute to the field by attempting to understand its nature not only by analyzing it at the proxy level but also by exploring the indicators which represent it.
Regardless of the theoretical importance of debating the CSP/CFP relation and of analyzing several related empirical works, this study aims for a methodological contribution. There are few statistical meta-analysis studies on the CSP/CFP relation. This paper also aims to present its analytical method in a “step-by-step”, didactic and replicable manner so that it may be readily used in future studies in the field.
2 Theoretical background
The subject matter of this paper deals with the relation between Corporate Social Performance (CSP) and Corporate Financial Performance (CFP), constructs which insert into concepts of corporate social responsibility (CSR), of the stakeholder theory and of the theory of the firm. The following exploration aims to present the relations among the concepts of CSR, CSP and CFP in the context of the aforementioned theories. The explanation of the intertwining between CSP and CSR is particularly justified, for both may associate to the objective function of the stakeholder theory which coordinates the stakeholders’ interest. It should be observed that several analyzed empirical papers did not make this association explicit due to different research targets between our work and theirs.
2.1 Corporate Social Responsibility – CSR
As presented by Whetten et al. (2002), corporate social responsibility from the 50’s on has developed through naïve actions implemented by organizations before there was a structuring of the process in which professionals were hired to deal with specific environmental, community, client, and employee-related issues. In 1971, Mazis & Green (1971), in an article focused on corporate social responsibility, suggested the creation of committees within company management comprised of managers and department representatives experienced in social issues. By doing so it became clear that many organizations were effectively starting to manage specific aspects related to corporate social responsibility.
stakeholders’ interests and of the objective function of stakeholders’ theory, as much as in empirical research which modeled a CSR variable.
2.3 Stakeholder theory
The stakeholder theory (Freeman, 1984) emerged in the 80’s not in the shape of a theory, but as a usual concept to convey the need to manage relationships among people or group of people in organizations concerned with social issues, and not necessarily with economic themes identified by the strategy field as in Porter (1980). In the 90’s, however, the stakeholder concept moves towards a more thorough theory and becomes an important technical reference in this research field (Whetten et al., 2002).
According to Frooman (1999), the main reference of this theory is found in the work of Freeman in 1984. Coombs & Gilley (2005) state that the most employed definition of stakeholder in the literature is also that of Freeman (1984), which poses that stakeholder means any individual or group that might affect the meeting of organizational goals or which is affected by the pursuit of such goals. From the viewpoint of the stakeholder theory, the goal of a company, according to Evan & Freeman (1993, p. 170), “[…] is to serve as vehicle for coordinating stakeholders’ interests.”
The management of relationships with stakeholders is seen as being conceptually more powerful for studies of organizational actions within the social context than for the approach of social themes (Clarkson, 1995). Whetten et al. (2002) suggest that quality of relationships with a primary (economic) and secondary (social) set of stakeholders may indeed be synonymous with quality of management. These authors therefore refer to previous works such as Clarkson’s (1995), Waddock & Graves’s (1997), and Wood & Jones’s (1995), which suggest that the stakeholder theory provides a suitably understandable and accessible CSP base. Wood & Jones (1995) note that stakeholders make use of three fundamental CSP responsibility of producing goods and services which
cater to the needs of society and whose sale should generate profit to the company. Legal responsibility points to the contractual aspects between parties which should be enforced. Ethical responsibility encompasses norms and behaviors which are not necessarily covered by legal aspects, but that all parties involved should nevertheless equally abide by. And discretionary responsibility points to voluntary actions fostered by managers and which are not always understood by society.
Empirical studies which seek to evaluate CSR performance usually do it by defining CSR as a proxy dependent on variables related to a wide range of stakeholders, such as employees, clients, investors, suppliers, community and environment. Examples may be observed in the works of Mishra & Suar (2010), Chih et al. (2010), Fauzi & Idris (2009), and Lougee & Wallace (2008). It is possible consequently to associate the CSR variable in these papers to the addressing of the objective function of stakeholder theory.
2.2 Corporate Social Performance - CSP
Besides defining CSR, Carroll (1979) articulates the process of social responsiveness and the “outcome” dimension to integrate them into a CSP model, thus seeking to respond to conceptual demands which support the practice of social responsibility. That model proposes what an effective performance in the field demands from managers: identification of the themes proposed to the organization; the reflection brought about by this type of social responsibilities; the choice of the way in which responsiveness will be established (reactive; defensive; accommodating; proactive), and the type of result expected. This proposal supports several subsequent works as we shall see.
Wood (1991, 2010) sets a model based on that of Carroll’s (1979), further widened by the incorporation of other works which also sought to delineate CSP. His proposal is represented in Chart 1.
Wood argues that, in order to evaluate CSP, the research may examine to what extent the principles of social responsibility motivate the company’s actions of interest; to what degree companies employ responsive processes; which the nature of policies and programs related to societal relationships designed by company management is; and (observable) impacts generated by such actions, programs and policies.
By analyzing the way empirical studies shape the CSP variable, it is generally observed that it is defined as a proxy associated to variables linked to several stakeholders. This can be seen for instance in the works of Lee et al. (2009), Callan & Thomas (2009), and Mahoney et al. (2008). This CSP variable is in this sense also a measure of coordination of
Chart 1. Corporate Social Performance model.
Principles of Corporate Social Responsibility Institutional Principle: Legitimacy
Organizational Principles: Public Responsibility Individual Principle: Managerial Discretion
Processes of Corporate Social Responsiveness Environmental Evaluation
Stakeholder Management Management of Themes
Outcomes of Corporate Behavior Social Impact
Social Programs Social Policy
the second one (accounting measurements) captures the idea of the internal efficiency of the company, and the third one (‘survey’) provides a subjective estimate of its financial performance.
2.5 Relations between CSP and CFP
The literature points to three possibilities of association between social and financial performance: positive, negative and neutral. The first one is supported by the stakeholder theory; the second by the theory of the firm; and the third by scholars who understand that the relation is not confirmed.
The positive relation is supported by scholars from the stakeholder theory (Bird et al., 2007). That is Barnett (2007) view, who affirms that there is already a substantial theoretical grounding to explain that an increase in CSP promotes increase in CFP, as Jones (1995) explains: companies which develop relationships of mutual trust and cooperation with stakeholders obtain competitive advantage over those who do not.
On the other hand, the negative relation is defended by scholars from the neoclassical economic viewpoint. This line of thought may be observed in Aupperle et al. (1985), to whom any investment that fosters CSP will put the company to disadvantage and will cause worse financial performances. This concept had been previously postulated by Friedman (1970), and states that there are few economic benefits to a socially-responsible behavior, while there are simultaneously many costs associated to it.
The third position is the absence of the relation between CSP and CFP. Such proposal was initially placed by Ullmann (1985) and argues that there are so many factors or variables influencing the relation between CSP and CFP that, even if it hypothetically existed, it might not be detected due to measurement issues within the empirical research.
Many empirical studies are presently being developed and the results on the CSP/CFP relation still vary. In other words, the verified CSP/CFP relations exhibit positive, neutral or negative correlation.
2.6 CSR, CSP and CFP measurement indicators
A few researchers have dedicated themselves to developing concepts to build CSR, CSP and CFP indicators. Hopkins (1997), based on the CSP model developed by Wood (1991), proposes indicators which serve those three dimensions related to that model: principles, social responsibility processes (responsiveness) and outcomes (internal and external effects on stakeholders and external institutional effects). Clarkson (1995), in turn, proposes associating such indicators to stakeholder management-linked rules: they are sources of CSP propositions, they are
affected by the actions of organizations, and they evolve as companies address CSP principles.
Summarizing it, the description of stakeholders proposed by Freeman (1984) associates to the principles, processes and themes which comprise the CSP model proposed by Wood (1991) and reedited by Wood (2010). Therefore, as Clarkson (1995) proposes, stakeholders themselves form a subset of actors who constitute society but who possess as distinctive attributes the power to influence and be influenced by the company.
2.4 Theory of the firm and Corporate Financial Performance – CFP
The inception of Economic Science in the 18th
century out of the work of Adam Smith on the origins of the wealth of nations is the groundwork of the origin of the theory of the firm. Many works in the 20th century, especially that of Coase (1937) on
transaction costs, have enriched and further developed the Theory of the Firm.
For the present paper the definition of objective function of the theory of the firm and its association with the concept of corporate financial performance (CFP) are particularly relevant. One should note that the theory of the firm sets maximization of profit as its goal as do all other microeconomic theories. However, profit maximization requires a more specific definition, whether from an accounting or economic perspective, short-term or long-term, among other characteristics. Jensen (2001) points out that the goal of the firm for the economist should seek to maximize long-term value, which results from its ability to generate cash along time.
Corporate Financial Performance (CFP) relates to the variance of the company´s value despite the several ways to define that value. The association between CFP and the theory of the firm takes place due to the firm´s goals. Once a firm’s goal is the maximization of its value in a theoretical light, CFP is thus a way to measure such valuation. The company’s value might be associated to different parameters, such as equity value (or book value), market value or long-term value (net present value), and CFP presents variances in its metrics linked to such concepts.
correlation coefficient among the variables of interest. By eliminating those articles which do not contain the correlation coefficient, the remaining ones will comprise the meta-analysis sample.
By assuming that the correlation coefficients of the relation of interest suffer the influence of artifacts created by the scholar, it is necessary to eliminate distortions associated to such artifacts (Hunter & Schmidt, 1990) so that the coefficients may be employed in a cumulative manner. Hunter & Schmidt (1990) identify the following artifacts: (1) sampling error which increases as size of studied sample decreases; (2) measurement sampling errors due to the use of non-reliable construct representative variables; (3) sampling range that does not reflect population traits and therefore introduces bias; (4) typing and data-processing errors; (5) measurement contamination and deficiency; and (6) differences between measurement alternatives of a specific construct. Based on a long observation and analysis time frame, Hunter & Schmidt (1990) have estimated that 72% of the observed variance among studies arose from the products of the first three artifacts. Hunter & Schmidt (1990) thus develop meta-analysis out of calculations which attempt to eliminate the sampling mistake. The resulting outcomes of this process are then sufficiently powerful to support conclusions which cumulatively arise from research on a relation of interest.
Once in possession of article samples containing the correlation coefficient of the relation of interest, Hunter & Schmidt (1990) propose four steps of calculation and analysis: (1) calculation of average correlation in the sample; (2) calculation of observed variance of correlation in the sample and of variance due to sampling error; (3) correction of population variance by subtracting sampling error variance for estimate of total correlation; (4) analysis of existence of moderating effects in order to create subgroups enabling the identification of contextual aspects which influence the relation of interest.
3.1.1 Estimate of average correlation and of variance
The weighted average correlation of the article sample is obtained from Equation 1.
( i* )i
i
N r
r
N
=
∑
∑
(1)Where N is the number of sample elements in the considered study and r is the correlation coefficient among variables of interest obtained in the study.
This equation provides an accurate estimate of measurement for the population correlation coefficient, once studies of larger samples are less subject to sampling error (Stevenson, 1981).
themes, which fall into six broad groups: company, employees, shareholders, clients, suppliers, and public stakeholders (environment, community, energy, charity).
Regarding CPF indicators, there are authors who suggest employing CPF metrics separately, as Lee et al. (2009), who have applied separate tests for accounting and market measurements. Others have additionally employed ROA, ROE and ROI indicators to measure financial performance in a complementary manner, as Waddock & Graves (1997).
The relation between CSP and CFP has been the object of empirical research for at least 20 years. According to studies by Boaventura et al. (2012), CSP dimension is a proxy which aggregates indicators representing several stakeholders: employee, community, client, supplier and investor. It is a proxy which also aggregates several financial indicators: ROA (Return on Asset), ROE (Return on Equity), ROI (Return on Investment), paid dividends, cumulative return, Tobin’s Q.
This research will operationally focus on a few measurable variables which characterize CSP and CFP. For CSP, those variables relate to stakeholders: employees, clients, environment, community; for CFP, those variables are ROA, ROE and ROI.
3. Research methodology
3.1 Meta-analysis
Meta-analysis was developed in the 70’s by Hunter, Schmidt and Glass. Glass (1976) has initially divulged it whereas Hunter and Schmidt’s proposal was only published in 1982. The three authors have published their entire work in Hunter & Schmidt (1990).
Meta-analysis is the analysis of the analysis of empirical research: a methodology which quantitatively accumulates and integrates results of previous empirical works (Gooding & Wagner, 1985).
• H3.2: There is a moderating variable affecting relations between variables that represent each stakeholder and CFP.
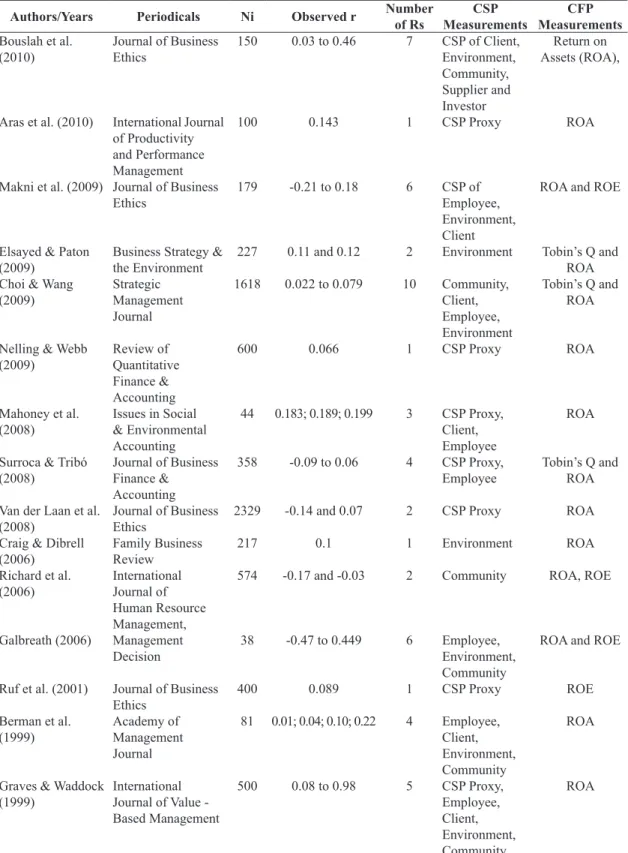
We have adopted the time frame from 1998 to 2010 in which the empirical articles were published in order to develop the meta-analysis. The following procedures were taken when sampling the articles: choice of keywords; choice of database; files with articles that could serve as empirical articles; selection of articles presenting the correlation coefficient among variables of the CSP/CFP relation, including the dimensions which comprise each of those proxies. The following search keywords were utilized in order to identify those articles: financial performance and corporate social performance. The utilized databases were Proquest, Ebsco and ISI. Those articles labeled with these keywords were then codified (CODE) to form the analyzed sample. The articles of interest are those which analyze the CSP/CFP at the corporate level. Initially there were 58 articles with empirical results presenting statistical data treatment, whether primary or secondary. In order to enable that analysis the correlation coefficients were labeled as follows, allowing the identification of the relation to which they refer: CSP-ROA, CSP-ROE, CSP-ROS, Employee-ROA, Client-ROA, Environment-ROA, Community-ROA. The end result is a sample of 15 articles listed in Table 1.
Although the research time frame is between 1998 and 2010, Table 1 includes articles between 1999 and 2010. That relates to the fact that articles from previous dates did not show any correlation coefficient of any CSP/CFP pair of interest. Table 1 also features three articles which supply correlation coefficients between CSP and Tobin’s Q. However, the three supplied correlation coefficients measure associations with different CSP indicators and thus it was not possible to employ meta-analysis for the CSP/Tobin’s Q relation.
3.2.1 Obtained results
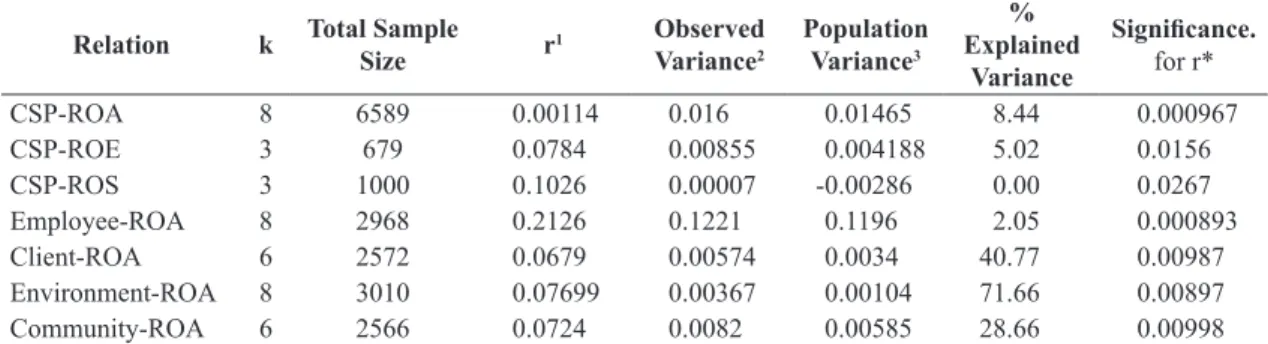
By applying the data treatment method proposed by Hunter & Schmidt (1990), the following results in Table 2 were obtained:
The value of k represents the number of studies considered for the establishment of the r aggregate value and its respective variances. Sample size is the result of the sum of all samples in every empirical study. R is the weighted average correlation coefficient obtained from correlation coefficients in every study. The observed variance is the calculated variance having as reference the average correlation coefficient and the respective correlation in each of the analyzed studies. Residual variance is the population variance, which by concept In order to calculate the observed variance
(σr2) among individual correlation coefficients in the studies, Hunter & Schmidt (1990) propose the use of weighted quadratic mean of error by the new sample size according to Equation 2.
2 2 ( i* (i ) ) r
i
N r r
N
σ =
∑
−∑
(2)Hunter & Schmidt (1990) argue that the best estimate of population variance is not the observed variance, but the observed variance minus the estimated variance due to sampling error instead. It is thus necessary to calculate the estimated variance due to sampling error according to Equation 3:
2 2 2 (1 ) *
e
i
r k
N
σ = −
∑
(3)In Equation 3 k represents the number of studies considered for the calculation of the average correlation coefficient.
It is thus enough to subtract the result obtained in Equation 3 from the result obtained in Equation 2 in order to calculate population variance. Population variance is also named residual variance, for it signals the existence of moderating effects which affect the relation of interest (Hunter & Schmidt, 1990) in cases where it does not reach zero (or approximately zero).
3.2 Research by meta-analysis
The research questions which guided our search for articles are: “Does the prevalence of the positive relation between CSF and CFP still hold in more recent research work?” and “Which variables of which stakeholders are more associated to the financial performance?”
The following hypotheses have been formulated based on the answers:
• H1: The CSP/CFP relation is positive in recent research.
• H2: Every stakeholder, represented by their variables, relates positively to financial performance.
Hunter & Schmidt (1990) suggest the establishment of a hypothesis admitting the possibility of a moderating variable associated with the research context. The following hypotheses H3.1 and H3.2 have thus been established as follows:
Table 1. Sample of articles analyzed by CSP/CFP. Meta-Analysis.
Authors/Years Periodicals Ni Observed r Number
of Rs
CSP Measurements
CFP Measurements Bouslah et al.
(2010) Journal of Business Ethics 150 0.03 to 0.46 7 CSP of Client, Environment, Community, Supplier and Investor
Return on Assets (ROA),
Aras et al. (2010) International Journal of Productivity and Performance Management
100 0.143 1 CSP Proxy ROA
Makni et al. (2009) Journal of Business
Ethics 179 -0.21 to 0.18 6 CSP of Employee,
Environment, Client
ROA and ROE
Elsayed & Paton
(2009) Business Strategy & the Environment 227 0.11 and 0.12 2 Environment Tobin’s Q and ROA Choi & Wang
(2009) Strategic Management Journal
1618 0.022 to 0.079 10 Community, Client, Employee, Environment
Tobin’s Q and ROA
Nelling & Webb
(2009) Review of Quantitative Finance & Accounting
600 0.066 1 CSP Proxy ROA
Mahoney et al.
(2008) Issues in Social & Environmental Accounting
44 0.183; 0.189; 0.199 3 CSP Proxy, Client, Employee
ROA
Surroca & Tribó
(2008) Journal of Business Finance & Accounting
358 -0.09 to 0.06 4 CSP Proxy,
Employee Tobin’s Q and ROA
Van der Laan et al.
(2008) Journal of Business Ethics 2329 -0.14 and 0.07 2 CSP Proxy ROA Craig & Dibrell
(2006) Family Business Review 217 0.1 1 Environment ROA
Richard et al.
(2006) International Journal of Human Resource Management,
574 -0.17 and -0.03 2 Community ROA, ROE
Galbreath (2006) Management Decision
38 -0.47 to 0.449 6 Employee,
Environment, Community
ROA and ROE
Ruf et al. (2001) Journal of Business
Ethics 400 0.089 1 CSP Proxy ROE
Berman et al.
(1999) Academy of Management Journal
81 0.01; 0.04; 0.10; 0.22 4 Employee, Client, Environment, Community
ROA
Graves & Waddock
(1999) International Journal of Value - Based Management
500 0.08 to 0.98 5 CSP Proxy,
Employee, Client, Environment, Community
ROA
should be zero, whereas the explained variance is the variance deriving from a sampling error (artifact 1).
The results featured in Tables 1 and 2 (as follows) were submitted to a bias evaluation as proposed by
the existence of moderating variables that influence the coefficient. It is thus necessary to subdivide the sample that comprises this relation.
The set of 8 articles representing the Employee-ROA relation was then subdivided into 2 groups: ROA 1 with 3 articles and ROA 2 with 4 articles, while one article was dismissed. The subsequent analysis is shown in Table 3.
Table 3 shows that one subgroup is comprised of small correlations (ROA 1) whereas the other is comprised of significant correlations (ROA 2).
Both subgroups do not contain the article of Graves & Waddock (1999), which presented a correlation coefficient of 0.98 between Employee/ROA. The article purposely explores that relation in the presence of bias, due to the use of companies listed in Fortune magazine’s “America’s Most Admired Corporations” in the sample. Furthermore, the total (average) financial return of 10 years proposed by Fortune magazine was used as financial dimension, unlike other sample articles for the mentioned relation. It was thus expected that the Employee-ROA relation showed high correlation and confirmed the results.
After the subdivision of the initial sample related to the Employee-ROA relation, it was possible to identify one group in which the relation is neutral (r= 0.054618) and another in which the r value equals 0.233125. In the former group the variance at 41.01% is explained by a sampling error, whereas in the latter the population variance is zero and does not exhibit any variance related to sampling error. By employing his proposal, a total of 75 studies was
needed to substantially alter the shown result for the CSP/ROS relation as stated in Table 1. For the remaining relations that number of studies was over 75, thus confirming the meaningfulness of the results.
From calculations on the data of sampled articles it was possible to conclude that the CSP-ROA, CSP-ROE, Client-ROA, Environment-ROA and Community-ROA relations present a neutral relation and therefore there is no confirmation of a positive one. Respective variances observed for these relations are near zero and that reaffirms their neutrality, although that might be due to a sampling error. That is exemplified by the CSP-ROE relation, that shows variance due to sampling error, which explains variability at 51.02% of the associated r (0.0784). The same applies to the Environment-ROA relation, which shows a variance that explains the associated r variability (0.07699) at 71.66%. Although further research dealing with such relations shall be carried out, neutrality is the expected outcome, i.e., the dimensions that comprise these relations are not directly correlated for significance levels of 0.05 < p (or lower).
The CSP-ROS relation presents a small correlation (0.102) and it is a result which initially is not affected by moderating variables for the populational variance is zero with a significance level of 0.05 < p.
The Employee-ROA relation presents a correlation coefficient of 0.2126 which is small but still with some significance. Furthermore, the population variance is not much different from zero (0.1196), pointing to
Table 2. Results obtained by Meta-Analysis between Relations of Interest.
Relation k Total Sample
Size r
1 Observed
Variance2
Population Variance3
% Explained
Variance
Significance. for r*
CSP-ROA 8 6589 0.00114 0.016 0.01465 8.44 0.000967
CSP-ROE 3 679 0.0784 0.00855 0.004188 5.02 0.0156
CSP-ROS 3 1000 0.1026 0.00007 -0.00286 0.00 0.0267
Employee-ROA 8 2968 0.2126 0.1221 0.1196 2.05 0.000893
Client-ROA 6 2572 0.0679 0.00574 0.0034 40.77 0.00987
Environment-ROA 8 3010 0.07699 0.00367 0.00104 71.66 0.00897
Community-ROA 6 2566 0.0724 0.0082 0.00585 28.66 0.00998
1Calculated by utilizing Equation 1; 2Calculated by utilizing Equation 2; 3Calculated by measuring the difference between 2 and 3.
*Rosenthal’s (1979) calculation method was employed. Source: the Authors.
Table 3. Results of Meta-Analysis for Employee-ROA Subgroups.
Relation k Total Sample
Size r
Observed Variance
Population Variance
% Explained
Variance
Significance for r
Employee-ROA 1 3 3665 0.054618 0.001984 0.00117 41.01 0.00896
Employee-ROA 2 4 718 0.233125 0.001061 -0.00392 0.00 0.00899
thus confirming the existence of a relation between Employee and ROA. In other words, addressing the interests of Employees relates to the ROA financial performance.
The hypothesis 1 was then partially refuted as the respective relations between CSP/CFP dimensions generally did not show any positive relation, but instead a neutral one. Only the CSP-ROS relation showed r = 0.102 with a statistical significance level of 0.05 < p. It may not be categorically affirmed that the CSP/CFP relation still holds positive in recent studies. The same is valid for H2, i.e., one cannot categorically affirm that the relation is positive between every stakeholder and CFP, as only the Employee-ROA relation shows that positive relation.
To those hypotheses exhibiting the moderating variable, the hypothesis H3.1 has not been confirmed, i.e., the existence of a moderating variable in the CSP/CFP relation has not been verified, whereas hypothesis H3.2 was partially confirmed, as the existence of moderation in the Employee-ROA relation has been found.
3.2.2 Practical and theoretical implications
The results obtained by meta-analysis generate diverse implications, as follows: the way the research was conducted strengthens the collected data whereas the results reinforce the theoretical aspects related to the CSP/CFP relation. There is mutual reinforcement, in other words.
The employed meta-analysis has strengthened some conditions of data collection, which strictly respected the statistical randomness of the sampled articles and the representation of the population of interest within the sample, as well as the employment of data collection tools which respect the conceptual constructs of interest. A few of these relations exhibit high levels of variance due to research artifacts. Efforts must be made in order to diminish interference of that nature.
Meta-analysis has also showed differences in the CSP/CFP relation regarding stakeholders’ management. Among the relations analyzed by the CSP proxy, the only one which presented positive relation was the CSP-ROS, whereas the others (CSP-ROA, CSP-ROE) presented a neutral relation. All of them presented acceptable levels of statistical significance. The orientation that companies should invest in CSP in order to enhance their CFP should thus be seen with caution, for the final result may not be confirmed, due to its depending on the type of targeted financial result.
Regarding dimensions (Community, Employee, Client, Environment and financial performance The three articles which supplied the r calculation
for the subgroup 1 (Employee-ROA 1) possess context peculiarities of notice and point diverse moderating variables that interfered in the obtained result for the correlation coefficient. Makni et al. (2009) have obtained a correlation coefficient of 0.09 for this relation by using a sample comprised of small-sized Canadian companies. The authors additionally argue that such companies need governmental support to promote investments in CSP dimensions. In order to compose their study sample, Choi & Wang (2009) establish two groups of interest, one with ROA above the industry average, and another with ROA below it. As both subgroups were consolidated in order to determine correlation coefficients, the r value thus tended to zero. Finally, Surroca & Tribó (2008) measure the “employee” dimension through a proxy that represents its satisfaction and that is comprised of 37 indicators covering diverse company aspects involving employee-linked themes. It is a measurement which represents the employee’s perception of the management system as a whole.
What may be concluded is that diverse moderating variables have interfered in the Employee-ROA relation. Therefore Subgroup 1 should be separately handled and should not be added to subgroup 2 (Employee-ROA 2).
which furthermore present that method in a didactic and replicable manner. The present paper contributes to the literature on the subject by disclosing step-by-step the way in which the technique might be employed for this goal, therefore being useful for scholars interested in further research.
The implications of these results contribute to the advancement of the stakeholder theory by pointing to the existence of a non-linear CSP/CFP relation at least in terms of specific variables that comprise both proxies.
It is therefore also necessary to investigate the micro foundations of the CSP/CFP relation, especially those in the instrumental stakeholder theory. It is necessary to give second thoughts to the linear relation between both proxies. Analyzing non-linear relations generates new perspectives to the instrumental stakeholder theory for it removes the simplistic way in which the CSP/CFP relation has been treated so far.
The CSP-ROS relation was shown to be slightly correlated and this should inspire us to effectively identify which CSP variables correlate to the ROS, since the CSP proxy results from a mathematical equation that weights its own variables. It is therefore essential that new research explore the nature of each variable chosen to represent each stakeholder in the equation that generates the CSP calculation.
The Employee-ROA relation, which showed positive correlation, indicates that the bottom-up perspective has intrinsic relevance concerning effects of elaboration and implementation of production strategy, for it may incorporate demands from operational-level collaborators and, once these have been addressed, it is likely that a better ROA performance might result. Further inquiries into this relation might confirm whether or not there is a causal relation between Employee and ROA, reinforcing the need to recognize a virtuous circle linking the addressing of collaborators´ interests (operational performance), the addressing of clients’ interests (financial performance) and once again the addressing of collaborators’ interests.
References
Aras, G., Aybars, A., & Kutlu, O. (2010). Managing corporate performance: investigating the relationship between corporate social responsibility and financial performance in emerging markets. International Journal of Productivity and Performance Management, 59(3), 229-254. http://dx.doi.org/10.1108/17410401011023573. Aupperle, K. E., Carrol, A. B., & Hatfield, J. D. (1985).
An empirical examination of the relationship between corporate social responsibility and profitability. Academy of Management Journal, 28(2), 446-463. measurements), the verified differences highlight
the Employee-ROA relation which presents positive correlation whereas the other relations show neutrality. This relation stands out even further when analyses of “The Most Admired Corporations” are carried out. As consequence the practical guideline of investing in employees in order to generate financial results may constitute an assertive guideline linked to the Employee dimension within all CSP dimensions.
Regarding the stakeholder instrumental theory, CSP/CFP neutrality relations reinforce the need to set a different conceptual approach logic to be utilized in empirical research. The rebuilding of the causal CSP/CFP relation is thus required. One proposal is to develop non-linear relations between these two proxies. The same might apply to other relations: Community-ROA, Client-ROA, Environment-ROA, among others. The absence of a CSP/CFP correlation does not mean that both are not related; it simply shows that a linear relation is not evidenced. That might be even due to the interference of several variables.
4 Conclusion
The general research issue on the positiveness of the CSP/CFP relation was measured by employing meta-analysis. Results point to a neutral CSP/CFP relation both in general and specific terms, with a few exceptions. There is no generalization of a positive CSP/CFP relation, whereas the CSP-ROS relation has shown to be (slightly) positively correlated in specific contexts. Client-ROA, Community-ROA and Environment-ROA relations remained neutral.
An important consideration is that the Employee-ROA relation is shown as positive within a subgroup in which data collection was more strictly enforced. These results show that even in the presence of a more rigorous analysis the relation still held, that is, they show an association between the organizational performance of the employee and the respective financial performance of the company. Within a second subgroup that relation remained neutral due to reasons which justify the results, either because the research was comprised of small-sized companies with limited resources to invest in CSP dimensions, or because the study aimed to compare high-performance and low-performance companies. And when the study focused on “the Most Admired Corporations”, the Employee-ROA relation showed a high correlation coefficient, surmising that it is possible to consider the presence of causality among variables which define the relation.
Coombs, J. E., & Gilley, K. M. (2005). Stakeholder management as predictor of CEO compensation: main effects and interaction with financial performance. Strategic Management Journal, 26(9), 827-840. http://dx.doi.org/10.1002/smj.476.
Craig, J., & Dibrell, C. (2006). The natural environment, innovation, and firm performance: a comparative study. Family Business Review, 19(4), 275-288. http://dx.doi.org/10.1111/j.1741-6248.2006.00075.x. Elsayed, K., & Paton, D. (2009). The impact of financial
performance on environmental policy: does firm life cycle matter? Business Strategy and the Environment, 18(6), 397-413. http://dx.doi.org/10.1002/bse.608. Evan, W. M., & Freeman, R. E. (1993). A stakeholder
theory of the modern corporation: Katian capitalism. In T. Donaldson & P. H. Werhane (Eds.), Ethical issues in business (pp. 166-171). Englewood Cliffs: Prentice-Hall.
Fauzi, H., & Idris, K. M. (2009). The relationship of CSR and financial performance: new evidence from Indonesian companies. Issues in Social and Environmental Accounting, 3(1), 66-87. http://dx.doi. org/10.22164/isea.v3i1.38.
Freeman, R. E. (1984). Strategic management: a stakeholder approach. Miane: Pitman.
Friedman, M. (1970). The social responsibility of business is to increase its profits. New York Times Magazine, 33-35.
Frooman, J. (1999). Stakeholder influences strategies. Academy of Management Review, 24(2), 191-205. http://dx.doi.org/10.5465/amr.1999.1893928. Galbreath, J. (2006). Does primary stakeholder management
positively affect the bottom line? Some evidence from Australia. Management Decision, 44(8), 1106-1121. http://dx.doi.org/10.1108/00251740610690649. Glass, G. V. (1976). Primary, secondary and
meta-analysis of research. Educational Researcher, 5(10), 3-8. http://dx.doi.org/10.3102/0013189X005010003. Gooding, R. Z., & Wagner, J. A., 3rd. (1985). A meta-analytic review of the relationship between size and performance: The productivity efficiency of organizations and their subunits. Administrative Science Quarterly, 30(4), 462-481. http://dx.doi. org/10.2307/2392692.
Graves, S. B., & Waddock, S. A. (1999). A look at the financial-social performance nexus when quality of management is held constant. International Journal of Value-Based Management, 12(1), 87-99. http:// dx.doi.org/10.1023/A:1007770406555.
Hayes, R. H., & Wheelwright, S. C. (1984). Restoring our competitive edge. Nova Iorque: John Wiley. Barnett, M. L. (2007). Stakeholder influence capacity and
the variability of financial returns to corporate social respons. Academy of Management Review, 32(3), 794-816. http://dx.doi.org/10.5465/amr.2007.25275520. Berman, S. L., Wicks, A. C., Kotha, S., & Jones, T. M.
(1999). Look at the financial-social performance nexus when quality of management is held constant. Academy of Management Journal, 42(5), 488-506. Bird, R., Hall, D. A., Momentè, F., & Reggiani, F. (2007).
What corporate social activities are valued by the market? Journal of Business Ethics, 76(2), 189-206. http://dx.doi.org/10.1007/s10551-006-9268-1. Boaventura, J. M. G., Silva, R. S., & Bandeira-de-Mello,
R. (2012). Performance financeira corporativa e performance social corporativa: desenvolvimento metodológico e contribuição teórica dos estudos empíricos. Revista Contabilidade & Finanças, 23(60), 232-245. http://dx.doi.org/10.1590/S1519-70772012000300008.
Bouslah, K., Zali, B., Turcotte, M. F., & Kooli, M. (2010). The impact of forest certification on firm financial performance in Canada and the U.S. Journal of Business Ethics, 96(4), 551-572.
Callan, S. J., & Thomas, J. M. (2009). Corporate financial performance and corporate social performance. Corporate Social Responsibility and Environmental Management, 16(2), 61-78. http://dx.doi.org/10.1002/ csr.182.
Carroll, A. (1979). A three-dimensional model of corporate performance. Academy of Management Review, 4(4), 497-505. http://dx.doi.org/10.5465/ amr.1979.4498296.
Chih, H.-L., Chih, H.-H., & Chen, T.-Y. (2010). On the determinants of corporate social responsibility: international evidence on the financial industry. Journal of Business Ethics, 93(1), 115-135. http:// dx.doi.org/10.1007/s10551-009-0186-x.
Choi, J., & Wang, H. (2009). Stakeholder relations and the persistence of corporate financial performance. Strategic Management Journal, 30(4), 895-907. http://dx.doi.org/10.1002/smj.759.
Clarkson, M. B. E. (1995). A stakeholder framework for analyzing and evaluating corporate social performance. Academy of Management Review, 20(1), 92-117. http://dx.doi.org/10.5465/amr.1995.9503271994. Coase, R. H. (1937). The nature of the firm. Economica, 4(16),
386-405. http://dx.doi.org/10.1111/j.1468-0335.1937. tb00002.x.
Accounting, 32(2), 197-209. http://dx.doi.org/10.1007/ s11156-008-0090-y.
Orlitzky, M., Schmidt, F. L., & Rynes, S. L. (2003). Corporate social and financial performance: a meta-analysis. Organization Studies, 24(3), 403-441. http:// dx.doi.org/10.1177/0170840603024003910. Porter, M. E. (1980). Competitive strategy. New York:
Free Press.
Richard, O. C., Ford, D., & Ismail, K. (2006). Exploring the performance effects of visible attribute diversity: the moderating role of span of control and organizational life cycle. International Journal of Human Resource Management, 17(12), 2091-2109. http://dx.doi. org/10.1080/09585190601000246.
Rosenthal, R. (1979). The File Drawer Problem and tolerance for nulls results. Psychological Bulletin, 86(3), 638-641. http://dx.doi.org/10.1037/0033-2909.86.3.638.
Ruf, B. M., Muralidhar, K., Brown, R. M., Janney, J. J., & Paul, K. (2001). An Empirical Investigation of the Relationship Between Change in Corporate Social Performance and Financial Performance: A Stakeholder Theory Perspective. Journal of Business Ethics, 32(2), 143-156. http://dx.doi. org/10.1023/A:1010786912118.
Slack, N., Chambers, S., & Johnston, R. (2002). Administração da produção. São Paulo: Atlas. Stevenson, W. J. (1981). Estatística aplicada à
administração. São Paulo: Harbra.
Surroca, J., & Tribó, J. A. (2008). Managerial entrenchment and corporate social performance. Journal of Business Finance & Accounting, 35(5), 748-789. http://dx.doi. org/10.1111/j.1468-5957.2008.02090.x.
Ullmann, A. A. (1985). Data in search of a theory: a critical examination of economic performance on U.S. firms. Academy of Management Review, 10(3), 540-557.
Van Beurden, P., & Gössling, T. (2008). The worth of values: a literature review on the relation between corporate social and financial performance. Journal of Business Ethics, 82(2), 407-424. http://dx.doi. org/10.1007/s10551-008-9894-x.
Van der Laan, G., Van Ees, H., & Van Witteloostuijn, A. (2008). Corporate social and financial performance: an extended stakeholder theory, and empirical test with accounting measures. Journal of Business Ethics, 79(3), 299-310. http://dx.doi.org/10.1007/ s10551-007-9398-0.
Waddock, S. A., & Graves, S. B. (1997). The corporate social performance-financial performance link. Strategic Management Journal, 18(4), 303-319. http://dx.doi. Hillman, P., & Keim, G. D. (2001). Stakeholder value,
stakeholder management, and social issues: what’s the bottom line? Strategic Management Journal, 22(2), 125-139. http://dx.doi.org/10.1002/1097-0266(200101)22:2<125::AID-SMJ150>3.0.CO;2-H. Hopkins, M. (1997). Defining indicators to assess socially
responsible enterprises. Futures, 29(7), 581-603. http://dx.doi.org/10.1016/S0016-3287(97)00034-7. Hunter, J. E., & Schmidt, F. L. (1990). Methods of meta-analysis: Correcting and bias in research findings. Londres: Sage.
Jensen, M. (2001). Value maximization, stakeholder theory, and the corporate objective function. Journal of Applied Corporate Finance, 14(3), 8-21. http:// dx.doi.org/10.1111/j.1745-6622.2001.tb00434.x. Jones, T. M. (1995). Instrumental stakeholder theory:
a synthesis of ethics and economics. Academy of Management Review, 20(2), 404-437. http://dx.doi. org/10.5465/amr.1995.9507312924.
Lee, D. D., Faff, R. W., & Langfield-Smith, K. (2009). Revisiting the vexing question: does superior corporate social performance lead to improved financial performance? Australian Journal of Management, 34(1), 21-49. http://dx.doi.org/10.1177/031289620903400103. Lougee, B., & Wallace, J. (2008). The corporate social
responsibility (CSR) trend. Journal of Applied Corporate Finance, 20(1), 96-108. http://dx.doi. org/10.1111/j.1745-6622.2008.00172.x.
Mahoney, L., LaGore, W., & Scazzero, J. A. (2008). Corporate social performance, financial performance for firms that restate earnings. Issues in Social and Environmental Accounting, 2(1), 104-130. http:// dx.doi.org/10.22164/isea.v2i1.27.
Makni, R., Francoeur, C., & Bellavance, F. (2009). Causality between corporate social performance and financial performance: Evidence from Canadian firms. Journal of Business Ethics, 89(3), 409-422. http:// dx.doi.org/10.1007/s10551-008-0007-7.
Margolis, J. D., & Walsh, J. P. (2003). Misery loves companies: rethinking social initiatives by business. Administrative Science Quarterly, 48(2), 268-305. http://dx.doi.org/10.2307/3556659.
Mazis, M., & Green, R. (1971). Implementing social responsibility. MSU Business Topics, 68-76. Mishra, S., & Suar, D. (2010). Does corporate social
responsibility influence firm performance of Indian companies? Journal of Business Ethics, 95(4), 571-601. http://dx.doi.org/10.1007/s10551-010-0441-1. Nelling, E., & Webb, E. (2009). Corporate social
org/10.1002/(SICI)1097-0266(199704)18:4<303::AID-SMJ869>3.0.CO;2-G.
Whetten, D. A., Rands, G., & Godfrey, P. (2002). What are the responsibilities to society? In: Pettigrew, A., Thomas, H., & Whittington, R. Handbook of strategy and management. Londres: Sage.
Wood, D. J. & Jones, R. (1995). Stakeholder mismatching: a theoretical problem in empirical research on corporate
social performance. The International Journal of Organizational Analysis, 3(3), 229-267.
Wood, D. J. (1991). Corporate social performance revisited. Academy of Management Review, 16(4), 691-718. http://dx.doi.org/10.5465/amr.1991.4279616. Wood, D. J. (2010). Measuring corporate social