DOI: 10.1590/1808-057x201804950
Original Article
Th
e infl uence of social disclosure on the relationship between
Corporate Financial Performance and Corporate Social
Performance*
Editinete André da Rocha Garcia
Universidade Federal do Ceará, Departamento de Contabilidade, Fortaleza, CE, Brazil Email: [email protected]
José Milton de Sousa-Filho
Universidade de Fortaleza, Programa de Pós-Graduação em Administração de Empresas, Fortaleza, CE, Brazil Email: [email protected]
João Maurício Gama Boaventura
Universidade de São Paulo, Faculdade de Economia, Administração e Contabilidade, Departamento de Administração, São Paulo, SP, Brazil Fundação Escola de Comércio Álvares Penteado, Departamento de Administração, São Paulo, SP, Brazil
Email: [email protected]
Received on 12.30.2016 – Desk acceptance on 01.27.2017 – 4th version approved on 11.07.2017 – Ahead of print on 02.15.2018
ABSTRACT
Th is study’s general objective is to investigate the moderating eff ect of Corporate Social Performance Disclosure (D-CSP) on the relationship between Corporate Social Performance (CSP) and Corporate Financial Performance (CFP). Based on this objective, the study presented a model in which D-CSP acts as a moderator in relation to primary stakeholders (employees, community, and suppliers). D-CSP is a mechanism through which the various social aspects involved in discretionary policies, actions, and activities identifi ed in the management for stakeholders process can be evaluated. A sample of 1,147 companies belonging to 10 diff erent sectors and fi ve continents was used to test the model. Data were collected from the Bloomberg database, totaling 5,735 observations, from 2010 to 2014. Th e relationship was tested using the multiple linear regression model involving panel data with fi xed eff ects, and the Newey-West robust standard errors correction. Th ree constructs, D-CSP, CSP, and CFP, were used to perform the tests. As a CSP measure, the CSP of the employee, supplier, and community stakeholders was used. As a D-CSP measure, the CSP disclosure scores available from the database were used, and return on assets (ROA) was used as a CFP measure. Th e tests carried out indicated the existence of a positive moderating eff ect of disclosure on the relationship between the CSP of primary stakeholders and CFP. Besides presenting a positive CSP in relation to the primary stakeholders the results enable it to be inferred that these results need to be disclosed, thus contributing to higher corporate fi nancial performance.
Keywords: Corporate Social Performance, Corporate Financial Performance, voluntary disclosure, stakeholder theory.
Correspondence address: Editinete André da Rocha Garcia
Universidade Federal do Ceará, Departamento de Contabilidade Avenida da Universidade, 2486 – CEP: 60020-180
1. INTRODUCTION
The social approach is identified as one of the accounting approaches that considers the accounting statements of social results (Iudícibus, Martins & Carvalho, 2005). In this approach, social disclosure is included as an important way of making the social actions of organizations transparent. Social disclosure serves as a company communication channel for social responsibility actions (Gonçalves, Medeiros, Niyama & Weff ort, 2013). National and international companies have implemented initiatives with the aim of obtaining a content of information to be disclosed in attending to the needs of stakeholders (Oliveira, De Luca, Ponte & Pontes, 2009).
Corporate Social Performance disclosure (D-CSP) has been a topic of studies since the 1970s, following studies on Corporate Social Performance (CSP). Th e initial studies focused on identifying the stage of CSP disclosure, its relationship with strategy, and a description, observation, and critical evaluation of disclosure practices (Bowman & Haire, 1976; Brockhoff , 1979; Dierkes, 1979; Guthrie & Parker, 1989; Preston, 1981; Schreuder, 1979; Ullmann, 1979). Th e studies subsequently addressed the relationship between disclosure and diff erent motivating factors, such as stakeholder power and pressure, culture, reputation, and corporate governance mechanisms, among others (Bayoud & Kavanagh, 2012; Mio, Venturelli & Leopizzi, 2015; Haji, 2012; Li, Luo, Wang & Wu, 2013; Van der Laan, Adhikari & Tondkar, 2005).
D-CSP is one of the ways for an organization to seek legitimacy in its actions and can be considered as an instrument for making social performance visible to stakeholders. As they are more visible, large companies use disclosure as a way of managing the perceptions of external stakeholders (Brammer & Pavelin, 2004).
In a broad approach, CSP considers the principles of social responsibility, responsiveness processes, and policies, programs, and results observed in organizations as they carry out their business (Wood, 1991). Companies geared towards Corporate Social Responsibility (CSR) will be rewarded in economic and fi nancial terms (Carroll, 2015). Despite the arguments that indicate a positive relationship between CSP and Corporate Financial Performance (CFP) and various empirical studies that support this positive relationship (Brammer & Millington, 2008; Isaksson & Woodside, 2016; Lu, Chau, Wang & Pan, 2014; Orlitzky, Schmidt & Rynes, 2003; Van Beurden & Gossling, 2008; Walsh, Weber & Margolis, 2003; Wang, Dou & Jia, 2015), it still lacks a full explanation; that is,
it is inconclusive.
Th is relationship between CSP and CFP, which has not yet been fully clarifi ed, characterizes a theoretical gap that this study proposes to investigate. It is precisely in this sense that recent studies seek to investigate this relationship more deeply and address specifi c factors that can moderate it (Chang, Oh & Messersmith, 2013; Hull & Rothenberg, 2008; Lee, Seo & Sharma, 2013; Peng & Yang, 2014; Tang, Hull & Rothenberg, 2012; Wang & Choi, 2013). Along these lines, this study discusses D-CSP as a factor that can intervene in the relationship between CSP and CFP, from the perspective of management for stakeholders as a result of the transparency of the social actions taken by companies. Management for stakeholders concerns value creation for stakeholders, observing the generation of positive reciprocity as a way of generating value for the company (Harrison, Bosse & Phillips, 2010).
It is understood that the effectiveness of the management of organizations should incorporate D-CSP into CSP, as a means of communication and form of accountability, thus obtaining higher fi nancial results. Based on this argument, the question is posed: what is the infl uence of CSP disclosure on the relationship between the CSP of primary stakeholders and CFP?
For research purposes, primary stakeholders were considered since they relate directly with the company through direct exchanges and a relationship of reciprocity (Van der Laan, Van Ees & Van Witteloostuijn, 2008). Clarkson (1995) considers that the primary stakeholders group is directly related to the survival of the company. CSP related to primary stakeholders (employees, investors, and clients) infl uences a company’s fi nancial performance. As an indication of the infl uence of disclosure on the relationship between the CSP of primary stakeholders and CFP, the studies have identifi ed that employees show a commitment to companies that have a good image in terms of human capital development (Dutton, Dukerich & Harquail, 1994).
CSR engagement, the trajectory of CSR engagement, and the relationship between the dimensions of CSR (Tang et al., 2012); high performance labor practices (Chang et al., 2013); economic conditions (Lee, Singal & Kang, 2013); consistency of CSP and intensity of research and development (Wang & Choi, 2013).
Th is study contributes to the most recent discussion on the existence of contingent factors that can moderate the CSP-CFP relationship, it examines the relationship based on stakeholder theory, according to the proposition from Wood and Jones (1995), and fi nally, it contributes to examining the relationship based on a breakdown of CSP in which the results are individualized by type of primary stakeholder – a strategy used in previous studies (Barnett & Salomon, 2006; Choi & Wang, 2009; Perrini, Russo, Tencati & Vurro, 2012).
From a practical point of view, the results can support managers’ decisions regarding the implantation of an internal process that leads to the disclosure of their social results.
Besides the Introduction, this study presents the Th eoretical Framework, Method, Results, and Conclusion. In the Th eoretical Framework, theoretical arguments are presented that explain the interference of D-CSP in the relationship between CSP and CFP, based on stakeholder theory. Th e Method section identifi es the variables used in the model, their operationalization, the characterization of the sample used in the study, and the statistical technique employed. Results presents the descriptive statistics and the results of the tests, in which the multiple linear regression model with panel data was used. Finally, the discussions and conclusions are presented.
2. THEORETICAL FRAMEWORK
2.1 Stakeholder Theory
Stakeholder theory is based on the idea that the object-function of an organization is not limited to generating profi t for shareholders, but also coordinating the interests of stakeholders (Evan & Freeman, 1993). Consequently, the survival of a company and its success depend on the capacity of its managers to create suffi cient wealth, value, or satisfaction to ensure that each group of primary stakeholders continues to be integral part of its system (Clarkson, 1995).
In conformity with this theory, a stakeholder is a party “that can aff ect or is aff ected by the carrying out of a company’s aims” (Freeman, 1984, p. 46). Stakeholders can be classifi ed as primary and secondary. Th e primary group of stakeholders is directly related to a company’s survival (Clarkson, 1995). It is composed of shareholders, employees, clients, suppliers, and public (government and communities). For Clarkson (1995), secondary stakeholders are those that infl uence or are infl uenced by companies, but that do not carry out operations with them and are not essential for their survival. Th e media, activist groups, and religious organizations are examples of secondary stakeholders (Clarkson, 1995; Eesley & Lenox, 2006).
Stakeholder theory is one of the main theories used to describe CSP and explain the way it is evaluated and managed (Bingham, Smith & Adams, 2011; Clarkson,
the normative aspect of the theory, since CSP addresses morals, ethics, and ethical obligations (Phillips, Freeman & Wicks, 2003). Clarkson (1995) proposes that CSP can be analyzed and evaluated more eff ectively using a framework based on the management of a company’s relationships with its stakeholders.
Stakeholder theory presents a logical explanation of the whys of CSP (Backhaus, Stone & Heiner, 2002). Wood and Jones (1995) consider that stakeholders assume at least three roles in relation to CSP: (i) they are sources of performance expectations; (ii) they are the target of company behavior, since they are the benefi ciaries of actions; and (iii) they evaluate how well companies meet expectations and/or how a company’s behavior directly aff ects them or has an infl uence on their environment. Th e theory is used to explain the relationship between management for stakeholders and CSP, and also between management for stakeholders and CFP (Laplume, Sonpar & Litz, 2008).
Cogotti, McCombes & Haeusler, 2012); and stakeholder management and social questions (Hillman & Keim, 2001). Harrison et al. (2010) use the term management for stakeholders instead of stakeholder management.
For the purposes of this research, stakeholder theory is the theoretical basis that indicates an understandable reason for companies to redirect their management for stakeholders activities, with a view to providing positive results for the organization and guaranteeing its continuity. Supported by the transparency of this management, materialized through D-CSP, companies have the potential chance to capture value and, consequently, present higher CFP.
2.2 Relationship between CSP and CFP
Since the 1980s, studies on CSP have been related to company ethics, corporate citizenship, sustainability, and management for stakeholders (Carroll, 2015).
In the broad sense, CSP is “a confi guration of the businesses of an organization based on the principles of social responsibility, responsiveness processes, and policies, programs, and observable results related to a company’s social actions” (Wood, 1991, p. 693).
From the perspective presented in this study, CSP represents the diff erent social aspects involved in the discretionary policies, actions, and activities identifi ed in the management for stakeholders.
Th e establishment of better relationships with the primary stakeholders, such as employees, clients, suppliers, and community, leads to the growth of shareholder wealth, helping companies to develop valuable intangible goods that can be sources of competitive advantage (Hillman & Keim, 2001). Th us, based on this argument, greater CSP leads to greater CFP.
Th e relationship between CSP and CFP has been the object of various studies for around 40 years. Th ese indicate four models: a positive linear relationship between CSP and CFP; a negative linear relationship between CSP and CFP; positive non-linear relationships between CSP and fi nancial performance; and negative non-linear relationships between CSP and CFP (Brammer & Millington, 2008).
Th e meta analysis developed and presented by Orlitzky et al. (2003) showed that: CSP and CFP are generally positively related in various contexts and industrial sectors; there is bidirectional causality between CSP and CFP; the results between CSP and CFP are stronger aft er the removal of environmental measures; and the results between CSP and CFP are more impacted when the studies correlate external measures of CSP (reputation or disclosures) and CFP (such as share returns or growth
of sales), confi rming the hypothesis that CSP helps to form a positive reputation and goodwill with external stakeholders.
Th e positive relationship between CSP and CFP is indicated in studies that use stakeholder theory as a theoretical approach (Baird, Geylani & Roberts, 2012; Wang et al., 2015). In these studies, the CSP from a previous period is associated with the CFP of the current period (Barnett & Salomon, 2012; Callan & Th omas, 2009; Choi, Kwak & Choe, 2010; Waddock & Graves, 1997; Wang et al., 2015). Th is causal relationship is coherent with what is proposed by good management theory (Waddock & Graves, 1997). According to this theory, companies that invest in RSC enjoy higher CFP as a result (Boaventura, da Silva & Bandeira-de-Mello, 2012).
Th e positive relationship between CSP and CFP is supported by stakeholder theory from an instrumental perspective (Wang et al., 2015). Th is approach is explained based on the connection of the eff ects of the management for stakeholders and the results achieved by organizations (Donaldson & Preston, 1995). A positive infl uence was shown in the study developed by Berman, Wicks, Kotha & Jones (1999). Th e authors verifi ed that the position of companies with regards to their primary stakeholders directly aff ects fi nancial performance, reinforcing the perspective of stakeholder theorists, who emphasize employee and client management as factors that infl uence fi nancial performance.
Various studies indicate that management for stakeholders leads to company differentiation, attractiveness, it draws investments, and produces intangible resources, helping the company to acquire a competitive advantage, among other things (Wang et al., 2015).
From the perspective that indicates positive results of management for stakeholders, diff erent positive results are identifi ed, including: employee commitment to a company that presents a good image in terms of human capital development (Dutton et al., 1994) and the attraction of job candidates (Backhaus et al., 2002; Greening & Turban, 2000); growth in shareholder wealth and the generation of a competitive advantage (Hillman & Keim, 2001); the clients may respond to CSP, increasing the demand for products or services or even increasing the value attributed to products or services (Bhattacharya & Sen, 2003).
Considering that by managing primary stakeholders companies will achieve their objectives, infl uencing the continuity of their businesses, it is suggested that:
H1: CSP related to primary stakeholders positively infl uences CFP.
2.3 Infl uence of D-CSP on the Relationship between CSP and CFP
Th e diff erent studies that have examined the relationship between CSP and CFP over the last decades have not indicated a conclusive relationship (Lu et al., 2014). Th is debate has not yet been resolved, partly because what may have appeared to be a direct relationship has proven to be complex (Hull & Rothenberg, 2008). Th e studies indicate that the relationship between CSP and CFP can vary as a result of various factors that potentially moderate or contextualize the relationship (Chang et al., 2013).
In light of this complexity, in recent years the authors have come to examine the relationship considering some contingent factors. Empirically, such factors have been included in the relationship in the form of moderators. Hull and Rothenberg (2008) verifi ed that the innovation and level of diff erentiation in the industry negatively moderate the relationship between CSP and CFP. Tang et al. (2012) verifi ed that consistency in the engagement, engagement trajectory, and relationships between the SCR dimensions positively moderate the relationship between CSP and CFP. Chang et al. (2013) identifi ed that high performance labor practices positively moderate the relationship between CSP and CFP. Lee et al. (2013) verifi ed that the economic conditions positively moderate the CSP-CFP relationship in economically unfavorable periods. Wang and Choi (2013) presented a result that identifi es that CSP consistency and intensity of research and development positively moderate the CSP-CFP relationship. Finally, more recently, Peng and Yang (2014) identifi ed that a high degree of shareholder concentration is a variable that negatively moderates the relationship between CSP and CFP. In this line of investigation, this study aims to verify whether disclosure is one of these
factors that can infl uence the relationship between CSP and CFP.
Disclosure is timelily making relevant information available that results in a transparent image of corporate operations, CFP, and corporate governance (Dawkins & Fraas, 2008). It can be considered the result of the transparency of organizations with relation to their different stakeholders, and an operationalization of the disclosure of useful information for these users’ decision-making process. Th is usefulness of disclosure for stakeholders is also highlighted by Dawkins and Fraas (2008). Disclosure also forms part of communication as a company strategy for maintaining legitimacy (Suchman, 1995).
For the purposes of testing the relationship between CSP and CFP moderated by D-CSP, from the perspective of stakeholder theory, D-CSP is the voluntary presentation of useful information to the various stakeholders resulting from the transparency of an entity’s CSP.
Voluntary disclosure can be considered as a support strategy linked to CSP and/or an alternative strategy for management for stakeholders (Ullmann, 1985). In fact, as CSP constitutes a measure that evaluates the performance of an organization in attending to the interests of its stakeholders (Boaventura et al., 2012), disclosure is a means by which stakeholders can evaluate CSP (Dawkins & Fraas, 2008), forming part of the dialogue between a company and its stakeholders (Roberts, 1992). In general, D-CSP can send a positive signal to stakeholders and, consequently, relevance is attributed to the value of the information disclosed by a company. In light of this, it is suggested that:
H2: D-CSP positively moderates the relationship between CSP related to the primary stakeholders and CFP.
Th e model is based on what is proposed by Baron and Kenny (1986) when they present the physical-operational structure of the moderation model.
3. METHOD
Th is research is classifi ed as descriptive and explanatory, in accordance with the typology taught by Vergara (1998). To test the assumed hypotheses, the quantitative method was used.
In order to carry out the statistical tests, secondary data collected from the Bloomberg database were used. Data from this database have been used in various previous studies and cover environmental, social, corporate governance, and D-CSP indicators, as well as fi nancial data (Chiu & Sharfman, 2011; Fernandez-Feijoo, Romero & Ruiz, 2014; Gitman, Chorn & Fargo, 2009; Halbritter & Dorfl eitner, 2015; Surroca & Tribó, 2008).
Th e 1,147 companies that compose the sample were chosen from all those that present data in the Bloomberg database, considering those that presented data for all the object variables of the research in order to avoid the absence of data. Th e companies chosen belong to diff erent countries from Asia Pacifi c (60.68%), Europe (24.41%), North America (9.76%), Latin America (2.26%), and Africa (2.53%). Th e percentage of companies from Asia Pacifi c is impacted by the predominance of Chinese and Japanese companies. Th e Chinese companies use CSP due to the need to gain legitimacy and remain competitive in the global market (Lau, Lu & Liang, 2016; Wang, Tong, Takeuchi & George, 2016). In addition to these factors, China is one of the countries with the most D-CSP regulations (Wang et al., 2016). Th e Japanese companies have given importance to CSR, with the adoption of various measures related to CSR policies, such as the introduction into their corporate structures of specifi c
departments for addressing this policy and the inclusion of statements related to it into their missions (Kato & Kodama, 2017).
The companies are identified in the database as belonging to the following sectors: Essential and Non-essential Consumer Goods, Energy, Industry, Materials, Utilities, Financial, Health, Information Technology, and Telecommunications. For the purposes of this study, these companies were grouped into Consumer Goods (23.54%), Industry (45.95%), and Services (30.51%), thus reducing the quantity of dummies.
The data are from 2010 to 2014, totaling 5,735 observations. Of this total, 112 observations were excluded referring to companies that indicated total community expenses equal to 0. This came about through the transformation of this variable, with the use of a base-10 logarithm, thus leading to this quantity of missing values. Based on the criteria of the Blocked Adaptive Computationally Effi cient Outlier Nominator(BACON) algorithm, proposed by Billor, Hadi, and Velleman (2000), and using the command developed to identify outliers for multivariate data (Weber 2010), 112 observations were identifi ed, in the 0.25 percentile, characterized as outliers. To carry out the test, the variables that presented a coeffi cient of variation greater than 0.3 (return on assets [ROA], Disc, and Risk) were considered based on the indication that the dataset could be considered heterogeneous (Fávero, Belfi ore, Silva & Chan, 2009). However, the decision was made not to discard these observations based on the theoretical reason of the
Figure 1 Research Model
CSP = Corporate Social Performance.
Source: Elaborated by the authors.
CSP Disclosure
CSP Financial Performance
normality hypothesis described by the central limit theorem (Gujarati & Porter, 2011).
To verify the moderating eff ect of disclosure in the relationship between CSP and CFP, ROA was used as a proxy for the CFP construct. Th is measure was identifi ed as one of the most widely used in studies that have tested the CSP-CFP relationship (Boaventura et al., 2012).
As a proxy for CSP, the variables related to the CSP of employees, community, and suppliers available from the database were used. As a measure of disclosure, the score for this variable available from the database was used. Th ese variables are described in Table 1, elaborated according to information featured in the database.
Table 1
Description of the independent variables
Construct Variable Dimension Nature of the Variable Description
CSP
CSP employees
Equal opportunities
Binary 0 = No 1 = Yes
Indicates whether the company is, by policy, committed to equal opportunities. Protection of
workers’ rights
Binary 0 = No 1 = Yes
Indicates whether the company has implemented initiatives to ensure the protection
of rights of all the people it works with. Fair pay
Binary 0 = No 1 = Yes
Indicates whether the company is committed to ensuring a fair minimum wage for all collaborators in the group. Health and safety
management
Binary 0 = No 1 = Yes
Indicates whether the company has recognized its health and safety risks and
responsibilities and is making an effort to improve its management of them. Employees
trained in CSR
Binary 0 = No 1 = Yes
Indicates whether the company carries out training courses related
to CSR for its employees. CSP supplier Suppliers
Binary 0 = No 1 = Yes
Indicates whether the company has implemented socioenvironmental
initiatives in its supply chain. CSP community Community Total spending divided by the number of
company employees
Total spending on activities developed for the community.
Disclosure Disclosure
Social, environmental, and corporate
governance disclosure score.
0.1-100.0: 0.1 for the companies
that disclose a minimum amount of
data and 100.0 for those that disclose
all the data.
Score based on the extent of the company’s social, environmental, and governance
disclosure. It is obtained by weighting in terms of importance. Data related to employees have a greater weight than other disclosures. It also considers the relevance of
the disclosure for that sector in the industry.
CSP = Corporate Social Performance; CSR = Corporate Social Responsibility.
Source: Elaborated by the authors.
The moderation hypothesis is supported if the regression coeffi cient of the interactive variable (disclosure multiplied by CSP) is significantly different from 0 (Aguinis, 1995; Baron & Kenny, 1986).
As control variables, size and risk were used as measures that affect the CSP-CFP relationship (for example, Andersen & Dejoy, 2011; Callan & Th omas, 2009; Hull & Rothenberg, 2008; Makni, Francoeur &
Th e direct relationship between CFP and CSP is defi ned by the following equation:
CFPit=αi + β1CSPemplit + β2CSPsuppit + β3CSPcommit + β8sizeit + β9riskit + Ɛit
Considering the dependent, independent, and control variables and the interaction itself defi ned for a moderation model, the fi nal model for analysis is:
CFPit=αi + β1CSPemplit + β2CSPsuppit + β3CSPcommit + β4discit + β5DiscxCSPemplit + β6DiscxCSPsupp it + β7DiscxCSPcomm it + β8sizeit + β9riskit + Ɛit
in which CFP is the ROA of company i in year t, CSPempl
is the CSP related to the employee stakeholder of company
i in year t, CSPsupp is the CSP related to the supplier stakeholder of company i in year t, CSPcomm is the CSP related to the community stakeholder of company i in year
t (resulting from the calculation of the base-10 logarithm of the total spending related to these stakeholders divided by the number of employees), disc is the disclosure of company i in year t, DiscxCSPempl is the interaction of the employee CSP and disclosure variables of company i
in year t, CSPsuppcxdisc is the interaction of the supplier CSP and disclosure variables of company i in year t,
CSPcommxdisc is the interaction of the community CSP and disclosure variables of company i in year t, size is the base-10 logarithm of the quantity of employees of company i in year t, and risk is calculated by dividing
the total debt by the total assets of company i in year t. Aft er identifying the variables of the models, the regression model with panel data was applied, using Stata®
version 13 to estimate the equations, covering various companies (cross section) in the period from 2010 to 2014. To identify the panel data model to be applied to generate the estimation, the Lagrange multiplier (LM), Breusch-Pagan (indicates the POLS or random eff ect model), Chow F (indicates the POLS or fi xed eff ect model), and Hausman (indicates random or fi xed eff ect) tests were carried out.
In order to remove the problem of multicollinearity between the independent, moderating, and interactive variables and the dependent variable, the independent and interactive variables were standardized, centering on the mean, as proposed by Echambadi and Hess (2007).
4. RESULTS
4.1 Descriptive Statistics
In absolute numbers, individually, the companies have from 2 to 2.2 million employees. Th e CSPempl variable
can vary from 0 to 5 in accordance with the fulfi llment of various dimensions related to the employee CSP presented in Table 1. Table 2 presents the quantity of observations with each one of the six sectors.
Table 2
Corporate Social Performance related to employees (CSPempl)
Sum of the scores Observations
n (%) Cumulative
0 410 (7.15) 7.15
1 621 (10.83) 17.98
2 1,701 (29.66) 47.64
3 2,620 (45.68) 93.32
4 348 (6.07) 99.39
5 35 (0.61) 100.00
Total 5,735 (100.00)
-Source: Elaborated by the authors.
1
From the results presented, 45.68% of the companies present a score equivalent to fulfi lling three of the fi ve dimensions related to employee CSP. It is also verifi ed that 99.39% of the companies present a score of up to four points.
In relation to the participation of the companies
in the initiatives related to suppliers, Table 3 presents the frequency in which the companies implement such initiatives in their supply chain. Based on these data, it is verifi ed that this policy is implemented by more than 53.15% of the companies.
Table 3
Socioenvironmental initiatives in the supply chain (CSPsupp)
n (%) Accumulated
The company has not implemented
social initiatives in its supply chain. 2,687 (46.85) 46.85
The company has implemented social
initiatives in its supply chain. 3,048 (53.15) 100.00
Total 5,735 (100.00)
-Source: Elaborated by the authors.
Table 4 identifi es the mean and the standard deviation of the sample and the coeffi cient of variation of the ROA, CSPcomm, Disc, Size, and Risk variables. Based on the dataset, if the value of the coeffi cient of variation is greater
than 0.3, the dataset can be considered heterogeneous (Fávero et al., 2009). Based on this principle, the data related to CSPcomm, Disc, and Size can be considered homogeneous.
Table 4
Tendency measures and dispersion of the variables
Statistic ROA CSPcomm Disc Size Risk
Mean 0.05185 5.824 35.287 3.982 0.23791
Standard Deviation 0.06475 1.216 13.201 0.704 0.16779
Coeffi cient of Variation 1.249 0.208 0.374 0.177 0.705
CSPcomm = corporate social performance related to the community stakeholder; Disc = social disclosure score; ROA = return on assets.
Source: Elaborated by the authors.
Th e correlation matrix contained in Table 5 expresses, in general, a low correlation between the variables at a 5% level of signifi cance. A moderate positive correlation is verifi ed between the CSPempl and disclosure and CSPsupp and disclosure variables, and also between CSPcomm
and Size. For the purposes of the research, this result may be an indication that no multicollinearity problem exists. Th is occurs when there are very high correlations between explanatory variables (Fávero, 2015).
Table 5
Correlation matrix between the variables used in the research
ROA CSPempl CSPsupp CSPcomm Disc Disc
x CSPempl
Disc x CSPsupp
Disc
x CSPcomm Size Risk
ROA 1
CSPempl -0.0282* 1
CSPsupp -0.1148* 0.3553* 1
CSPcomm 0.0706* 0.2647* 0.2273* 1
ROA CSPempl CSPsupp CSPcomm Disc Disc x CSPempl
Disc x CSPsupp
Disc
x CSPcomm Size Risk
DiscxCSPcomm -0.0002 0.1073* 0.0134 0.2317* 0.2690* 0.2354* 0.2453* 1
Size -0.0536* 0.2563* 0.2688* 0.5239* 0.3003* 0.0361* 0.0300* 0.1402* 1
Risk -0.2837* 0.0453* -0.0019 0.1015* 0.0242 0.0176 0.0345* 0.0383* 0.0901* 1
* = 5% level of signifi cance.
CSPcomm = corporate social performance related to the community stakeholder; CSPsupp = corporate social performance related to the supplier stakeholder; CSPempl = corporate social performance related to the employee stakeholder; Disc = social disclosure score; ROA = return on assets.
Source: Elaborated by the authors.
4.2 Presentation of the Results
When verifying the modeling to be applied, the Breusch-Pagan LM, Chow F, and Hausman tests resulted in the indication of the fi xed eff ects model as the most recommended to indicate the coeffi cients of the variables proposed in the model and the respective degree of signifi cance of the infl uence.
Th e homogeneity of the residuals of the panel data regression with fi xed eff ects was verifi ed based on the Wald test, in order to detect the presence of heteroskedasticity. Th e tests to verify serial autocorrelation and homogeneity of the residuals rejected the hypothesis, thus identifying the heteroskedasticity and autocorrelation of the residuals, which confi gures a break from the assumptions of the regression model for panel data. To solve these problems, the Newey-West robust standard errors correction was used. Based on these results, the statistic of the models was
then generated using the commands in the Stata soft ware applied to models with fi xed eff ects, implemented with the support of the correction model developed by Newey and West (1987).
Aft er generating the model, the Tolerance and Variance Infl ation Factor (VIF) statistics were applied. Th e result of the test indicated a VIF of below 10, which removes the problem of multicollinearity (Hair, Black, Babin, Anderson & Tatham, 2009).
Aft er carrying out the tests to identify the assumptions of the model and with the use of the necessary adjustments the results presented in Table 6 were obtained. The estimates generated by the Stata soft ware with the Newey-West robust standard errors correction do not calculate the R2 estimates. To substitute this estimate the sum of the
square of the residuals (SQR) was generated. Th e expected result is that these residuals around the line of regression will be as low as possible (Gujarati & Porter, 2011).
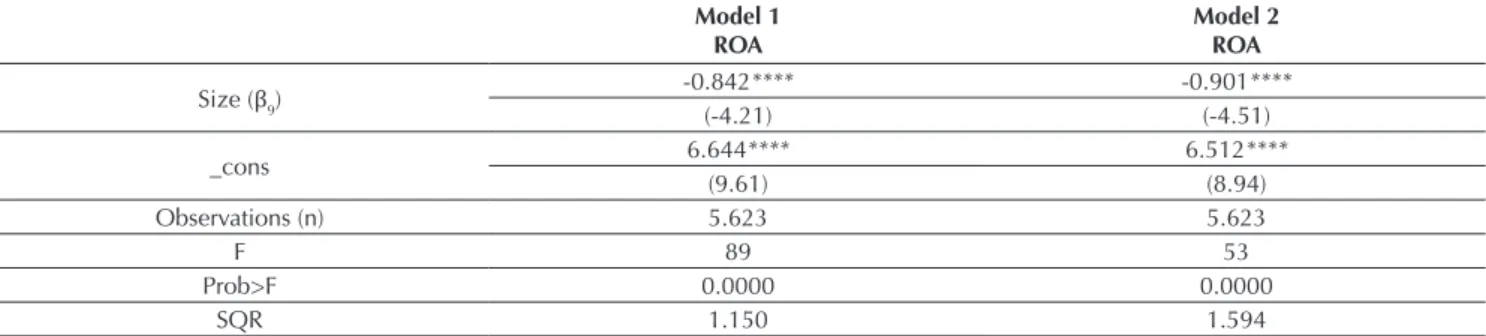
Table 6
Results of the regression with panel data
Model 1 ROA
Model 2 ROA
CSPempl (β1)
0.0538 0.356***
(0.47) (3.05)
CSPsupp (β2)
-1.754**** -1.272****
(-7.94) (-4.63)
CSPcomm (β3)
0.947**** 1.042****
(9.91) (10.38)
disc (β4)
-0.0401**** (-3.57) DiscxCSPempl (β5)
0.0149* (1.67) DiscxCSPsupp (β6)
0.0631*** (2.78) DiscxCSPcomm (β7)
-0.00952 (-1.29) Risk (β8)
-0.116**** -0.117****
(-18.82) (-18.99)
Table 5
Model 1 ROA
Model 2 ROA
Size (β9)
-0.842**** -0.901****
(-4.21) (-4.51)
_cons 6.644**** 6.512****
(9.61) (8.94)
Observations (n) 5.623 5.623
F 89 53
Prob>F 0.0000 0.0000
SQR 1.150 1.594
Note: standard errors in brackets.
CSPcom = corporate social performance related to the community stakeholder; CSPsupp = corporate social performance related to the supplier stakeholder; CSPempl = corporate social performance related to the employee stakeholder; Disc = social disclosure score; SQR = sum of the square of the residuals.
*, **, ***, **** = p < 0.10, p < 0.05, p < 0.01, p < 0.001, respectively.
Source: Elaborated by the authors.
Model 1, indicated in Table 6, tests H1 related to the infl uence of the CSP of the primary stakeholders construct on CFP.
Th e outputs of model 1 show, based on the p-values of the F and t statistics, that the parameters of the explanatory variables CSPsupp (β2 = -1.754; p < 0.001) and CSPcomm (β3 = 0.947; p < 0.001) are statistically signifi cant for explaining the behavior of fi nancial performance. Based on the t statistic, the CSPempl variable (β1 = 0.0538; p = 0.641) does not present statistical signifi cance in the presence of the other variables.
Th e coeffi cients indicate that the variation of one unit of CSPcomm (β3 = 0.947; p < 0.001) results each year in an increase in CFP, ceteris paribus, while in relation to the CSPsupp variable (β2 = -1.754; p < 0.001), by presenting the supplier CSP the company’s result will be reduced.
In economic terms, the result indicates that monetary values invested in the community lead to an increase in the fi nancial performance of companies, since the CSPcomm variable is a measure of how much a company invests in social actions connected to the community. Unlike this result, the equation presented for model 1 shows that each indication of implementing a socioenvironmental initiative in the supply chain results in a reduction in the company’s fi nancial performance.
In light of this result, it is verifi ed that H1 was partially supported.
Model 2 tests the moderating eff ect of CSP disclosure on the relationship between the CSP of the primary stakeholders and CFP.
Based on the p-values of the F and t statistics of model
(β5 = 0.0149; p < 0.10) and DiscxCSPsupp (β6 =0.0631; p < 0.01) interaction are statistically signifi cant for explaining the behavior of fi nancial performance in the presence of the other variables in the model. Based on the t statistic, the DiscxCSPcomm variable (β7 = -0.00952; p = 0.199) does not present statistical signifi cance in the presence of the other variables.
Th e coeffi cients of model 2 indicate that each unit of the interaction of the Disc variable with the employee and supplier CSP results each year in an increase in CSP,
ceteris paribus. Th ese results indicate that H2 is partially supported.
4.3 Discussion of the Results
Th e central point of this study is to identify the eff ect of disclosure on the relationship between CSP and CFP and present the discussion about how this interaction occurs at the level of the relationships with primary stakeholders, infl uencing CSP. It is argued that D-CSP has a positive moderating eff ect on the CSP-CFP relationship over time. With relation to the eff ect of the employee stakeholder CSP on CFP (model 1), based on the results expressed in Table 6, the relationship did not indicate statistical significance. The theories and the research on the relationship between human resource management and the results involve diff erent key components that intertwine to create the eff ect on CFP (Jiang, Lepak, Hu & Baer, 2012).
Th e CSP construct related to the employee stakeholder indicated in this study captures various important
Table 6
training employees in CSR. Th ese practices may not lead to CFP, despite the drivers of operational performance. In certain contextual circumstances, CSP may not enable companies to directly materialize their involvement in social questions related to their stakeholders into CFP, since there are other contingencies in the CSP-CFP relationship (Hasan, Kobeissi, Liu & Wang, 2016). Th e authors consider that knowledge of this contingent nature of CSP is crucial in the competitive context. In light of the above, it can be inferred that the practices consistent with CSP related to employee stakeholders presented in the research were insuffi cient to capture their infl uence on CSP. Th e result indicated in model 1 leads to the assumption that despite the proxy capturing various components of employee CSP, there are other intervening factors in the relationship between CSP and CFP.
Th e results of the test that verifi ed the moderating eff ect of CSP disclosure on the relationship between CSP and CFP (model 2) revealed that, besides expressing CSP in relation to the employee stakeholder, it is necessary to externalize this result, using disclosure to achieve a higher CFP. Th e positive eff ect of the interaction of CSP disclosure with employee CSP on CSP may be associated with the existence of external pressures infl uencing the strengthening of the relationships between companies and their employees (Griffi n, Bryant & Koerber, 2015).
D-CSP results from management for stakeholders (Boesso & Kumar, 2007) and infl uences a company’s reputation by gaining the trust of stakeholders (Bayoud & Kavanagh, 2012), since the usefulness and legitimacy of organizational activities mostly occur based on information obtained in the corporate communication actions of the organization (Mendonça, Ricardo & Amantino-de-Andrade, 2003). Managers are incentivized to disclose information on their various programs related to particular stakeholders with attributes of power, legitimacy, and urgency, just as the salience model from Mitchell, Agle, and Wood (1997) proposes, in order to indicate that they are in conformance with their expectations. In addition, it can be inferred that investment in social responsibility activities and disclosure have important consequences in the creation and development of fundamental intangible resources, especially those associated with employees (Branco & Rodrigues, 2006).
Another explanation for this positive relationship is obtained in research that suggests that companies with strong CSP are perceived as more attractive employers (Jones, Willness & Madey, 2014). Th e result of the research of these authors reveals that CSP disclosure leads to human resource attractiveness, which can contribute to an improvement in productivity and consequently infl uence CSP.
Th e eff ects of the interaction between CSP disclosure and employee CSP on attracting human resources can infl uence the existence of intangibles capable of generating a competitive advantage, with an increase in the company’s credibility level. Stakeholders can perceive those companies that present performance in their management for these stakeholders, beyond merely fulfi lling labor rules, thus leading to visible levels of CSP.
Th e second eff ect of the tested relationships is supplier CSP and its interaction with CSP disclosure on CSP (models 1 and 2).
Th e result associated with the CSP coeffi cient related to the supplier stakeholder presents a marginal negative eff ect on the relationship with CFP (model 1). Th is result confi rms the fi nding of the research from Craig (2005), who did not verify a direct relationship between social responsibility in the supply chain and a reduction in company costs. Th e author understands that generating direct results in costs involves learning how to transform this activity into results for the company. Managers can be oblivious to the eff ects of CSP on the supply chain and consequently on costs, suggesting that many of them are committing to this activity because “it would be the right thing to do” (Craig, 2005).
Another assumption that is made concerns the direct impact on the costs of the supply chain. Managers are in a particularly advantageous position to positively infl uence CSP by means of various actions related to the supply chain (Carter & Easton, 2011). Th e practices resulting from the implementation of socioenvironmental policies in a company’s supply chain, however, can impose additional costs on suppliers if they were not strategically aligned with these policies. Since for suppliers the company can be seen as a salient stakeholder, in accordance with the salience model presented by Mitchell et al. (1997), they will be subjected to these costs, passing them on into the price of their product. In light of this, this eff ect will directly infl uence the organization’s result.
The third effect of the tested relationships is the community CSP and its interaction with disclosure (models 1 and 2). Th e results of the relationship presented in model 1 identify the positive fi nancial rewards obtained with the promotion of positive relationships with the communities that relate with the organization (Barnett & Salomon, 2006).
Despite this positive infl uence of community CSP on CSP (models 1 and 2) no statistically signifi cant eff ect of the moderation of community CSP disclosure on the relationship is verifi ed, as presented in Table 6 (model 2). While the interaction between disclosure and practices related to employees and suppliers indicates that the
actions for these stakeholders need to be externalized to capture CFP, the same cannot be observed based on the results of this research, in relation to the community. Of the three stakeholders analyzed, only the interaction of the disclosure related to the community stakeholder did not show a positive marginal eff ect, despite the positive infl uence of investment in community actions on the CSP observed in model 1. One explanation for this is that by benefi ting from company actions, the community becomes aware of these actions and the eff ect can be considered immediate, with disclosure not being needed as a means of achieving the intended eff ect on CSP.
5. CONCLUSION
Th e main aim of the research was to identify the moderating eff ect of D-CSP on the relationship between the CSP of primary stakeholders and CFP.
Th e fi rst relationship tested verifi es the direct eff ect of the CSP of primary stakeholders on CSP. Th e results show that the investments carried out by a company in social actions involving employee and supplier stakeholders were not directly revealed in fi nancial return. As Harrison et al. (2010) remind us, investing in stakeholders is not a managerial cure-all nor a rule for generating wealth, but rather constitutes a diffi cult task with an uncertain result. Another relationship verifi ed aimed to answer the research question and verify whether disclosure has a moderating eff ect on the relationship between CSP and CFP. Th is eff ect was verifi ed in the CSP related to the employee and supplier stakeholders. Th e result contradicts those that indicate that investing in CSP does not lead to higher CFP, since it indicates that the relationship can be infl uenced by other factors, as indicated in other studies (Chang et al., 2013; Guthrie & Parker, 1989; Hull & Rothenberg, 2008; Tang et al., 2012; Wang & Choi, 2013). Concerning the results for the community stakeholder, these show that the relationship between the community stakeholder CSP and CSP is direct. However, it is observed that with disclosure, there is a positive variation in the coeffi cient associated with this variable, indicating that even though the interaction does not capture CFP, disclosure has a positive eff ect, indicated in the increase in the coeffi cient related to the CSPcomm variable.
In light of the above and based on the results of this research, it is verifi ed that disclosure has a moderating eff ect on the relationship between CSP and CFP, notably when the CSP related to employees and its interaction with disclosure is analyzed. From the result presented,
the hypothesis that D-CSP positively moderates the relationship between the CSP related to the primary stakeholder and CFP.
This study has collaborated in identifying the contribution of disclosure in the CSP of companies, since this disclosure leads to additional costs. Th us, the result of the study serves as a basis for decisions regarding disclosure. It was observed that by being transparent in their actions with stakeholders, companies can capture higher CFP. Th e second contribution is the examination of the relationship based on stakeholder theory, which is important for studying the CSP-CFP relationship (Wood & Jones, 1995).
In managerial terms, this investigation helps in manager decisions related to CSP disclosure. A manager may consider that in some situations attending to stakeholders well in isolation is not suffi cient for generating a satisfactory organizational return. Depending on the stakeholder, he/she not only needs to provide direct results, but also disclose the CSP of that stakeholder. Th is can be considered as a way of giving transparency to his/her management for these stakeholders and for other important ones, such as employee and supplier stakeholders, which are more associated with more internal company actions.
Th e main limitations of this research are: (i) a lack of data related to the client primary stakeholder and (ii) heterogeneity of the sample, which is composed of companies of various sizes in terms of number of employees, varying from 2 to 2.2 million.
REFERENCES
Aguinis, H. (1995). Statistical power with moderated multiple regression in management research. Journal of Management,
21(6), 1141-1158.
Andersen, M. L., & Dejoy, J. S. (2011). Corporate social and fi nancial performance: the role of size, industry, risk, R&D and advertising expenses as control variables. Business and Society Review, 116(2), 237-256.
Backhaus, K. B., Stone, B. A., & Heiner, K. (2002). Exploring the relationship between corporate social performance and employer attractiveness. Business & Society, 41(3), 292-318. Baird, P. L., Geylani, P. C., & Roberts, J. A. (2012). Corporate
social and fi nancial performance re-examined: industry eff ects in a linear mixed model analysis. Journal of Business Ethics,
109(3), 367-388.
Barnett, M. L., & Salomon, R. M. (2006). Beyond dichotomy: the curvilinear relationship between social responsibility and fi nancial performance. Strategic Management Journal, 27(11), 1101-1122.
Barnett, M. L., & Salomon, R. M. (2012). Does it pay to be really good? Addressing the shape of the relationship between social and fi nancial performance. Strategic Management Journal,
33(11), 1304-1320.
Baron, R. M., & Kenny, D. A. (1986). Th e moderator-mediator variable distinction in social psychological research: conceptual, strategic, and statistical considerations. Journal of Personality and Social Psychology, 51(6), 1173-1182.
Bayoud, N. S., & Kavanagh, M. (2012). Corporate Social responsibility disclosure: evidence from Libyan managers.
Global Journal of Business Research, 6(5), 73-83. Berman, S. L., Wicks, A. C., Kotha, S., & Jones, T. M. (1999).
Does stakeholder orientation Matter? Th e relationship between stakeholder management models and fi rm fi nancial performance. Academy of Management Journal, 42(5), 488-506.
Bhattacharya, C. B., & Sen, S. (2003). Consumer-company identifi cation: a framework for understanding consumers’ relationships with companies. Journal of Marketing, 67(2), 76-88.
Billor, N., Hadi, A. S., & Velleman, P. F. (2000). BACON: Blocked Adaptive Computationally Effi cient Outlier Nominators.
Computational Statistics & Data Analysis, 34(3), 279-298. Bingham, J. B., Jr., W. G. D., Smith, I., & Adams, G. L. (2011). A
stakeholder identity orientation approach to corporate social performance in family fi rms. Journal of Business Ethics, 99(4), 565-585.
Boaventura, J. M. G., da Silva, R. S., & Bandeira-de-Mello, R. (2012). Performance Financeira Corporativa e Performance Social Corporativa: desenvolvimento metodológico e contribuição teórica dos estudos empíricos. Revista Contabilidade & Finanças, 23(60), 232-245.
Boesso, G., & Kumar, K. (2007). Drivers of corporate voluntary disclosure: a framework and empirical evidence from Italy and the United States. Accounting, Auditing & Accountability Journal, 20(2), 269-296.
Bowman, E. H., & Haire, M. (1976). Social impact disclosure
and corporate annual reports. Accounting, Organizations and Society, 1(1), 11-21.
Brammer, S., & Millington, A. (2008). Does it pay to be diff erent? An analysis of the relationship between corporate social and fi nancial performance. Strategic Management Journal, 29(12), 1325-1343.
Brammer, S., & Pavelin, S. (2004). Voluntary social disclosures by large UK companies. Business Ethics: A European Review,
13(2-3), 86-99.
Branco, M. C., & Rodrigues, L. L. (2006). Corporate social responsibility and resource-based perspectives. Journal of Business Ethics, 69(2), 111-132.
Brockhoff , K. (1979). A note on external social reporting by German companies: a survey of 1973 company reports.
Accounting, Organizations and Society, 4(1-2), 77-85. Brower, J., & Mahajan, V. (2013). Driven to be good: a stakeholder
theory perspective on the drivers of corporate social performance. Journal of Business Ethics, 117(2), 313-331. Callan, S. J., & Th omas, J. M. (2009). Corporate fi nancial
performance and corporate social performance: an update and reinvestigation. Corporate Social Responsibility and Environmental Management, 16(2), 61-78.
Carroll, A. B. (2015). Corporate social responsibility: the centerpiece of competing and complementary frameworks.
Organizational Dynamics, 44(2), 87-96.
Carter, C. R., & Easton, P. L. (2011). Sustainable supply chain management: evolution and future directions. International Journal of Physical Distribution & Logistics Management,
41(1), 46-62.
Chang, Y. K., Oh, W.-Y., & Messersmith, J. G. (2013). Translating corporate social performance into fi nancial performance: exploring the moderating role of high-performance work practices. International Journal of Human Resource Management, 24(19), 3738-3756.
Chiu, S.-C., & Sharfman, M. (2011). Legitimacy, visibility, and the antecedents of corporate social performance: an investigation of the instrumental perspective. Journal of Management, 37(6), 1558-1585.
Choi, J.-S., Kwak, Y.-M., & Choe, C. (2010). Corporate social responsibility and corporate fi nancial performance: evidence from Korea. Australian Journal of Management, 35(3), 291-311.
Choi, J., & Wang, H. (2009). Stakeholder relations and the persistence of corporate fi nancial performance. Strategic Management Journal, 30(8), 895-907.
Clarkson, M. E. (1995). A stakeholder framework for analyzing and evaluating corporate social performance. Academy of Management Review, 20(1), 92-117.
Craig, C. R. (2005). Purchasing social responsibility and fi rm performance: the key mediating roles of organizational learning and supplier performance. International Journal of Physical Distribution & Logistics Management, 35(3), 177-194. Dawkins, C. E., & Fraas, J. W. (2008). An exploratory analysis
Dierkes, M. (1979). Corporate social reporting in Germany: conceptual developments and practical experience.
Accounting, Organizations and Society, 4(1-2), 87-107. Donaldson, T., & Preston, L. E. (1995). Th e stakeholder theory
of the corporation: concepts, evidence, and implications.
Academy of Management Review, 20(1), 65-91. Dutton, J. E., Dukerich, J. M., & Harquail, C. V. (1994).
Organizational images and member identifi cation.
Administrative Science Quarterly, 39(2), 239-263. Echambadi, R., & Hess, J. D. (2007). Mean-centering does
not alleviate collinearity problems in moderated multiple regression models. Marketing Science, 26(3), 438-445. Eesley, C., & Lenox, M. J. (2006). Firm responses to secondary
stakeholder action. Strategic Management Journal, 27(8), 765-781.
Evan, W. M., & Freeman, R. E. (1993). A stakeholder theory of the modern corporation: Katian capitalism. In Donaldson, T.; & Werhane, P. H. (Eds.), Ethical issues in business (pp. 166-171). Englewood Cliff s, NJ: Prenticice-Hall.
Fávero, L. P. (2015). Análise de dados: modelos de regressão com Excel, Stata e SPSS. Rio de Janeiro, RJ: Elsevier.
Fávero, L. P., Belfi ore, P., Silva, F. L., & Chan, B. L. (2009). Análise de dados: modelagem multivariada para tomada de decisões (4a reimp.). Rio de Janeiro, RJ: Elsevier.
Fernandez-Feijoo, B., Romero, S., & Ruiz, S. (2014). Eff ect of stakeholders’ pressure on transparency of sustainability reports within the GRI framework. Journal of Business Ethics,
122(1), 53-63.
Font, X., Walmsley, A., Cogotti, S., McCombes, L., & Haeusler, N. (2012). Corporate social responsibility: the disclosure-performance gap. Tourism Management, 33(6), 1544-1553. Freeman, R. E. (1984). Strategic management: a stakeholder
approach. New York, NY: Cambridge University.
Gitman, L., Chorn, B., & Fargo, B. (2009). ESG in the mainstream: the role for companies and investors in environmental, social, and governance integration. San Francisco, CA: Business for Social Responsibility.
Gonçalves, R. de S., Medeiros, O. R. de, Niyama, J. K., & Weff ort, E. F. J. (2013). Social disclosure e custo de capital próprio em companhias abertas no Brasil. Revista Contabilidade & Finanças, 24(62), 113-124.
Greening, D. W., & Turban, D. B. (2000). Corporate social performance as a competitive advantage in attracting a quality workforce. Business & Society, 39(3), 254-280.
Griffi n, J. J., Bryant, A., & Koerber, C. P. (2015). Corporate responsibility and employee relations: from external pressure to action. Group & Organization Management, 40(3), 378-404. Gujarati, D. N., & Porter, D. C. (2011). Econometria básica (5th
ed.). Rio de Janeiro, RJ: AMGH.
Guthrie, J., & Parker, L. D. (1989). Corporate social reporting: a rebuttal of legitimacy theory. Accounting and Business Research, 19(76), 343-352.
Hair, J. F., Black, W. C., Babin, B. J., Anderson, R. E., & Tatham, R. L. (2009). Análise multivariada de dados (6th ed.). Porto Alegre, RS: Bookman.
corporate governance attributes: the case of Shari’ah compliant companies in Mala. Issues in Social & Environmental
Accounting, 6(3/4), 68-94.
Halbritter, G., & Dorfl eitner, G. (2015). Th e wages of social responsibility – where are they? A critical review of ESG investing. Review of Financial Economics, 26(2015), 25-35. Harrison, J. S., Bosse, D. A., & Phillips, R. A. (2010). Managing
for stakeholders, stakeholder utility functions and competitive advantage. Strategic Management Journal, 31(1), 58-74. Hasan, I., Kobeissi, N., Liu, L., & Wang, H. (2016). Corporate
social responsibility and fi rm fi nancial performance: the mediating role of productivity [Discussion Paper]. Bank of Finland Research. Retrieved fromhttps://helda.helsinki.fi /bof/ bitstream/handle/123456789/14088/BoF_DP_1607.pdf Hillman, A. J., & Keim, G. D. (2001). Shareholder value,
stakeholder management, and social issues: what’s the bottom line? Strategic Management Journal, 22(2), 125-139.
Hull, C. E., & Rothenberg, S. (2008). Firm performance: the interactions of corporate social performance with innovation and industry diff erentiation. Strategic Management Journal,
29(7), 781-789.
Isaksson, L. E., & Woodside, A. G. (2016). Modeling fi rm heterogeneity in corporate social performance and fi nancial performance. Journal of Business Research, 69(9), 3285-3314. Iudícibus, S. de, Martins, E., & Carvalho, L. N. (2005).
Contabilidade: aspectos relevantes da epopéia de sua evolução.
Revista Contabilidade & Finanças, 16(38), 7-19. Jiang, K., Lepak, D. P., Hu, J., & Baer, J. C. (2012). How does
human resource management infl uence organizational outcomes? A meta-analytic investigation of mediating mechanisms. Academy of Management Journal, 55(6), 1264-1294.
Jones, D. A., Willness, C. R., & Madey, S. (2014). Why are job seekers attracted by corporate social performance? Experimental and fi eld tests of three signal-based mechanisms. Academy of Management Journal, 57(2), 383-404.
Kato, T., & Kodama, N. (2017). Th e eff ect of corporate social responsibility on gender diversity in the workplace:
econometric evidence from Japan. British Journal of Industrial Relations. Retrieved from doi: 10.1111/bjir.12238.
Laplume, A. O., Sonpar, K., & Litz, R. A. (2008). Stakeholder theory: reviewing a theory that moves us. Journal of Management, 34(6), 1152-1189.
Lau, C., Lu, Y., & Liang, Q. (2016). Corporate social responsibility in China: a corporate governance approach. Journal of Business Ethics, 136(1), 73-87.
Lee, S., Seo, K., & Sharma, A. (2013). Corporate social responsibility and fi rm performance in the airline industry: the moderating role of oil prices. Tourism Management,
38(2013), 20-30.
disclosure in China. Business Ethics: A European Review,
22(2), 159-173.
Lu, W., Chau, K. W., Wang, H., & Pan, W. (2014). A decade’s debate on the nexus between corporate social and corporate fi nancial performance: a critical review of empirical studies 2002-2011. Journal of Cleaner Production, 79(2014), 195-206. Makni, R., Francoeur, C., & Bellavance, F. (2009). Causality
between corporate social performance and fi nancial performance: evidence from Canadian fi rms. Journal of Business Ethics, 89(3), 409-422.
Margolis, J. D., Elfenbein, H. A., & Walsh, J. P. (2009). Does it pay to be good… and does it matter? A meta-analysis of the relationship between corporate social and fi nancial performance [Scholarly Paper]. Social Science Research Network. Retrieved from https://papers.ssrn.com/sol3/papers. cfm?abstract_id=1866371.
McWilliams, A., & Siegel, D. (2000). Corporate social responsibility and fi nancial performance: correlation or misspecifi cation? Strategic Management Journal, 21(5), 603-609.
Mendonça, C. de, Ricardo, J., & Amantino-de-Andrade, J. (2003). Gerenciamento de impressões: em busca de legitimidade organizacional. Revista de Administração de Empresas, 43(1), 1-13.
Mio C., Venturelli A., & Leopizzi R. (2015). Management by objectives and corporate social responsibility disclosure.
Accounting, Auditing & Accountability Journal, 28(3), 325-364. Mitchell, R. K., Agle, B. R., & Wood, D. J. (1997). Toward a
theory of stakeholder identifi cation and salience: defi ning the principle of who and what really counts. Academy of Management Review, 22(4), 853-886.
Newey, W. K., & West, K. D. (1987). A simple, positive semi-defi nite, heteroskedasticity and autocorrelation consistent covariance matrix. Econometrica, 55(3), 703-708.
Oliveira, M. C., De Luca, M. M. M., Ponte, V. M. R., & Pontes, J. É., Jr. (2009). Disclosure of social information by Brazilian companies according to United Nations indicators of corporate social responsibility. Revista Contabilidade & Finanças, 20(51), 116-132.
Orlitzky, M., Schmidt, F. L., & Rynes, S. L. (2003). Corporate social and fi nancial performance: a meta-analysis. Organization Studies, 24(3), 403-441.
Peng, C.-W., & Yang, M.-L. (2014). Th e eff ect of corporate social performance on fi nancial performance: the moderating eff ect of ownership concentration. Journal of Business Ethics, 123(1), 171-182.
Perrini, F., Russo, A., Tencati, A., & Vurro, C. (2012). Deconstructing the relationship between corporate social and fi nancial performance. Journal of Business Ethics, 102(1), 59-76.
Phillips, R., Freeman, R. E., & Wicks, A. C. (2003). What stakeholder theory is not. Business Ethics Quarterly, 13(4), 479-502.
Preston, L. E. (1981). Research on corporate social reporting: directions for development. Accounting, Organizations and Society, 6(3), 255-262.
Roberts, R. W. (1992). Determinants of corporate social
responsibility disclosure: an application of stakeholder theory.
Accounting, Organizations and Society, 17(6), 595-612. Schreuder, H. (1979). Corporate social reporting in the Federal
Republic of Germany: an overview. Accounting, Organizations and Society, 4(1-2), 109-122.
Suchman, M. C. (1995). Managing legitimacy: strategic and institutional approaches. Academy of Management Review,
20(3), 571-610.
Surroca, J., & Tribó, J. A. (2008). Managerial entrenchment and corporate social performance. Journal of Business Finance & Accounting, 35(5-6), 748-789.
Tang, Z., Hull, C. E., & Rothenberg, S. (2012). How corporate social responsibility engagement strategy moderates the CSR – Financial performance relationship: CSR engagement strategy.
Journal of Management Studies, 49(7), 1274-1303. Ullmann, A. A. (1979). Corporate social reporting: political
interests and confl icts in Germany. Accounting, Organizations and Society, 4(1-2), 123-133.
Ullmann, A. A (1985). Data in Search of a Th eory – A critical-examination of the relationships among social performance, social disclosure, and economic-performance of United-States fi rms. Academy of Management Review, 10(3), 540-557. Van Beurden, P., & Gossling, T. (2008). Th e worth of values - A
literature review on the relation between corporate social and fi nancial performance. Journal of Business Ethics, 82(2), 407-424.
Van der Laan, G., Van Ees, H., & Van Witteloostuijn, A. (2008). Corporate social and fi nancial performance: an extended stakeholder theory and empirical test with accounting measures. Journal of Business Ethics, 79(3), 299-310. Van der Laan, S. J., Adhikari, A., & Tondkar, R. H. (2005).
Exploring diff erences in social disclosures internationally: a stakeholder perspective. Journal of Accounting and Public Policy, 24(2), 123-151.
Vergara, S. C. (1998). Projetos e relatórios de pesquisa em administração (2nd ed.). São Paulo, SP: Atlas.
Waddock, S. A., & Graves, S. B. (1997). Th e corporate social performance-fi nancial performance link. Strategic Management Journal, 8(4), 303-319.
Walsh, J. P., Weber, K., & Margolis, J. D. (2003). Social issues and management: our lost cause found. Journal of Management,
29(6), 859-881.
Wang, H., & Choi, J. (2013). A new look at the corporate social-fi nancial performance relationship: the moderating roles of temporal and interdomain consistency in corporate social performance. Journal of Management, 39(2), 416-441. Wang, H., Tong, L., Takeuchi, R., & George, G. (2016). Corporate
social responsibility: an overview and new research directions thematic issue on corporate social responsibility. Academy of Management Journal,59(2), 534-544.
Wang, Q., Dou, J., & Jia, S. (2015). A meta-analytic review of corporate social responsibility and corporate fi nancial performance. Th e moderating eff ect of contextual factors.
Business & Society, 55(8) 1083-1121.
Performance Management, 62(8), 871-888.
Weber, S. (2010). BACON: an eff ective way to detect outliers in multivariate data using Stata (and Mata). Stata Journal, 10(3), 331-338.
Wood, D. J. (1991). Corporate social performance revisited.
Academy of Management Review, 16(4), 691-718.
Wood, D. J., & Jones, R. E. (1995). Stakeholder mismatching: a theoretical problem in empirical research on corporate social performance. International Journal of Organizational Analysis,