AbstrAct:Objectives: To identify the access to health care services and associated factors in adults living in the city of Ribeirão Preto, São Paulo, Brazil, in 2007. Methods: A cross-sectional population-based epidemiological study with a sample developed in three stages. The variability introduced in the third sampling fraction was corrected by the attribution of weights, resulting in a sample of 2,471 participants. The outcome prevalence was estimated according to socio-demographic, behavioral and health-related variables. In order to identify associated factors, the regression of Poisson was used, obtaining crude and adjusted prevalence ratios. All estimates were calculated taking into account the efect of the sampling design. Results: The outcome prevalence increased according to the age, being higher in female individuals. A diferent set of variables remained in the inal models, considering each gender separately. Among men, the monthly income > R$ 1,400.00; scores > 823.6 to the Economic Indicator of Ribeirão Preto (IERP) and daily average of sitting down time (154.4 – 240 min/day) constituted themselves into protective factors, whereas the increase of age and scholarship, hospitalization, diabetes and hypertension constituted risk factors for the use of the services. Among women, health self-reported as regular, hospitalization, diabetes and hypertension characterized factors positively associated to the outcome at matter. Conclusions: The results indicate the need for planning actions aimed at capturing male individuals, as well as the revaluation of detection and control of diabetes and hypertension programs, aimed at the primary prevention of terminal cardiovascular events.
Keywords: Health Services. Correlates. Cross-sectional studies. Epidemiology. Public health.
Sex-speciic diferences in prevalence and in the
factors associated to the search for health services
in a population based epidemiological study
Diferenças sexo-especíicas na prevalência e nos fatores associados à procura
por serviços de saúde em estudo epidemiológico de base populacional
Suzana Alves de MoraesI, Daniele Almeida LopesII, Isabel Cristina Martins de FreitasI
ICenter of Epidemiology, Department of Maternal-Child Nursing and Public Health, School of Nursing of Ribeirão Preto, Universidade de São Paulo – Ribeirão Preto (SP), Brazil.
IICenter of Epidemiology, Graduate Program in Nursing and Public Health, School of Nursing of Ribeirão Preto, Universidade de São Paulo – Ribeirão Preto (SP), Brazil.
Corresponding author: Suzana Alves de Moraes. Avenida Santa Luzia, 440, apartamento 81, CEP: 14025-090, Ribeirão Preto, SP, Brazil. E-mail: [email protected]
Conlict of interests: nothing to declare – Financing source: Research Support Foundation of the state of São Paulo (FAPESP, process No. 2006/50495-2 and No. 2012/51141-0) and Coordination of Improvement of Higher Education Personnel (CAPES).
IntroductIon
The demographic and epidemiological transition involves complex changes in the patterns of morbidity and mortality, resulting from changes in the age structure, throughover time1. Important consequences of the demographic and epidemiological
transition are the aging population and the gradual replacement of infectious diseases by chronic degenerative ones, these being the main causes of morbidity and mortality2.
This changing in the epidemiology profile has led to high cost medical and hospital treatment, considering the increased demand for ambulatory health services and hospitalization which, together, requires the implantation of new health models, in order to deal with the problem3.
The concept of access to health services is complex and it is related to the availability of the services and their proper coverage. It involves the perception of health needs and the convertion of these needs into demand and use of the services, making access, therefore, a result of the possibility of usage of health services, whenever needed4-6.
The factors that predispose to the use of health services are the result of a set of determining factors which include chronic diseases, disabilities, sociodemographic,
resumO:Objetivo: Identiicar a prevalência da utilização de serviços de saúde e fatores associados em adultos de Ribeirão Preto, São Paulo, em 2007. Métodos: Estudo epidemiológico transversal de base populacional, com amostragem desenvolvida em três estágios. A variabilidade introduzida na terceira fração foi corrigida pela atribuição de pesos, originando amostra ponderada de 2.471 participantes. As prevalências do desfecho foram estimadas segundo variáveis sociodemográicas, comportamentais e relacionadas à saúde. Para identiicar fatores associados foi utilizada a regressão de Poisson, obtendo-se razões de prevalências brutas e ajustadas. Todas as estimativas foram calculadas levando-se em consideração o efeito de desenho amostral. Resultados: A prevalência do desfecho aumentou com a idade, sendo maior no sexo feminino. Diferentes variáveis permaneceram nos modelos inais, após estratiicação por sexo. Entre os homens, renda mensal > R$ 1.400,00, escores > 823,6 para o Indicador Econômico de Ribeirão Preto (IERP) e média diária de tempo sentado (154,4 – 240 min/dia) se constituíram em fatores de proteção, enquanto que aumento da idade e da escolaridade, internação hospitalar, diabetes e hipertensão em fatores de risco para a utilização de serviços. Entre as mulheres, saúde autorreferida como regular, internação hospitalar, diabetes e hipertensão se coniguraram como fatores associados positivamente ao desfecho em questão. Conclusões: Os resultados indicam a necessidade de planejamento de ações que visem maior captação de pessoas do sexo masculino, bem como de reavaliação de programas de detecção e controle do diabetes e da hipertensão, com vistas à prevenção primária de eventos cardiovasculares terminais.
behavioral and health-related factors. The consumption capacity of services is also influenced by public or private insurance coverage, by the type of service offering and by the needs of the individuals6,7.
Results of different cross-sectional epidemiological studies conducted in Brazil8-10
showed that sociodemographic factors (gender, age and income), behavioral factors (smoking habits) and health-related ones (self-reported health, hospitalization in the previous year, and diabetes mellitus) were associated with the access to services, although the measures of association have presented different directions or magnitudes, when considering gender stratification.
Given the intrinsec epidemilogical relevance to the knowledge of profile of the users of health services in Ribeirão Preto, São Paulo, the present study aimed at estimating the usage prevalence of these services according to sociodemographic, behavioral and health related variables, in an attempt to identify the list of factors independently associated to the outcome of interest.
MEtHodoLoGY
Study deSign and Sampling procedure
The study presents cross-sectional design, being an integral part of the Project EPIDCV (Prevalence of cardiovascular disease and identification of associated factors among adults living in Ribeirão Preto, SP), population-based epidemiologic study whose data collection was conducted in this municipality, in the period 2007/2008.
The sampling procedure was developed in three stages, and the precision of the estimates, calculated on a sample of 1,205 individuals, corresponded to sampling errors fixed around 2% (for prevalences below 15% or above 75%) and around 3% (for prevalences between 20 and 80%). In the first stage, 81 census areas were drawn, and in the sequence, 1,672 households, and 1,395 participants, the latter corresponding, respectively, to the 2nd and 3rd stages of sampling. The response rate was 82.1%, which
corresponded to 1,133 adult participants. The variability introduced, especially in the third sampling fraction, was corrected by calculating the sample weights which took into consideration the “number of eligible units of each household” and the “no answer” rates, in each census area. Altogether, 1,133 participants of both gender were interviewed. The losses (18.8%) were due to change of address (4.8%); death (0.5%) and refusals (13.5%), thses last ones to be considered as such after 5 contact attempts for the interview on alternate days and periods. The population estimates were based on the 2000 Census11. The study was conducted on weighted sample (nw) of
2,471 participants12. The sample of the EPIDCV project is characterized as a complex
calculated afterwards for the recovery of the total eligible ones and for correction of the non-response rate in each census area of the sample.
The first sample weight (w1) corresponded to the inverse of the probability of being drawn among the eligible ones:
w1 = 1
No.drawn No.elegible
No.elegible No.drawn w1 =
The second sample weight (w2) corresponded to the inverse of the probability of being interviewed, among the drawn ones:
w2 = 1
No.interviewed No.drawn
No.drawn No.interviewed w2 =
The final sample weight corresponded to the product w1 x w2, originating the fraction w12, necessary for recomposing the total eligible ones, in each household, and for the correction of the non-response rate in each census area. After weighting, it was obtained a sample of 2,471 participants (nw) which effectively constituted the studied population.
Study’S VariableS
• Dependent variable: Use of Health Services. This variable was generated dichotomously (yes/no) from the information of the study’s participants on the use of ambulatory health services in the six months preceding the interviews.
• Independent variables: Sociodemographic variables: were included participants of both gender and aged 30 years or more. The educational level was classified according to the number of completed years of formal schooling. From information on the
individual income in the past 30 days, the participants were classified according to the cutoff corresponding to the tertiles of income. The Economic Indicator of Ribeirão Preto (IERP)13 was built from the combined information of the variables
acquisition of consumer goods and schooling of head of household, for which weights were assigned, as recommended by Barros and Victora14. The sum of
the weights generated a score for each participant, and this variable was classified according to the cutoff corresponding to the respective distribution quintiles. Details on the procedure about how to format this variable can be found in Freitas and Moraes13. The marital status was defined according to the presence of
Behavioral and health-related variables: The habit of smoking was classified into three categories (never smoker, former smoker and smoker). The “alcohol addiction”
was classified based on the scores obtained in the questionnaire Alcohol Use Disorders Identification Test (AUDIT)15, validated for use in Brazil by Lima et al.16,
considering the cutoff point “8” as a reference for the classification of dependency. The physical activity pattern (PAP) and the average daily time sittingdown (sedentary behavior) were obtained from the International Physical Activities Questionnaire (IPAQ) (short version)17, validated in Brazil by Matsudo et al.18. Information on
self-reported health and their state of health when compared to their friends and family’s health were obtained. The number of diseases (morbidity) was classified into three categories (“1-2”, “3-4” and “5 and more”). The hypertension (HBP) was defined according to the history of the condition referred to by the doctor, or by an average of three consecutive measurements of blood pressure ≥ 140 x 90 mmHg for the measurements of systolic and diastolic pressure, respectively, or by regular use of antihypertensive medication19. The measurements were taken
in the portable sphygmomanometers by Geratherm (Geratherm Medical AG, Geschwenda, Germany), which was classified in a dichotomous way “yes/no”. The diabetes mellitus was also rated in a dichotomous way “yes/no”, according to the medical history (previously diagnosed diabetes), and the ones who were unaware of the condition underwent an oral glucose tolerance test (OGTT). The glucose (mg/dL) were measured in capillary blood by the method of colorimetry by reflectance, through mobile handsets by Accutrend brand (Roche Diagnostics GmbH, Mannheim, Germany) at two moments: after 12 hours fasting and 2 hours after the ingestion of a standard solution containing 75 grams of pure glucose. The cutoff for the diagnosis followed the recommendations of the World Health Organization for the glucose measurements in capillary blood20.
Participants were also asked about their history of hospitalization within the two years preceding the interview, and this variable was classified into two categories: “no/yes”.
data proceSSing
Data collection was performed by applying structured interviews in the homes of the eligible people by a staff of interviewers trained and experienced in the fieldwork of epidemiological studies. Before the definitive typing of the information, which was developed from double data entry, the quality control of the information was assessed through the replication of 12.5% of all interviews. As a measure of reproducibility for the variables included in the replication, the Kappa statistic was used21, reaching the
StatiStical analySiS
In the descriptive phase the prevalence of access to health services were estimated by score points and 95% conidence intervals (95%CI) according to sociodemographic, behavioral and health-related variables. At this stage, global associations were deined from the respective statistical values of “F”, adopting a level of signiicance of α = 0.0522.
In the analytical phase the Poisson regression23 was used to obtain the crude and adjusted
prevalence ratios (PR), which were estimated by score points and 95%CI. The inal models consisted on the casting of variables that, after simultaneous adjustment, presented p < 0.05. All analysis were carried out using the Stata software, version 10.1 for Windows. The calculation of all estimates took into account the efect of the sampling design (def ) using, for such, speciic commands in Stata. All estimates were stratiied by gender.
The EPIDCV project was approved by the Research Ethics Committee of the School of Nursing of Ribeirão Preto, Universidade de São Paulo and filed under No. 0725/2006. All participants signed a consent form, as recommended by the Resolution No. 196/96 of the National Health Council.
rEsuLts
Regarding the characteristics of the sample (Table 1), the average age for men was 45.69 years of age and 47.97 for women. As for education, 57.86% of men and
54.23% of women had levels of formal schooling ≥ 08 years. Among men, most of
them (66.31%) had a family income of ≥ $ 700.00, while among women, only 27.92%
belonged to that stratum. This difference in socioeconomic level in relation to gender can also be detected for the IERP, observing from the 4th fifth of this indicator, the greater concentration of men and the diluted proportion of women, a fact also observed in the working condition scenario, with 82% of men and 54% of women reporting paid work in the previous month. The effect of the sampling design of the study (deff ) was equivalent to 1.01581.
As to sociodemographic factors (Table 2) it is observed that the prevalence of use of health services was higher among women, in all age groups, and among men, it was directly related to age and indication of linear gradient. In both sexes, the respective prevalence declined with education, especially among men, as it was in relation to the IERP. Among those who had paid work (working condition), their respective prevalence was 44.39% for males and 71.97% for females. The age, income, IERP and working condition variables showed global association with the outcome only for males (p < 0.05).
Table 1. Study population characteristics. Ribeirão Preto, São Paulo, Brazil, 2007. EPIDCV Project.
Male (nw = 995.7) Female (nw = 1475.0)
% Median 95%CI % Median 95%CI
Age (in years) 45.69 43.95 – 47.24 47.97 46.73 – 49.30
30 – 39 34.03 29.20 – 38.86 21.85 18.04 – 25.66
40 – 49 27.78 23.48 – 32.07 33.15 29.58 – 36.72
50 – 59 18.79 15.60 – 21.99 21.70 18.24 – 25.16
60 and more 19.39 15.33 – 23.44 23.28 19.78 – 26.78
School education (in years)
0 – 3 11.86 08.20 – 15.51 15.53 12.31 – 18.75
4 – 7 30.27 25.18 – 35.36 30.22 26.04 – 34.41
8 and more 57.86 51.30 – 64.42 54.23 48.97 – 59.50
Individual income (in R$) 1200.00 1000.00 – 1300.00 628.00 596.00 – 669.00
No income 17.12 13.26 – 20.98 45.98 42.51 – 49.45
1º third (50.00 – 700.00) 16.56 12.49 – 20.63 26.08 22.58 – 29.57
2º third
(700.00 – 1,400.00) 29.96 24.92 – 34.99 14.07 11.36 – 16.78
3º third (> 1,400.00) 36.35 30.13 – 42.57 13.85 10.77 – 16.94
Economic Indicator of
Ribeirão Preto (IERP) 628 596 – 669 597 576 – 625
1º ith (≤ 413.2) 16.94 12.32 – 21.55 20.51 16.83 – 24.19
2º ith (413.3 – 544) 18.95 14.84 – 23.05 19.72 16.27 – 23.18
3º ith (544.1 – 684) 17.28 13.48 – 21.09 20.02 17.07 – 22.97
4º ith (684.1 – 823.6) 22.74 18.80 – 26.68 17.79 14.36 – 21.23
5º ith (> 823.6) 24.06 17.36 – 30.77 21.93 16.47 – 27.39
Marital status
Without a partner 25.85 21.31 – 30.38 38.46 34.27 – 42.64
With a partner 74.14 69.61 – 78.68 61.53 57.35 – 65.72
Work condition
No 17.53 13.73 – 21.32 45.63 42.13 – 49.13
Yes 82.46 78.67 – 86.26 54.36 50.86 – 57.86
Table 2. Health services access prevalence and 95% conidence intervals according gender and socio-demographic status. Ribeirão Preto, São Paulo, Brazil, 2007. EPIDCV Project.
Male (nw = 995.7) Female (nw = 1475.0)
Access Access
No
% (95%CI)
Yes
% (95%CI)
No
% (95%CI)
Yes
% (95%CI)
Age (years)*
30 – 39 (52.78 – 69.04)61.23 (30.96 – 47.22)38.77 (18.57 – 38.27)27.33 (61.73 – 81.43)72.67
40 – 49 (41.08 – 60.94)51.05 (39.06 – 58.92)48.95 (24.37 – 38.87)31.16 (61.13 – 75.63)68.84
50 – 59 (32.03 – 59.64)45.49 (40.36 – 67.97)54.51 (12.16 – 28.17)18.90 (71.83 – 87.84)81.10
60 and more (21.55 – 43.22)31.38 (56.78 – 78.45)68.62 (13.58 – 29.73)20.50 (70.27 – 86.42)79.50
School education (years)
0 – 3 (35.26 – 61.89)48.47 (38.11 – 64.74)51.53 (11.10 – 27.00)17.69 (73.00 – 88.90)82.31
4 – 7 (35.47 – 51.87)43.50 (48.13 – 64.53)56.50 (18.74 – 31.89)24.73 (68.11 – 81.26)75.27
8 and more (47.16 – 63.07)55.25 (36.93 – 52.84)44.75 (21.61 – 36.38)28.42 (63.62 – 78.39)71.58
Individual income, in tertiles (R$)*
No income (15.12 – 35.25)23.75 (64.75 – 84.88)76.25 (16.80 – 28.97)22.30 (71.03 – 83.20)77.77
1º third (50.00 – 700.00) (35.88 – 54.68)45.11 (45.32 – 64.12)54.89 (19.03 – 34.19)25.90 (65.81 – 80.97)74.10
2º third (700.00 – 1,400.00) (39.93 – 58.10)48.98 (41.90 – 60.07)51.02 (23.21 – 45.74)33.54 (54.26 – 76.79)66.46
3º third (> 1,400.00) (60.15 – 78.26)69.98 (21.74 – 39.85)30.02 (15.63 – 43.34)27.35 (56.66 – 84.37)72.65
Economic indicator of Ribeirão Preto, in quintiles*
1º ith (≤ 413.2) (30.34 – 51.19)40.33 (48.81 – 69.66)59.67 (15.62 – 30.25)22.08 (69.75 – 84.38)77.92
2º ith (413.3 – 544) (31.26 – 52.42)41.45 (47.58 – 68.74)58.55 (12.00 – 29.23)19.18 (70.77 – 88.00)80.82
3º ith (544.1 – 684) (31.56 – 53.75)42.26 (46.25 – 68.44)57.74 (16.82 – 33.48)24.18 (66.52 – 83.18)75.82
4º ith (684.1 – 823.6) 55.45 (42.51-67.69)
44.55
(32.31 – 57.49)
26.79 (18.41 – 37.26)
73.21 (62.74 – 81.59)
5º ith (> 823.6) (62.63 – 86.45)76.58 (13.55 – 37.37)23.42 (23.88 – 52.43)37.03 (47.57 – 76.12)62.97
hypertension, diabetes mellitus, and history of hospitalization over the last 2 years. In males, the variables: average daily sitting down time (min/day), self-reported health, health status when compared to friends and family, morbidity, hypertension, and history of hospitalization over the past two years showed overall association with the outcome (p < 0.05). In females, statistically significant global associations were found for the variables: self-reported health, health status when compared to family, morbidity, hypertension, diabetes mellitus, and history of hospitalization over the last two years.
Respectively, in Tables 4 and 5, crude and adjusted prevalence ratios for males and females are presented. For males (Table 4), after simultaneous adjustment, the variables: age, education, income, IERP, average daily sitting down time, diabetes mellitus, and history of hospitalization over the last two years had an independent effect on the outcomes; and the prevalence ratios for education, income and IERP presented a statistically significant linear trend (p < 0.05). The PR for education had a direct relation to the outcome and an inverse relation to the individual income and the IERP. In the second quarter of time sitting down (154.4 – 240 min/day) the PRs indicated a protective effect, in relation to the outcome. The PRs for hypertension, diabetes and hospital were, respectively, 24, 34 and 60% higher than the respective reference categories.
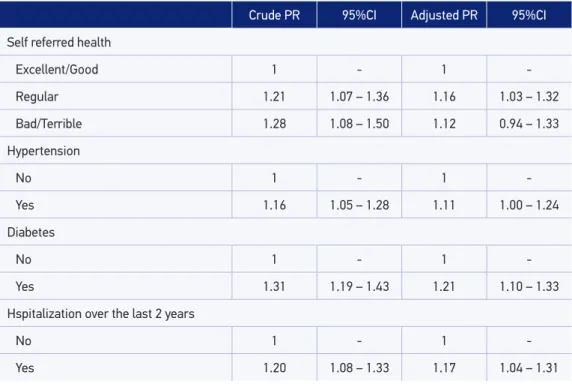
In females (Table 5), remained in the final models the following variables: self-reported health, hypertension, diabetes, and history of hospitalization over the last two years. Among women, the PR for diabetes, hypertension, and history of hospitalization were respectively 11, 21 and 17% higher than the respective reference categories.
Male (nw = 995.7) Female (nw = 1475.0)
Access Access
No
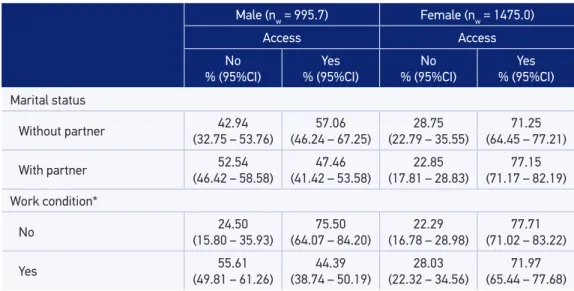
% (95%CI) % (95%CI)Yes % (95%CI)No % (95%CI)Yes Marital status
Without partner 42.94
(32.75 – 53.76) (46.24 – 67.25)57.06 (22.79 – 35.55)28.75 (64.45 – 77.21)71.25
With partner (46.42 – 58.58)52.54 (41.42 – 53.58)47.46 (17.81 – 28.83)22.85 (71.17 – 82.19)77.15
Work condition*
No 24.50
(15.80 – 35.93) (64.07 – 84.20)75.50 (16.78 – 28.98)22.29 (71.02 – 83.22)77.71
Yes (49.81 – 61.26)55.61 (38.74 – 50.19)44.39 (22.32 – 34.56)28.03 (65.44 – 77.68)71.97
Table 3. Health services access prevalence and 95%conidence intervals according gender, behavioral and health related factors. Ribeirão Preto, São Paulo, Brazil, 2007. EPIDCV Project.
Male (nw = 995.7) Female (nw = 1475.0)
Access Access
No
% (95%CI)
Yes
% (95%CI)
No
% (95%CI)
Yes
% (95%CI) Smoking habit
Never smoked (45.28 – 62.71)54.12 (37.29 – 54.72)45.88 (20.51 – 32.54)26.08 (67.46 – 79.49)73.92
Smoker 54.42
(44.00 – 64.46) (35.54 – 56.00)45.58 (20.57 – 38.30)28.62 (61.70 – 79.43)71.38
Former smoker (31.46 – 49.19)40.00 (50.81 – 68.54)60.00 (13.07 – 27.19)19.16 (72.81 – 86.93)80.84
Alcohol Consumption
Not addicted (0 – 7) (43.51 – 56.98)50.25 (43.02 – 56.49)49.75 (20.94 – 30.38)25.37 (69.62 – 79.06)74.63
Addicted (8 – 40) (40.74 – 57.47)49.08 (42.53 – 59.26)50.92 (14.94 – 40.15)25.55 (59.85 – 85.06)74.45
Physical activity pattern
Insuiciently active (15.06 – 54.41)31.51 (45.59 – 84.94)68.49 (34.00 – 41.14)13.56 (58.86 – 96.60)86.44
Active (40.17 – 60.05)50.12 (39.95 – 59.83)49.88 (17.98 – 36.45)26.18 (63.55 – 82.02)73.82
Very active (43.76 – 57.95)50.87 (42.05 – 56.24)49.13 (20.78 – 30.79)25.46 (69.21 – 79.22)74.54
Daily average sitting down time in a week (min/day)*
1º fourth (15 – 154.3) (32.96 – 53.84)43.10 (46.16 – 67.04)56.90 (17.48 – 34.20)24.91 (65.80 – 82.52)75.09
2º fourth (154.4 – 240) (50.31 – 67.97)59.44 (32.03 – 49.69)40.56 (19.97 – 34.01)26.39 (65.99 – 80.03)73.61
3º fourth (240.1 – 360) (41.43 – 65.88)53.89 (34.12 – 58.57)46.11 (14.80 – 34.51)23.22 (65.49 – 85.20)76.78
4º fourth (> 360) (31.86 – 52.18)41.67 (47.82 – 68.14)58.33 (19.66 – 33.79)26.11 (66.21 – 80.34)73.89
Self-referred health*†
Excellent/Good (47.21 – 59.53)53.43 (40.47 – 52.79)46.57 (25.30 – 38.22)31.40 (61.78 – 74.70)68.60
Regular (34.38 – 54.80)44.35 (45.20 – 65.62)55.65 (12.45 – 22.98)17.08 (77.02 – 87.55)82.92
Bad/Terrible (01.71 – 57.72)13.37 (42.28 – 98.29)86.63 (04.62 – 29.72)12.52 (70.28 – 95.38)87.48
Male (nw = 995.7) Female (nw = 1475.0)
Access Access
No
% (95%CI)
Yes
% (95%CI)
No
% (95%CI)
Yes
% (95%CI)
Health status when compared to friends*
Equal (46.05 – 60.36)53.27 (39.64 – 53.95)46.73 (21.58 – 34.99)27.79 (65.01 – 78.42)72.21
Worse (41.88 – 60.79)51.39 (39.21 – 58.12)48.61 (20.80 – 33.44)26.65 (66.56 – 79.20)73.35
Better (11.64 – 39.46)22.66 (60.54 – 88.36)77.34 (08.87 – 24.56)15.11 (75.44 – 91.13)84.89
Health estatus when compared to family*†
Equal (50.27 – 63.17)56.83 (36.83 – 49.73)43.17 (23.36 – 37.50)29.95 (62.50 – 76.64)70.05
Worse (28.60 – 56.19)41.75 (43.81 – 71.40)58.25 (24.07 – 40.49)31.72 (59.51 – 75.93)68.28
Better (31.37 – 51.24)40.94 (48.76 – 68.63)59.06 (11.57 – 23.52)16.71 (76.48 – 88.43)83.29
Number of morbitidies*†
None (48.57 – 67.33)58.25 (32.67 – 51.43)41.75 (28.05 – 51.62)39.21 (48.38 – 71.95)60.79
1 – 2 (45.40 – 61.14)53.35 (38.86 – 54.60)46.65 (23.41 – 39.55)30.90 (60.45 – 76.59)69.10
3 – 4 42.29
(31.53 – 53.83) (46.17 – 68.47)57.71 (15.32 – 27.40)20.72 (72.60 – 84.68)79.28
5 and more 10.75
(03.16 – 30.74)
89.25 (69.26 – 96.84)
13.59
(07.19 – 24.19)
86.41 (75.81 – 92.81) Hypertension*†
No (50.25 – 62.34)56.39 (37.66 – 49.75)43.61 (25.23 – 36.62)30.63 (63.38 – 74.77)69.37
Yes 36.15
(27.39 – 45.93) (54.07 – 72.61)63.85 (14.32 – 25.79)19.42 (74.21 – 85.68)80.58
Diabetes†
No (48.89 – 60.62)54.82 (39.38 – 51.11)45.18 (25.00 – 35.22)29.86 (64.78 – 75.00)70.14
Yes (28.49 – 54.55)40.88 (45.45 – 71.51)59.12 (04.28 – 15.79)08.39 (84.21 – 95.72)91.61
Hospitalization over the last 2 years*†
No (49.87 – 61.85)55.95 (38.15 – 50.13)44.05 (23.22 – 32.78)27.75 (67.22 – 76.78)72.25
Yes (08.95 – 30.98)17.36 (69.02 – 91.05)82.64 (07.26 – 22.41)13.08 (77.59 – 92.74)86.92
*p < 0.05 for F statistic – male; †p < 0.05 for F statistic – female; n
w: weighted sample.
Table 4. Crude and adjusted prevalence ratios and 95% conidence intervals in male. Ribeirão Preto, São Paulo,Brazil, 2007. EPIDCV Project.
Crude PR 95%CI Adjusted PR 95%CI
Age (years)
30 – 39 1 - 1
-40 – 49 1.26 0.94 – 1.70 1.52 1.15 – 2.00
50 – 59 1.41 1.02 – 1.95 1.50 1.01 – 2.25
60 and more 1.77 1.35 – 2.33 1.53 1.05 – 2.24
School education (years)
0 – 3 1 - 1*
-4 – 7 1.10 0.81 – 1.48 1.32 1.02 – 1.71
8 and more 0.87 0.62 – 1.21 1.48 1.10 – 1.99
Individual income, in tertiles (R$)
No income 1 - 1*
-1º third (50.00 – 700.00) 0.72 0.58 – 0.90 1.07 0.79 – 1.43 2º third (700.00 – 1,400.00) 0.67 0.53 – 0.84 0.97 0.69 – 1.36
3º third (> 1,400.00) 0.39 0.29 – 0.54 0.50 0.32 – 0.78
Economic indicator of Ribeirão Preto, in quintiles
1º ith (≤ 413.2) 1 - 1*
-2º ith (413.3 – 544) 0.98 0.75 – 1.29 1.08 0.80 – 1.43
3º ith (544.1 – 684) 0.97 0.74 – 1.26 0.96 0.70 – 1.33
4º ith (684.1 – 823.6) 0.75 0.54 – 1.03 0.85 0.61 – 1.18
5º ith (> 823.6) 0.39 0.23 – 0.66 0.49 0.28 – 0.85
Average daily sitting down time in a week (min/day)
1º fourth (15 – 154.3) 1 - 1
-2º fourth (154.4 – 240) 0.71 0.54 – 0.95 0.68 0.51 – 0.90
3º fourth (240.1 – 360) 0.81 0.58 – 1.14 0.88 0.62 – 1.25
4º fourth (> 360) 1.03 0.79 – 1.34 1.05 0.81 – 1.35
Hypertension
No 1 - 1
-Yes 1.46 1.20 – 1.78 1.24 0.96 – 1.59
Diabetes
No 1 - 1
-Yes 1.31 1.01 – 1.69 1.34 1.06 – 1.69
Hospitalization over the last 2 years
No 1 - 1
-Yes 1.88 1.55 – 2.27 1.60 1.32 – 1.94
Table 5. Crude and adjusted prevalence ratios and 95% conidence intervals in female. Ribeirão Preto, São Paulo, Brazil, 2007. EPIDCV Project.
Crude PR 95%CI Adjusted PR 95%CI
Self referred health
Excellent/Good 1 - 1
-Regular 1.21 1.07 – 1.36 1.16 1.03 – 1.32
Bad/Terrible 1.28 1.08 – 1.50 1.12 0.94 – 1.33
Hypertension
No 1 - 1
-Yes 1.16 1.05 – 1.28 1.11 1.00 – 1.24
Diabetes
No 1 - 1
-Yes 1.31 1.19 – 1.43 1.21 1.10 – 1.33
Hspitalization over the last 2 years
No 1 - 1
-Yes 1.20 1.08 – 1.33 1.17 1.04 – 1.31
RP: prevalence ratio.
dIscussIon
In the present study, the prevalence of use of health care services was higher among women than among men, in all age groups. In the multivariate models, the variables hypertension, diabetes mellitus and hospital admissions over the last two years remained independently associated with the outcome, in both gender, especially among men whose sociodemographic variables such as age, education and income, in addition to daily average sitting down time in min/day, also remained in the final model.
The methodological rigor adopted in the different stages of the study, as well as the high response rate (82.1%) allow one to assume that the findings were not a result of the selection, confusion or measurement bias.
In the present study, the highest prevalence of access to health services in females, as well as an increased demand with the advancing age, confirms similar results reported in literature27-31. Garbinato et al.32, in an epidemiological population-based study (n = 1,954) conducted, between 2002 and 2003 in Canoas, metropolitan region of Porto Alegre, Rio Grande do Sul, reported that the age range between 60 years of age or older showed a prevalence ratio of high magnitude and statistically significant association with the use of health services (PR = 4.14; 95%CI 2.07 – 8.25). Lima-Costa et al.33 claim that it is not age itself that determines the use of medical services, but the health condition instead, especially the prevalence of chronic diseases. Indeed, in this study, the adjustment for age did not withdraw the strength of association with the outcome variables: hypertension, diabetes mellitus and hospitalization.
Mendoza-Sassi et al.34 point out that studies carried out in several countries indicate that women in fertile age have a higher prevalence of access to health services, due to gynecological and obstetric problems . Moreover, they perceive more easily the health risks than men, because they have greater access to these information5. According to Verbrugge and Wingard35, inequalities in the profile of health service utilization are not attributed only to reproductive health issues. Women tend to consider their health in a more negative way and they also report greater number of chronic diseases, while men, when looking for medical assistance, have more severe and lethal diseases. To Bastos et al.9, men seek the health system mainly by means of specialized care resulting from worsening or complications of the disease, as a consequence of the delay in care in previous levels of attention and, therefore, generating a greater cost to the health system.
As to the income, the findings presented here confirm those of Dias-da-Costa et al.29, who detected high prevalence of medical consultation in individuals of lower socioeconomic status (inverse relation to the outcome). However, some studies indicate that the use of medical services is higher among those of higher socioeconomic status, favoring the most privileged layers8,10,26,27,31.
In this study, education presented direct relation and independent association with the use of health services, only in males. Capilheira and Santos8 reveal controversies in the relation between education and the use of services. According to these authors, the increase on education sometimes contributes to the increase in demand, and sometimes it does not influence it, as also reported by Costa and Facchini27, who found a statistically significant association between low education (illiterate) and the use of medical services (OR = 4.50; 95%CI 1.47 – 13.77).
of work”, lost statistical signiicance: inactive (PR = 1.23; 95%CI 0.95 – 1.58); informal/ self-employed (PR = 1.09; 95%CI 0.75 – 1.58) and unemployed (PR = 1.03; 95%CI 0.64 – 1.67). In this study, the variable “condition of work” was not part of the inal models (p > 0.05) in both gender, probably in order to, on one hand, include the variables related to socioeconomic status, such as individual income and the IERP in males, but mainly due to the strength of the association with outcome variables such as hypertension, diabetes mellitus and hospitalization history.
As for behavioral factors, the results presented here are similar to those reported by other authors. In both gender, the prevalence of use of services was higher among former smokers, which is consistent with the findings of Costa et al.26, though smoking did not remain in the final models. Capilheira and Santos8 also observed that the prevalence of medical consultations was higher among former smokers (60.4%) and their respective prevalence ratio was statistically significant (PR = 1.12; 95%CI 1.04 – 1.48) in partial adjustment models (behavioral and health-related variables), with the exception of the sociodemographic variables. The highest prevalence of demand for health services among former smokers may be a reflection of reverse causality bias, under the assumption that access to health services may have led to the interruption of the habit, especially in people with diseases associated with smoking . If, on the one hand, the bias of reverse causality constitutes a limitation inherent to cross-sectional studies, the “directionality” of effect of the variables that remained in the final models presented here does not seem to result from this bias.
In relation to alcohol consumption, the prevalence of use of the services was higher among addicted males, although this variable did not remain in the final models, in both gender. These results are consistent with the findings obtained by Costa et al.26. Boing et al.10 reported that alcohol addiction was associated to the use of health services (PR = 1.12; 95%CI 1.01 – 1.23) in multivariate models, in which were included sociodemographic, behavioral and health-related variables. On the other hand, Costa and Facchini27 found that people who consumed alcoholic beverages consistently showed lower frequency of medical consultations, possibly due to poor results regarding the service and/or the need for specific programs to increase its uptake.
have contributed to the reduction of the statistical power of the study, different sets of factors associated to the search for health services, in both men and women, justify the application of modeling techniques stratified by gender.
The results of this study suggest four relevant questions: (1) significant differences in the demand for health services evidence women among the ones who consume these services the most, which may result not only from their greater perception of health status, but also from the historic setting of primary care services which, in Brazil, still prioritizes maternal and child care; (2) although sociodemographic variables are associated with the seek for health services, among men, it did not become evident among women, which may certainly be due to the indiscriminate demand for these services by women, regardless of age, education and income; (3) as to the search for health services, 60% of the demand, among men, is associated to hospitalizations, against only 17% among women, a fact that reinforces the findings of Verbrugge and Wingard35, in the sense that men tend to search for ambulatory services due to diseases in more advanced states or of worse prognosis; and (4) as for the weight of different sets of gender-specific factors, associated to the use of the health services, chronic events such as hypertension and diabete mellitus, next to hospitalization history, remain independently associated to the outcomes, in both gender.
From what was exposed, it appears that the planning of health care on an ambulatory level, especially regarding primary care, should include strategies to attract males, through the development of specific actions that could serve to stimulate primary prevention of chronic diseases such as the standardization of screening for prostate cancer, similar to the established routines for the Pap test. These initiatives, certainly, besides contributing to the primary prevention of prostate cancer could also contribute to the primary or secondary prevention of hypertension and diabetes mellitus in this population stratum, minimizing individual and collective consequences of cardiovascular diseases, such as the ischemic heart disease and strokes.
The progressive increase in the prevalence of diabetes and hypertension, which, by themselves, constitute risk factors for ischemic heart disease and stroke, reflects the progressive population aging in Brazil as a whole, and especially in southeastern Brazil, including Ribeirão Preto, as recently reported by Moraes and Freitas36 and Moraes et al.37.
concLusIon
1. Omran AR. The epidemiologic transition in the Americas. Maryland: Pan American Health Organization; 1996.
2. Costa AJL. Metodologias e indicadores para avaliação da
capacidade funcional: análise preliminar do Suplemento Saúde da Pesquisa Nacional por Amostra de Domicílios - PNAD, Brasil, 2003. Ciênc Saúde Coletiva 2006; 11(4): 927-40.
3. Brasil. Ministério da Saúde. Política de saúde do idoso. Portaria nº 1395/GM, de 10/12/1999. Disponível em www.bvseps.icict.iocruz.br/lildbi/docsonline/get. php?id=2173. (Acessado em 01 de novembro de 2013).
4. Travassos C, Oliveira EXG, Viacava F. Desigualdades
geográicas e sociais no acesso aos serviços de saúde no Brasil: 1998 e 2003. Ciênc Saúde Coletiva 2006; 11(4): 975-86.
5. Pinheiro RS, Viacava F, Travassos C, Brito AS. Gênero,
morbidade, acesso e utilização de serviços de saúde no Brasil. Ciênc Saúde Coletiva 2002; 7(4): 687-707.
6. Uglert C. Territorialização em sistemas de saúde.
In: Mendes E. Distrito sanitário: o processo social de mudança das práticas sanitárias do Sistema Único de Saúde. 4ª ed. São Paulo: Hucitec; Rio de Janeiro: Abrasco, 1999, p. 221-36.
7. Almeida MF, Barata RB, Monteiro CV, Silva ZP.
Prevalência de doenças crônicas auto-referidas e utilização de serviços de saúde, PNAD/1998, Brasil. Ciênc Saúde Coletiva 2002; 7(4): 743-56.
8. Capilheira MF, Santos IS. Fatores individuais associados à utilização de consultas médicas por adultos. Rev Saúde Pública 2006; 40(3): 436-43.
9. Bastos GAN, Del Duca GF, Hallal PC, Santos IS.
Utilização de serviços médicos no sistema público de saúde no Sul do Brasil. Rev Saúde Pública 2011; 45(3): 475-84.
10. Boing AF, Matos IB, Arruda MP, Oliveira MC, Njaine K.
Prevalência de consultas médicas e fatores associados: um estudo de base populacional no Sul do Brasil. Rev Assoc Med Bras 2010; 56(1): 41-6.
11. IBGE – Instituto Brasileiro de Geograia e Estatística.
Censo Demográico 2000. Rio de Janeiro; 2000.
12. Silva NN. Amostragem Probabilística: um curso
introdutório. São Paulo: EDUSP; 2001.
13. Freitas ICM, Moraes SA. Peril econômico da população
de Ribeirão Preto: aplicação do Indicador Econômico Nacional. Rev Saúde Pública 2010; 44(6): 1150-4.
14. Barros AJD, Victora CG. Indicador econômico para
o Brasil baseado no censo demográico de 2000. Rev Saúde Pública 2005; 39(4): 523-9.
15. Organización Mundial de la Salud. Cuestionario de
identiicación de los trastornos debidos al consumo de alcohol – AUDIT; 2001. Disponível em www.who. int/substance.../AUDITmanualSpanish.pdf. (Acessado em 01 de novembro de 2013).
16. Lima CT, Freire AC, Silva AP, Teixeira RM, Farrel M,
Prince M. Concurrent and construct validity of the AUDIT in a urban brasilian sample. Alcohol Alcohol 2005; 40(6): 584-89.
17. Craig CL, Marshall AL, Sjostrom M, Bauman AE,
Booth ML, Pratt M, et al. International physical activity questionnaire: 12-country reliability and validity. Med Sci Sports Exerc 2003; 35(8): 1381-95.
18. Matsudo S, Araújo T, Matsudo V, Andrade D, Andrade
E; Oliveira LC et al. Questionário Internacional de atividade física (IPAQ): estudo de validade e reprodutibilidade no Brasil. Rev Bras Ativ Fis Saúde 2001; 6(2): 5-18.
19. Moraes SA, Szklo M, Knopman D, Sato R. The
relationship between temporal changes in blood pressure and changes in cognitive function: atherosclerosis risk in communities (ARIC) study. Prev Med 2002; 35(3): 258-63.
20. World Health Organization (WHO). Definition,
diagnosis and classiication of diabetes mellitus and its complications: report of a WHO consultation. Geneva: WHO; 1999.
21. Fermanian JH. Mesure de l’accord entre deux juges:
cas quantitatif. Rev Epidemiol Santé Publ 1984; 32(6): 408-13.
22. Skinner CJ, Smith TMF. Analysis of complex surveys.
Chichester: John Willey and Sons; 1989.
23. Barros AJ, Hirakata VN. Alternatives for logistic regression in cross-sectional studies: an empirical comparison of models that directly estimate the prevalence ratio. BMC Med Res Methodol 2003; 3: 21.
24. Santos IS, Victora CG. Serviços de saúde: epidemiologia, pesquisa e avaliação. Cad Saúde Pública 2004; 20 (Suppl 2): S337-41.
25. Novaes HMD. Epidemiologia e avaliação em serviços
de atenção médica: novas tendências na pesquisa. Cad Saúde Pública 1996; 12 (Suppl 2): 7-12.
26. Costa JSD, Reis MC, Filho CVS, Linhares RS, Piccinini
F. Prevalência de consultas médicas e fatores associados, Pelotas (RS), 1999-2000. Rev Saúde Pública 2008; 42(6): 1074-84.
28. Fernandes LCL, Bertoldi AD, Barros AJD. Utilização dos serviços de saúde pela população coberta pela Estratégia de Saúde da Família. Rev Saúde Pública 2009; 43(4): 595-603.
29. Dias-da-Costa JS, Olinto MTA, Soares AS, Nunes MF,
Bagatini T, Marques SC, et al. Utilização de serviços de saúde pela população adulta de São Leopoldo, Rio Grande do Sul, Brasil: resultados de um estudo transversal. Cad Saúde Pública 2011; 27(5): 868-76.
30. Goldbaum M, Gianini RJ, Novaes HMD, César CLG.
Utilização de serviços de saúde em áreas cobertas pelo programa saúde da família (Qualis) no Município de São Paulo. Rev Saúde Pública 2005; 39(1): 90-9.
31. Moreira JPL, Moraes JR, Luiz RR. Utilização de
consulta médica e hipertensão arterial sistêmica nas áreas urbanas e rurais do Brasil, segundo dados da PNAD 2008. Cienc Saúde Coletiva 2011; 16(9): 3781-93.
32. Garbinato LR, Béria JU, Figueiredo ACL, Raymann B,
Gigante LP, Palazzo LS, et al. Prevalência de internação hospitalar e fatores associados: um estudo de base populacional em um centro urbano no Sul do Brasil. Cad Saúde Pública 2007; 23(1): 217-24.
33. Lima-Costa MF, Barreto SM, Giatti L. Condições
de saúde, capacidade funcional, uso de serviços de
saúde e gastos com medicamentos da população idosa brasileira: um estudo descritivo baseado na Pesquisa Nacional por Amostra de Domicílios. Cad Saúde Pública 2003; 19(3): 735-43.
34. Mendoza-Sassi R, Béria JU, Barros AJD. Fatores
associados à utilização de serviços ambulatoriais: estudo de base populacional. Rev Saúde Pública 2003; 37(3): 372-8.
35. Verbrugge LM, Wingard DL. Sex diferentials in health
and mortality. Women Health 1987; 12(2): 103-45.
36. Moraes SA, Freitas ICM. Doença isquêmica
do coração e fatores associados em adultos de Ribeirão Preto, SP. Rev Saúde Pública 2012; 46(4): 591-601.
37. Moraes SA, Freitas ICM, Gimeno SGA, Mondini
L. Prevalência de diabetes mellitus e identiicação de fatores associados em adultos residentes em área urbana de Ribeirão Preto, São Paulo, Brasil, 2006: Projeto OBEDIARP. Cad Saúde Pública 2010; 26(5): 929-41.
Received on: 04/19/2013