DOI: http://dx.doi.org/10.5007/1980-0037.2013v15n1p49
original article
RBCDH
1 Universidade de São Paulo. Es-cola de Educação Física e Esporte. Grupo de Estudos e Pesquisa em Planejamento e Monitoramento do Treinamento Físico e Esportivo. São Paulo, SP. Brasil.
2 Universidade de São Paulo. Escola de Artes, Ciências e Humanidades. Grupo de Pesquisa em Adaptações Biológicas ao Exer-cício Físico. São Paulo, SP. Brasil. 3 Universidade Estadual de Lon-drina. Departamento de Educação Física. Grupo de Estudo das Adap-tações Fisiológicas ao Treinamen-to. Londrina, PR. Brasil.
Received: 21 March 2012 Accepted: 06 August 2012
Training load, stress tolerance and upper
respiratory tract infection in basketball
players
Carga interna, tolerância ao estresse e infecções do trato
respiratório superior em atletas de basquetebol
Camila Gobo Freitas1
Marcelo Saldanha Aoki2
Ademir Felipe Schultz Arruda1
Fábio Yuzo Nakamura3
Alexandre Moreira1
Abstract– he present study aimed to investigate the efect of external training load manipulation on internal training load (ITL), stress tolerance (ST) and upper respiratory tract infection (URTI) severity in basketball players during a 19-week macrocycle. he macrocycle was divided into three distinct phases: preparatory phase (P1) and two com-petitive phases (P2 and P3). he Daily Analysis of Life Demands for Athletes questionnaire (DALDA), for assessment of sources and symptoms of stress, and the Wisconsin Upper Respiratory Symptom Survey (WURSS-21), for evaluation of URTI severity, were used on a weekly basis. he ITL was assessed by Rating of Perceived Exertion (session RPE). here was a decrease in ITL at P3 when compared to P1 and P2 (p < 0.05). A decrease in “better than normal” responses in DALDA for both sources and symptoms of stress was observed at P2 and P3 when compared to P1 (p < 0.05). here was also a signiicant increase in URTI severity. In addition, signiicant relationships between ST and URTI were shown at P3, suggesting that stress tolerance may modulate URTI severity. In summary, ETL manipulation induced changes in ITL. However, unlike the initial hypothesis, a decrease in ITL during the competitive period was followed by a decrease in stress tolerance and an increase in URTI severity. Furthermore, the magnitude of stress seems to provoke an increase in URTI severity.
Key words:Immunity; Monitoring; Sport; Stress; Training.
INTRODUCTION
Sports training is a systematic activity that aims to promote morpho-functional adaptations responsible for increased athletic performance1,2. In recent years, many theoretical models have been proposed in order to
explain the complex sports training process2-4. Among these models, the
one proposed by Impellizzeri et al.5 has guided numerous training monitor-ing approaches in team sports. he authors suggest that trainmonitor-ing-induced adaptations are due to the level of stress imposed on the body (internal training load - ITL), which will be largely determined by external training load (ETL) (content of the prescribed training). External load is related to the training quality (intensity), quantity (volume) and periodization (organization).
In addition, the model proposed by Impellizzeri et al.5 emphasizes that individual characteristics (eg.: level of itness and genetic potential) and the individual’s ability to deal with stress have large inluence on ITL. hus, the interaction between ETL and individual characteristics determines the ITL magnitude, which will ultimately be the stimulus responsible for inducing desired adaptive responses and increase of performance.
In this context, it is reasonable to assume that the training process success depends on accurate monitoring of ITL. Several parameters can be used to assess the ITL magnitude and its repercussions, such as the hor-monal proile (testosterone/cortisol ratio), the concentration of metabolites (lactate and ammonia), the heart rate response and the Rating of Perceived Exertion (session RPE)6-10.
In team sports, the interaction between external load and internal load is even more complex than in individual sports. In team sports, the training load control is usually made through external indicators, such as duration of technical and tactical training, number of jumps performed in a session, load used in weight liting, among others11. However, in a team, the same ETL applied during a training session can induce diferent responses (ITL) on each of the athletes. Whereas the adaptive responses that result from the process of sports training depend on the physiological stress imposed on the body (ITL) by applying the ETL, on a practical perspective, ITL control during season2 is extremely important, especially in team sports, so the training program can be adjusted individually.
A simple, valid and sensitive instrument, which is currently being used as an indicator of ITL, is the Rating of Perceived Exertion (session RPE) 12-15. Relevant associations between ITL and other responses to the training
process (episodes of infection and stress tolerance)16-18 have been observed in recent studies conducted with athletes from diferent sports. In these studies, the Daily Analysis of Life Demands in Athletes questionnaire (DALDA), developed by Rushall19 to assess stress tolerance, and the
Wis-consin Upper Respiratory Symptom Survey-21 (WURSS-21)20, developed
Despite the importance of controlling the training process, there is not much information available from approaches that integrate responses related to training load, level of stress and immunity. Given the impor-tance of this issue, the aim of this study was to investigate the efect of ETL manipulation on ITL dynamics, stress tolerance and URTI episodes and severity in basketball athletes. his study raises the hypothesis that changing ETL during the macrocycle would also change ITL response, which could mediate stress tolerance and URTI severity.
METHODOLOGICAL PROCEDURES
Participants
We evaluated 20 male basketball professional athletes, members of a team that participates in an oicial qualifying tournament for the Paulista cham-pionship (mean and standard deviation for age, body mass and height of 22±5 years, 94±22 kg and 196±10 cm, respectively). he team reached the playofs and qualiied for the main division of the Paulista championship (A1). All athletes signed a consent form approved by the Research Ethics Committee of Escola de Educação Física e Esporte of Universidade de São Paulo, protocol No 2008/21.
Experimental Design
he athletes were monitored during a competitive season (irst macrocycle of the season), from January to June, totaling 186 training sessions. In each training unit (day), athletes performed, on average, two training sessions. For analysis of results, the competitive season was divided into three phases: Phase 1 (P1 - preparatory period - weeks 1 to 7), Phase 2 (P2 - competitive period 1 - weeks 8 to 13) and Phase 3 (P3 - competitive period 2 - week 14 to 19). Seventeen oicial games were held during the investigated macro-cycle (7 matches in P2 [5 wins and 2 losses] and 10 matches in P3 (4 wins and 3 losses in the second round and 2 wins and 1 loss in the irst round of the playofs). Table 1 shows examples of typical tasks performed in a microcycle for each phase.
During the entire period of the investigation, athletes lived in the team’s accommodation, so they were subjected to similar environmental sources of stress. his minimized some important external factors that might interfere with the investigation.
Internal Training Load (ITL)
To determine the ITL, the session RPE method was used12,14. he internal
Box 1. Example of main objectives and organization of tasks in training microcycles (week) for each phase of the macrocycle. Typical tasks in a training microcycle for each phase of the macrocycle
Mon. Wed. and Frid. Tue. Thu. and Sat.
P1
1st session: special strength training: multiple jumps, jumps with bar (60 to 80% of 1RM), deep jumps (60-70 cm).
2nd session: technical/tactical training: low com-plexity and moderate intensity - simple elements, technical fundamentals, low intensity movements, game system automation (positions, movements, etc.).
1st session: special strength training: exercises with “weights” and adapted of Olympic lifting and basic lifting (pulling, squatting, yank, pitch, bench press) exercises.
2nd session: technical/tactical training: low complex-ity and moderate intenscomplex-ity - simple elements, technical fundamentals, low intensity movements, game system automation (positions, movements, etc.).
P2
1st session: jumps with bar (20 to 30% of 1RM), low volume and acceleration and speed endurance exercises - with and without change of direction - pitch and yank (adapted from Olympic lifting) *Wed: pitches/”kicks”.
2nd session: technical/tactical training: emphasis on movement on the game system. *Mon: high volume and high intensity; Wed: game.
1st session: acceleration exercises, post-activation poten-tiation (eg.: bench press 90% of 1RM + pitches/”kicks” or passes); stabilizing exercises.
2nd session: technical/tactical training: emphasis on movement on the game system; *Tue.: technical/tactical training: preparation for the game; Thu.: day of. **Saturday, only one training session (strength, accelera-tion and technical/tactical training).
P3
1st session: acceleration exercises: low volume – with and without change of direction; yank; *Wed: pitches/”kicks”.
2nd session: *Mon. and Fri.: technical/tactical train-ing: emphasis on movement on the game system; *Wed.: game.
1st session: *Tue: bodybuilding exercises (bench press and pulling), passes with and without medicine Ball and pitches/”kicks” with varied movements.
2nd session: *Tue.: preparatory technical/tactical training for the game; *Thu.: day of.
**Saturday – game.
* Weeks with games on Wednesdays; **Weeks with games on Saturdays.
Questionnaire of Sources and Symptoms of Stress
he Portuguese version21 of DALDA was used. he questionnaire was
applied at the end of each week of investigation16. DALDA questionnaire
is divided into two parts, named A and B, which represent, respectively, sources and symptoms of stress. his instrument requires the athlete to qualify each variable in both parts of the questionnaire (A and B) as being “worse than normal”, “normal” or “better than normal”, according to their perception of each source or symptom of stress. “Worse than normal” and “better than normal” responses for both sources and symptoms of stress were retained for analysis.
Questionnaire of Symptoms of Upper Respiratory Tract Infection (URTI)
The Portuguese version21 of WURSS-2120 was used. The questionnaire
was applied at the end of each week of investigation. The severity of each reported symptom was rated on a 7 points “Likert” scale: 1 (very lightly), 3 (lightly), 5 (moderately) and 7 (severely). When a symptom was not present, the corresponding item on the questionnaire was filled in with 0 (zero). A general symptoms score was calculated by the sum of severity scores from the ten questions about symptoms and the nine questions about limitations, according to procedures
proposed by Spence et al.22 This score was retained for analysis and
Statistical Analysis
Initially, we performed normality and homoscedasticity tests in order to analyze data distribution and homogeneity. ANOVA with repeated measures was used to assess diferences between the three phases of the investigation (P1, P2 and P3) concerning: (a) internal training load, (b) sources of stress (Part A of DALDA questionnaire), (c) symptoms of stress (Part B of DALDA questionnaire), and (d) severity of URTI symp-toms (WURSS-21 responses). Regarding the sources and sympsymp-toms of stress, “better than normal” and “worse than normal” responses were analyzed separately. he severity of symptoms was calculated by the sum of severity scores from the ten questions about symptoms and the nine questions about limitations, according to procedures proposed by Spence et al.22 Bonferroni post hoc procedure was used when necessary. he correlation between the variables of interest (ITL, “better than nor-mal” and “worse than nornor-mal” responses in DALDA and URTI severity) was analyzed using Spearman correlation. he level of signiicance was set at 5% (p <0.05).
RESULTS
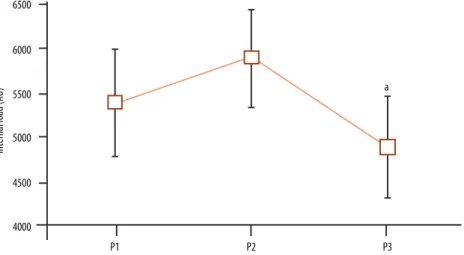
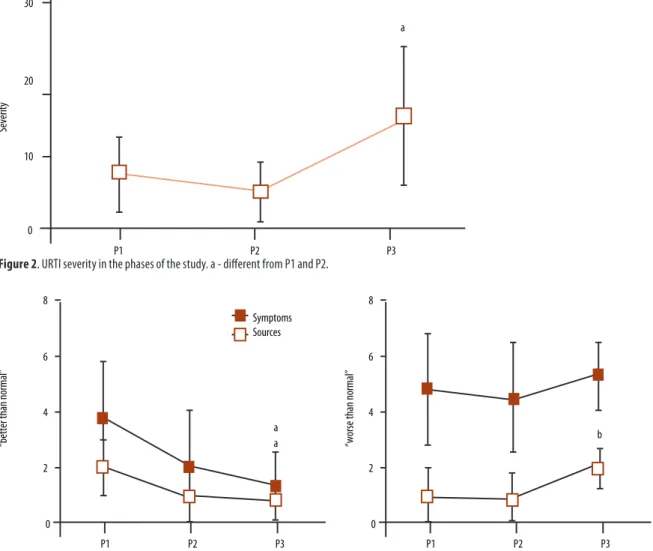
Figure 1 shows the ITL dynamics. A decrease in ITL was detected at P3 compared to P1 and P2. URTI severity and ST (“worse than normal” and “better than normal”) for the three phases of the study are shown in Figures 2 and 3, respectively. We observed an increase in URTI severity at P3 compared to P1 and P2. “Better than normal” responses for sources and symptoms of stress showed statistically sig-nificant differences between phases (F = 5.6 and F = 7.6, respectively) (Figure 3). We also observed a decrease in the number of “better than normal” responses for sources and symptoms of stress at P2 and P3 compared to P1.
6500
6000
5500
5000
4500
a
P1 P2 P3
4000
Internal load (AU)
30
20
10
a
P1 P2 P3
0
Severit
y
Figure 2. URTI severity in the phases of the study. a - diferent from P1 and P2.
a b
a Symptoms Sources 8
6
4
2
P1 P2 P3
0
“better than normal”
8
6
4
2
P1 P2 P3
0
“worse than normal”
Figure 3. DALDA responses - “worse than normal” and “better than normal” responses for sources and symptoms of stress in the phases of the study. a - diferent from P1 and P2; b - diferent from P2
Signiicant correlations between analyzed variables are shown in Table 1.
Table 1. Signiicant correlations between analyzed variables (p < 0.05).
Sources BTN Sources WTN Symptoms WTN
P2 P3 P3 P1 P3
ITL P2 -0.69
P3 -0.75
Severity P1 0.60
P3 0.69 0.60
Note: ITL: internal training load; Severity: sum of severity scores from WURSS-21 responses; WTN: “worse than normal” responses; BTN: “better than normal” responses; P: phase.
DISCUSSION
the indings of this study, we can highlight the decrease in ITL at P3 com-pared to P1 and P2, showing a lower ITL in the phase of the investigation that included 7 games of the second round and 3 games of the irst round of the playofs.
As we approached the most important phase of the macrocycle (P3), the results of the investigation suggest that the team had diiculty deal-ing with stressors. his was shown by an increase in “worse than normal” responses for sources of stress from P2 to P3, despite the decrease in ITL. A decrease in “better than normal” responses for sources and symptoms of stress from P1 to P2 and P3 was also observed, suggesting that the begin-ning of competition has a signiicant impact on stress tolerance.
An increase in URTI severity was observed at P3. his phase of greater URTI severity included the second round of the competition (4 wins and 3 losses) and the irst round of the playofs (2 wins and 1 loss; passing to the next phase of the tournament).
Curiously, “worse than normal” responses in DALDA for sources and symptoms of stress were not directly afected by ITL. his inding
difers from results reported by Robson-Ansley, and Blannin Gleeson16
and Achten et al.23, which showed an increase in “worse than normal”
responses for symptoms of stress ater deliberate intensiication of training load. hese studies’ duration was four weeks and 11 days, respectively. In addition, observational studies conducted with basketball athletes (with no deliberate [experimental] manipulation of training load) also revealed congruence between ITL responses and DALDA. For example, Moreira et al.11, investigating young basketball players, members of national teams, during a preparatory phase for international tournaments (12 days of duration), found that “worse than normal” responses for symptoms of stress decrease with a decrease in ITL from the irst to the second half of the training period. Similarly, the indings of Moreira et al.18 in a 4-week study with basketball players during a competitive period showed that a decrease in ITL in the fourth week of the research provoke a decrease in “worse than normal” responses.
One possible explanation for the diference between this research’s results and cited studies, regarding the dynamics of “worse than normal” responses in DALDA, could be the study duration. his study was the irst to investigate professional basketball athletes during a 19-week full macrocycle. We can speculate that in a prolonged investigation, that would include the competitive period, factors other than the ITL may inluence stress tolerance responses. As an example, we can mention the accumu-lation of fatigue and emotional charge for prolonged periods, despite a decrease in ITL.
them to submit “worse than normal” responses in DALDA on items such as “tiredness” and “need to rest”. hese results clearly show that “worse than normal” responses in DALDA not merely relect the workloads, but are also directly inluenced by afective state, showing interaction between diferent psychophysiological constructs in the determination of stress tolerance at diferent moments of a competitive period.
In addition, it is important to say that one of the limitations of the cited studies was that only “worse than normal” responses in DALDA were retained for the analysis of stress tolerance. Results regarding “bet-ter than normal” responses were not presented. In this study, “bet“bet-ter than normal” responses were more sensitive to changes in ITL. With an increase in ITL from P1 to P2, “better than normal” responses for both sources and symptoms of stress showed signiicant decrease. here was also a negative correlation between ITL and “better than normal” responses at all phases of the investigation, showing that the higher the ITL, the fewer the “better than normal” responses. hese indings suggest that “better than normal” responses should also be used to analyze the stress tolerance dynamics in diferent preparatory phases.
Regarding to “better than normal” responses at P3, on a practical perspective, an increased number of these responses at this moment would be desirable, relecting the scope of peak performance, as proposed by Rushall19. Contrary to expectations, there was a decrease in the number of “better than normal” responses for both sources and symptoms of stress, and an increase in URTI severity, suggesting an unfavorable scenario to
achieve the maximum performance19,25.
An increase in URTI severity from P2 to P3 could be explained, at least in part, by an increase in stress during the same period (decisive phase of the competition). his inding supports the hypothesis of an association between decreased ability to tolerate diferent stressors and increase in the number of URTI episodes, regardless of the stress from the training26. his result suggests that the widespread belief that URTI are directly as-sociated with ITL does not necessarily conirm in a real competition, in which other sources of stress (pressure for results, disruption of routine, etc.), may have a substantial efect on the body’s defenses against disease development.
his possible association was considered in other longitudinal studies
in diferent sports. Cunnife et al.27, investigating athletes from rugby
during 11 months, and Neville et al.28, monitoring yachtsmen for more
than 50 weeks, found that psychological stress can increase the
inci-dence of infections in athletes. In addition, Bishop and Gleeson29 and
Nakamura et al.30 conirmed that the number of URTI episodes tends
to increase during competitive periods, corroborating the indings of the present study.
et al.18 in a research also conducted with basketball players. he authors reported correlations between the number of URTI episodes and “worse than normal” responses for both sources (r = 0.79) and symptoms of stress (r = 0.65) in the second week of the research. hese results support the existence of an association between stress and incidence of URTI, indicating the need for constant monitoring of these responses during the sports season.
CONCLUSION
ETL distribution provoked changes in ITL. However, unlike the original hypothesis, a decrease in ITL during the competitive period was followed by a decrease in stress tolerance and an increase in URTI severity. Fur-thermore, the magnitude of stress seems to induce an increase in URTI severity. Results indicate that the instruments used by this study can help monitoring the training process. he use of these instruments in conjunction with other indicators, such as performance tests and physi-ological markers, could substantially help coaches and athletes toward this direction.
REFERENCES
1. Viru A. Adaptations in sports training. London: Informa Health Care; 1995.
2. Viru A, Viru M. Nature of training efects. In: Garret WE, Kirkendall DT,
organizadores. Exercise and Sport Science. Philadelphia: Lippincott Williams and Wilkins; 2000. p.67-95.
3. Banister EW. Modeling elite athletic performance. In: Green H, McDougal J,
Wenger H, organizadores. Physiological Testing of Elite Athletes. Champaign: Human Kinetics; 1991. p. 403-424
4. Smith DJ. A framework for understanding the training process leading to elite
performance. Sports Med 33(15):1103-26.
5. Impellizzeri FM, Rampinini E, Marcora SM. Physiological assessment of aerobic
training in soccer. J Sports Sci 2005;23(6):583-92.
6. Impellizzeri FM, Rampinini E, Coutts AJ, Sassi A, Marcora SM. Use of RPE-based
training load in soccer. Med Sci Sports Exerc 2004;36(6):1042-7.
7. Coutts AJ, Reaburn P, Piva TJ, Murphy A. Changes in selected biochemical,
muscular strength, power, and endurance measures during deliberate overreach-ing and taperoverreach-ing in rugby league players. Int J Sports Med 2007;28(2):116-24.
8. Borresen J, Lambert MI. Quantifying training load: a comparison of subjective
and objective methods. Int J Sports Physiol Perform 2008;3(1):16-30.
9. Coutts AJ, Gomes RV, Viveiros L, Aoki MS. Monitoring training loads in elite
tennis. Rev Bras Cineantropom Desempenho Hum 2010;12(3):217-20.
10. Moreira A, McGuigan MR, Arruda AF, Freitas CG, Aoki MS. Monitoring internal
load parameters during simulated and oicial basketball matches. J Strength Cond Res 2012; 26(3):861-6.
11. Moreira A, Nakamura FY, Cavazzoni PB, Gomes JH, Martignago P. O efeito
12. Foster C. Monitoring training in athletes with reference to overtraining syn-drome. Med Sci Sports Exerc 1998;30(7):1164-8.
13. Foster C, Florhaug JA, Franklin J, Gottschall L, Hrovatin LA, Parker S, et
al. A new approach to monitoring exercise training. J Strength Cond Res 2001;15(1):109-15.
14. Nakamura F, Moreira A, Aoki M. Monitoramento da carga de treinamento: a
percepção subjetiva do esforço da sessão é um método coniável? Rev Educ Fis 2010;21(1):1-11.
15. Milanez VF, Pedro RE, Moreira A, Boullosa DA, Salle-Neto F, Nakamura FY.
he role of aerobic itness on session rating of perceived exertion in futsal play-ers. Int J Sports Physiol Perform 2011;6(3):358-66.
16. Robson-Ansley, P.; Blannin, A.; Gleeson, M. Elevated plasma interleukin-6 levels in trained male triathletes following an acute period of intense interval training. Eur J Appl Physiol 2007;99(4):353-60.
17. Moreira A, Freitas CG, Nakamura FY, Aoki MS. Percepção de esforço da sessão
e a tolerância ao estresse em jovens atletas de voleibol e basquetebol. Rev Bras Cineantropom Desempenho Hum 2010;12(5):345-51.
18. Moreira A, Arsati F, Lima-Arsati YBO, Simões AC, De Araújo VC.
Monitor-ing stress tolerance and occurrences of upper respiratory illness in basketball players by means of psychometric tools and salivary biomarkers. Stress Health 2011;27(3):e166-e172.
19. Rushall BS. A Tool for Measuring Stress Tolerance in Elite Athletes. J Appl
Sports Psychol 1990;2(5):51-66.
20. Barrett B, Brown R, Mundt M, Safdar N, Dye L, Maberry R, et al. he Wisconsin
Upper Respiratory Symptom Survey is responsive, reliable, and valid. J Clin Epidemiol 2005;58(6):609-17.
21. Moreira A, Cavazzoni P. Monitorando o treinamento através do Wisconsin
Upper Respiratory Symptom Survey – 21 e Daily Analysis of Life Demands in Athletes nas versões em língua portuguesa. Rev Educ Fis 2009;20(1):109-19.
22. Spence L, Brown WJ, Pyne DB, Nissen MD, Sloots TP, McCormack JG, et al.
Incidence, etiology, and symptomatology of upper respiratory illness in elite athletes. Med Sci Sports Exerc 2007;39(4):577-86.
23. Achten J, Halson SL, Moseley L, Rayson MP, Casey A, Jeukendrup AE. Higher
di-etary carbohydrate content during intensiied running training results in better maintenance of performance and mood state. J Appl Physiol 2004;96(4):1331-40.
24. Nicholls AR, Backhouse SH, Polman RC, McKenna J. Stressors and
afec-tive states among professional rugby union players. Scand J Med Sci Sports 2009;19(1):121-8.
25. Pyne DB, Hopkins WG, Batterham AM, Gleeson M, Fricker PA. Characterising
the individual performance responses to mild illness in international swimmers. Br J Sport Med 2005;39(10):752-6.
26. Moreira A, Borges TO, Koslowski AA, Simões AC, Barbanti V. O
comporta-mento do esforço percebido, fontes e sintomas de estresse e inlamação do trato respiratório superior em atletas de elite de canoagem de velocidade durante 7 semanas de treinamento. Rev Bras Educ Fis Esporte 2009;23(4):355-63.
27. Cunnife B, Griiths H, Proctor W, Davies B, Baker JS, Jones KP. Mucosal
im-munity and illness incidence in elite rugby players across a season. Med Sci Sports Exerc 2011;43(3):388-97.
28. Neville V, Gleeson M, Folland JP. Salivary IgA as a risk factor for upper
Corresponding author
Alexandre Moreira
Escola de Educação Física e Esporte – USP
Av. Prof. Mello de Morais, 65. CEP 05508-030 - São Paulo, SP, Brasil. E-mail: [email protected]
29. Bishop NC, Gleeson M. Acute and chronic efects of exercise on markers of
mucosal immunity. Front Biosci 2009;14(1):4444-56.
30. Nakamura D, Akimoto T, Suzuki S, Kono I. Daily changes of salivary secretory