Gavetas e prateleiras
Drawers & Shelves
Economic value of health
Valor econômico da saúde
Paulo de Assis Ribeiro
Manoel José Ferreira
Ernani Braga
Published under the auspices of the Serviço Especial de Saúde Pública Rio de Janeiro
Brazil - 1952
The Serviço Especial de Saúde Pública, created on July 17, 1942 by virtue of the contract between the Governments of the United States of Brazil and of the United States of America, signed respectively by the Ministry of Health and Education to which it is subordinated, and the Institute of Inter-American Affairs, is maintained on a co-operative basis by the governments of booths countries.
ETPAR - 1952
Acknowledgements
This work was prepared with the inten-tion as of contributing to the debates dur-ing the conference of the V World Health Assembly to be held in Geneva during May 1952.
The enormous effort to select, collect, discuss and write in the short time available would not have been possible without the tireless cooperation of the personnel of Paulo de Assis Ribeiro’s Technical Office and of the Serviço Especial de Saúde Pública (SESP) under whose auspices, this paper is presented.
We cannot neglect to make special ref-erence and express our deep gratitude for the effort of Vera de Assis Ribeiro and Dorothéa Viot de Albuquerque. They have gone up to the boundaries of their strength during all phases of the work.
To Mathilde Kastrup, in charge of the English translation we are, not only deeply thankful but also, on the obligation to present our excuses for the many errors and defects due to the hurry of revising, typing and printing.
The graphs, so many times corrected and redrawn by Heriberto Alves de Albu-querque as well as the preparation of the cover and designs of symbols and formula by Sebastião M. Silva, contribute to give a better presentation to “Economic Value of Health”.
The pressure of time was a heavy bur-den on Clélio Ximenes Carneiro and Roberto Martins Costa in charge of the printing.
We are also not less thankful to a num-ber of others not mentioned by name.
Rio de Janeiro, April 28, 1952
Contents
CHAPTER I - GENERAL ASPECTS ... 305
1) Principles of Measuring the Economic Value of Health ... 305
A) Economic Factors Function of Health ... 305
B) Basic Concepts ... 305
2) Principles of Individual Productivity and Consumption According to Age ... 306
3) Principles of the Productivity and Consumption of Population According to Composition by Age Groups ... 308
4) Fundamental Principles of Life Span; Representative Rates and its Evolution ... 311
A) Various Principles of the Life Span ... 311
B) Evolution of the Rates of Human Life Span ... 314
5) The Value of Man and the Economically Productive Life Span - Need for Demo-Econometric Investi-gations ... 317
CHAPTER II - THE COST OF MORBIDITY ... 319
1) The Causes of Morbidity and its Economic Importance ... 319
2) Influence of Morbidity on the Maintenance of Public Health Systems ... 323
3) Method of Determining the Cost of Morbidity ... 325
A) General Considerations ... 325
B) General Morbidity ... 325
C) Annual Individual Specific Consumption on Account of Morbidity ... 325
D) Annual Total Production Lost on Account of Morbidity ... 326
E) Annual Total Consumption Increased on Account of Morbidity ... 326
CHAPTER III - COST OF MORTALITY ... 328
1) Natural Death and Premature Death in the Moral Field and in the Financial Field ... 328
2) Method of Determining the Cost of Death ... 334
A) General Considerations ... 334
B) Number of Premature Deaths ... 334
C) Annual Specific Individual Consumption on Account of Premature Death ... 334
D) Total Potential Production Lost Annually on Account of Premature Deaths ... 335
E) Specific Total Annual Consumption Increased on Account of Premature Death ... 336
F) Total Potential Consumption Reduced Annually on Account of Premature Deaths ... 336
CHAPTER IV - CONCLUSIONS ... 338
1) The Value of Health and Some Representative Rates ... 338
A) General Considerations ... 338
B) Balance of Potential Values of Production and Consumption of a Population ... 338
C) Total Influence of Morbidity on the Economic Value of Heath ... 338
D) Total Influence of Mortality on the Economic Value of Health ... 339
E) Total Production Lost by Virtue of Morbidity and Mortality ... 339
F) Total Consumption Augmented Because of Morbidity and Mortality ... 340
G) Representative Rates ... 340
2) Organization of Health Systems Based on the Value of Health ... 340
CHAPTER I
GENERAL ASPECTS
1) Principles of Measuring the
Economic Value of Health
A) Economic Factors Function of Health A) Economic Factors Function of Health A) Economic Factors Function of Health A) Economic Factors Function of Health A) Economic Factors Function of Health
The purpose of this study is to explain the value of health from the viewpoint of the expenses and losses caused by disease and other physical deficiencies which, in all age groups, reduce or hinder the full normal productiveness of the healthy man in a spe-cific period; also losses in productivity-re-sulting from premat\ure deaths and caus-ing a reduction in the number of individu-als in each age group in ages below the nor-mal age of Lexis for the region under con-sideration - throughout the period between the age when death occurred and the re-spective normal Lexis ages.
An analysis will be made elsewhere of the cost of disease and the cost of death. This study will frost define the fundamen-tal concepts followed.
In analyzing the cost of disease, an exami-nation will be made of the expenses and losses incurred by diseases and physical lesions:
- Directly, in private economy - indi-vidually and of in each family group - and in the general economy - of the state;
- Indirectly, by reducing individual productivity rates and the various age groups of the population in the region under consideration;
- Indirectly, by an increase of the
population groups of low productiv-ity; and finally,
- By a growth in the relation between total consumption and total produc-tion of the populaproduc-tion of the region under consideration, owing to the duration of disease and the effects of physical lesions.
In analyzing the cost of death, special consideration will be given to the losses consisting in increase of goods and services which should normally be consumed:
- Owing to social and economic
desiquilibrium in the communities where they occur;
- Owing to increased production cost of the population group reaching adult age;
- Owing to the reduction of the aver-age value of the rate relating of du-ration of the economically produc-tive life; and consequently,
- Owing to increase of the relation be-tween total consumption and total production of the population of the region.
Attention should also be given to reduc-tion in the normal total consumpreduc-tion, re-sulting from the reduction of the number of consumers eliminated from the popula-tion by premature death.
Values relating to death will be dis-cussed for the period included between the age at which death occurred and the nor-mal Lexis age for the region.
B) Basic Concepts B) Basic ConceptsB) Basic Concepts B) Basic ConceptsB) Basic Concepts
It will therefore be necessary to define some basic concepts used in fixing mea-surement units for the value of health. These are to determine the total value of all expenses and losses referred to and also to establish rates relating to each region. Such rates should represent the value of health in relation to the balance of total reproduc-tion for the populareproduc-tion considered and in relation to each age group of that popula-tion, both as instantaneous values and for determining the variation of these in the course of time, inclusively by the influence of growth rates to be considered.
Throughout this work, it is admitted that the well being of a given population is in di-rect proportion to the average productivity of its members. Productivity, in turn, de-pends on the rate of heath of the region and grows as the rate improves. The rate is de-termined by the conditions of morbidity in general and by the characteristic death curve.
a bearing on calculating the value of health, according to the principles followed in this study, are of completely different values for each region considered. Moreover, in one and the same region these values undergo noticeable change as time goes on, and this will taken into consideration in the analy-sis of each of the following chapters.
2) Principles of Individual Productivity
and Consumption According to Age
Jean Dayre (1), Technical Consultant of the French National Productivity Commit-tee, has stated, in a parody of the title of Alexis Carrel’s book, “Man, the Unknown”, that in the modern world the idea of pro-ductivity is another unknown.
In 1911, Albert Aftalion (2), in an article published in the Revue d’Economie Politique, entitled “The Three Notions of Productivity and Rent”, pointed out the confusion existing in economic literature on productivity: global productivity (in natura); the special productivity of each agent (in nature); and the special productivity of each agent (in value). These agents are the three groups of classical factors of economy: land, work, and capital.
Although contemporary specialists still use these distinctions in economic studies, there is a tendency, pointed out by Jean Dayre, to group the three classical factors of productivity into one element, human work. This specialist also proposes that, for the needs of the measure, productivity be defined as the relation between production and work.
In this study, except for the approxima-tions necessary to reduce the complexity of practical evaluations of the values of pro-ductivity, adopted by economic technique, consideration will not be given to certain factors bearing on the precision of those values but of little significance to the objec-tives in view.
In addition to the global average values for a nation, region, or city, we should also know the average values for each age group in the respective populations, with a
classi-fication for each group of the average val-ues of productivity and of production, as well as of average consumption in goods and services, for each individual in these age groups.
It would also be advisable to classify, for each of the cases, the average values appli-cable to individuals of both sexes, but the lack of statistical data does not permit car-rying the study this far.
In this respect, there is also one other necessary approximation, referring to the unit of production: individual, family, or family group.
In the present day social organization, with the gradual disappearance of the pa-triarchal family, it is difficult to adopt the average family as a unit of production and of consumption in a population. It would be easier to study the family groups which, in modern society, constitute the social and economic unit and which are formed not only of closely related members but of sym-biotic association.
However, approximations of the same order will be arrived at more easily by de-termining the average values for each indi-vidual of the various age groups.
Graphic representation of average val-ues of production and individual consump-tion, during the statistical period of one year, for individuals of the various ages, may be taken to present forms, for each region considered, similar to those presented in Figures 1 and 2.
Absolute values of the ordinates of these curves, however, will vary greatly according to productivity rates. In one the same re-gion, these will vary in the course of time with the economic progress, but the forms indicated in the figures will be maintained with slight changes.
In Figures 1 and 2, the values of the or-dinates represent an empirical estimate, with a primary approximation, for drawing the curves relating to individual average production and consumption, at each age, for Brazil. There are represented, respec-tively, by πx and γ x.
to systematizing statistical investigations on consumption, proposed the adoption at the end of the 19th century of the unit of
indi-vidual consumption, justifying this a fol-lows: “It was necessary for me to introduce this new expression. Since the constitution of families varies greatly, and its members increase, grow, move, etc., it is clear that family consumption can not remain always the same. Attention should be given to the age of consumers, because this condition
has considerable influence, from birth to the 25th year for men and to the 20th year for
women.
10% until the respective ages of 25 to 20 years”.
After presenting a table for ages 0 to 25, he continues:
“I do not claim that the figures on this scale are irrefutable. On the contrary, they may be questioned for the reasons I pointed out in my study on the cost of man. How-ever, they suffice perfectly for the purpose. “The degree of consumers is therefore determined by the average amount of an-nual consumption expense. Upon reaching the age of 5, this represents 1.5; at 10 years, 2.0; at 25 years, 3.5 units. A family composed of father, mother, and six children aged 11, 9, 7, 5, 3 and 1 represents 16.1 units (father, 3.5; mother, 3.0; child of 11 years, 2.1; 9 years, 1.9; 7 years, 1.7; 5 years, 1.5; 3 years, 1.1; and 1 year, 1.1.
The introduction of this unit makes the composition of family independent from the valuation of the balances of consump-tion. The field of choice for families to be studied is greatly increased, since its com-position is inconsequential and its is suffi-cient to know the number, sex, and age of its members”.
It can be seen that Engel introduced a unit of individual consumption based on prenatal and natal expense and established that the variation of individual consump-tion, with the years, could be represented by arithmetic progression.
Giorgio Mortara (4) suggests substitut-ing arithmetic progression for geometric progression and also presents the possibil-ity of a more general form of representation. He pointed out, however, that the lack of numerical values to determine the func-tions for expressing variation of consump-tion, according to age, discourages the adoption of these general functions.
On the other hand, Vilfredo Pareto (5) drew up a method for substituting the dis-continuous functions of Engel’s formulas by continuous functions, using infinitesimal calculation and substituting the totalities by integrals.
When using the coefficients established by E. Engel as well as those proposed by
Giorgio Mortara and V. Pareto to determine the cost of production of adult man, it should be noted that the values obtained increase to the limits of the ages under consideration. In applying these to the present study, it is necessary to take into account the fact that after a certain age, coefficients of consump-tion in relaconsump-tion to age again decrease.
3) Principles of the Productivity and
Consumption of Population According
to Composition by Age Groups
The composition of populations by age groups may present three classical types: progressive, stationary, and regressive.
For the three types, however, all indi-viduals from 15 to 50 years represent ap-proximately 50% of the total population, and the percentages of the number of indi-viduals from 0 to 15 and from 50 to w are characteristic of the three types.
According to Sundbärg (6) the charac-teristically progressive type of population would have 40% individuals from 0 to 15 years, and 10% 50 to w years; the stationary type, 26.5% to 15 years and 23% 50 to w years; the repressive type, 20% 0 to 15 years and 30% 50 to w years. Sundbärg establishes the percentages for the three large age groups in a standard type of population: 0 to 15 years group 33.3% 15 to 50 years -50%, 50 to w group - 16.7%.
Accordingly, the population of Brazil would be immediately included in the clearly progressive type, and the distribu-tion curve of the populadistribu-tion by ages is rep-resented in Figure 3, with approximate av-erage values for the population in 1950.
R. R. Kuczynski (7) shows that is neces-sary to know the death and birth rates and the immigration data in order to reach a definite conclusion on whether the popu-lation is of the stationary, regressive, or pro-gressive type.
From this aspect, however, the develop-ment of studies on the general theory of population have reached a point where it is possible to obtain approximation degrees suitable for economic studies.
In addition to his general studies on the subject, Alfred J. Lotka (8) made a special study of the fundamental types of popula-tion: stationary, malthusian and logistic, in relation to effective populations. These con-tributed decisively to the practical applica-tion of demography in economic studies, especially with reference to the differential rates of growth for the productive age groups in a population of each of these types.
It is therefore possible to know the com-position of the population of a region by age groups and also to make an approximate forecast to this composition in periods of time necessary for economic studies.
The economic aspect of the composition by ages of a population is of utmost impor-tance, since the percentage of individuals in the economically productive age groups is of itself an indication of the production ef-fort which individual of this group must make to maintain the population where the as yet non-producing age groups and those of advanced age, of very limited productiv-ity, constitute consuming groups weighing
heavily in the absorption of the production by the economically producing group.
At times, in one and the same country, there is a great variation in the composi-tions by age of the populacomposi-tions of its vari-ous regions. There are especially great dis-crepancies in the economically productive ages. For the purposes of this study, this requires a knowledge of regional data in order to evaluate the value of health.
It is not sufficient, therefore, to know the average values in a country, in a determined period, representing results of components with various characteristics representative of each one of its regions.
It is true that all work of reducing avoid-able mortality leads, at the end of a certain period, to a percentage increase of the population over a certain age. This is the case with the population of the United States where, according to a recent study by Oscar R. Ewing (9), administrator of the Fed-eral Security Agency, there were 18% over 45 years in 1900, increasing to 28% in 1945, with a forecast of 34% for 1975.
le-sions, nephrites, etc. The control of these is not only more costly but also less efficient with the resources available.
In the economic study of the value of heath, this represents a substantial modifi-cation in the forms of the characteristic curves presented in this study, without, however, altering the degree of validity of the method presented.
On the other hand, in a country with varying regions of economic development, population groups of low production con-tribute to a decrease in average rates of na-tional productivity. It is therefore of general national interest to go to work in these re-gions, intensifying the means of production, providing the population with instruction according to the environment, and lastly providing economic recuperation by all means in order to raise the average rates of productivity.
Figure 4 shows the forms of the curves of total production and of total consump-tion, as well as the zones where there are balances and deficits of production, accord-ing to age. These curves are obtained by the product of the ordinate of the curves shown on Figures 1 and 2 and the ordinates of the curve shown on Figure 3. The values of these ordinates are respectively pXPX and
gXPX. For those products, will be used the symbols: Rx and Cx.
The production balance of a population indicated by the curves in Figures 1, 2 and 3 may be expressed, using the indicated symbols
(1)
x
px
x
px
0 0
Sp
=
ω
Σ
π
−
ω
Σ
γ
or
Cx
px
0 0
Sp
=
Σ
ω
−
Σ
ω
where Sr indicates the production balance, and w the most advanced age in the popu-lation under study.
An analysis of Figure 4 shows how the increase of Sr balance may be obtained.
Theoretically, in order to increase the Sr value, we should try to increase the values of pc in all ages, those of rc in the phases where pc is greater than gc, and reduce the values of gc in all ages, and those of rc in the phases where gc is greater than pc. However, these changes should not be for the purpose obtaining purely economic data. The aim should be:
the population;
- to increase the values of rc, at ad-vanced ages, representing a greater average life span for the population, an ideal of civilization throughout time.
- two reduce pc in advance ages, a so-cial ideal also being gradually at-tained with modern labor legislation, by means of retirement pensions. These ideals, apparently at variance with the purposes of increasing total pro-duction balances, must be arrive at simul-taneously with a strong increase of pc and rc in the economically productive ages, by means of greater efficiency in the organi-zation of labor. This is being accomplished in countries of better economic situation, especially by means of a well organized sys-tem of public health, by planning tech-nique, by the development of mechaniza-tion in general, and by well supervised in-dustrialization.
An attempt should be made to obtain for the general population a greater relative number of persons in the economically pro-ductive ages, and multiply for the produc-tion capacity of these by means of the avail-able techniques.
4) Fundamental Principles of Life Span;
Representative Rates and its Evolution
A) Various Principles of the Life Span A) Various Principles of the Life Span A) Various Principles of the Life Span A) Various Principles of the Life Span A) Various Principles of the Life Span
The lack of a uniform terminology for questions relating to the life span requires that we first define the terms to be used in this analysis in order that data and conclu-sions may be better interpreted. Various terms are used in the study of the human life span and, according to the point of view taken, ideas are expressed in such varying manners that data and numerical rates dif-fer greatly. This makes comparative stud-ies difficult, whether for the same popula-tion in a determined period or what is still more difficult - in cases of comparison of the conditions in various regions, over vari-ous periods.
The main principles are: a) empiric idea of the life span; b) maximum or potential span; c) man’s average effective span; d) median life;
e) average life; f) normal life.
a) Traditionally, the empiric idea of the life span shows that the human life, in the various regions of the earth, may be con-sidered to have a duration between 70 and 80 years. Considered globally, this empiric notion has not varied throughout the cen-turies and even in the Bible (10) - with the exception of life spans of ante and post-diluvial patriarchs - the life spans registered show that the common period of the life span did not vary greatly above or below those figures.
In this analysis, however, this empiric idea of the human life span is of little inter-est, although the numerical rates are the most uniform in time and space.
the life span of patriarchs prior to the flood. Literature of Hebrews, Samaritans, and of the Setenta, although differing in the life spans of theirs patriarchs, all refer to spans much higher than 100 years. The Latin Vulgate (10) follows the chronology of the Hebrew text, and in the latter the life spans of ante-diluvian patriarchs varied from 777 (Lamech - Father of Noah) to 969 years (Methuselah - who died the year of the flood), without taking into consideration the life span of Henoch (365 years) since, according to the Bible, this period does not refer to Henoch’s life span as he was taken from the midst of men in the year 987 of the world but did not die on that date.
In the censuses of various countries, there are frequent references to a large num-ber of centenarians. Specialists in demogra-phy do not accept these statistical data as being entirely true, especially since they are not based on civil registration, which is be-ing used only a little over a century, and not in all countries. In the 1940 census in Brazil, there were several thousand declarations of age over 100 years. In a recent study, Profes-sor Giorgio Mortara attempted to correct the census data, showing numerous causes of error in such declarations.
Declarations of centenarians in the 1940 census numbered 7.889, of whom 2.854 were men and 5.035 women. In addition to many inaccuracies pointed out in these dec-larations by Professor Giorgio Mortara (14) in his work on “Centenarians in the Brazil-ian Census of 1940”, which leaves no doubt as to the inexacteness of the declarations, it is curious to note that there were 213 cases of childbirth when the woman had already passed her 50th birthday, since the age at
which she could have had her youngest child would be:
50 to 59 years - in 33 cases
60 to 69 years - in 97 cases
70 to 79 years - in 49 cases
80 to 89 years - in 19 cases
90 to 99 years - in 9 cases
100 to 109 years - in 3 cases
110 years and over - in 3 cases
In view of the inaccuracy of the decla-rations and following a conscientious de-mographic analysis, Professor Giorgio Mortara reduces the figure of 7.889 to a probable value of 70 to 140 cases of cente-narians in Brazil at the time of the 1940 cen-sus. Even so, this gives Brazil a rate per 1.000.000 of 1.69 to 3.38, much higher than has been found for Germany, Japan, Swit-zerland, Finland, Italy, and Holland.
Kuczynski (quoted by Giuseppe Levi (11) in a study on the limits of growth and aging in metazoans), after carefully exam-ining data referring to a person who was said to be 118 years old, concluded that his age was not greater than 106 years. S. Hirsch [apud 11], based on statistical studies and especially those of Pütter, concluded that the existence of men over 110 years is highly improbable, since studies relating to per-centages of centenarians in cases of death found in Germany showed that for each in-dividual of 105 years there would be a cor-responding 1.1 million deaths, for each in-dividual of 115 years there would be a cor-responding 6.550 million deaths, and there-fore the probability of a person dying at the age of 115 years would occur only once ev-ery 160 years.
Therefore, the statistical principle of maximum or potential human life span is taken as being the period of one century for the normal limit in vital statistical studies.
c) The third principle to be considered is that of man’s effective average span, vary-ing accordvary-ing to the region, especially in relation to health indices, and therefore varying also for each era under consider-ation. The numerical rate of this span is obtained by taking a simple average of the real life spans found for individuals of a de-termined group born in the same period. For Europe this value varies normally from 35 to 45 years, with the exception of some places where the figure is higher than 50. In the United States, this average reaches values equal to or higher than 70 years. In Brazil, the rate is normally between 35 and 45 years.
for the purposes of this study, but are very representative of the global characteristics of health conditions in a determined region. d) another characteristic index of a new principle of the life span is that covered by the median life (sometimes incorrectly called probable life), which corresponds to the age at which the initial figure of 100.000 survivors, considered as having been born in the same period, is reduced to 50.000, or half. This rate is very former of the health conditions in a determined region.
In order to have an idea of the approxi-mate numerical value of this index, we quote a few examples taken from Giorgio Mortara (15):
Brazil ... (1920) - 43 years United States ... (1940) - 68 years Italy ... (1930) - 43 years Chile ... (1930) - 42 years
e) Another principle of the life span is that indicated by average life, representing the probable number of years a man still has to live at each age. This rate is determined in the calculations of the death rate tables, and the life span appears therein as factor of statistical probability. It is of the greatest interest in economic studies of death rates and is the basis for all actuarial calculations of insurance companies and social security. From its definition, we see that this rate
var-ies at each age of the person under consid-eration. In comparative studies, it is cus-tomary to take the rate referring to the ages of 0 to 1 year, although the tables are orga-nized for all ages. The following examples (16) of average life at age 0 give a good idea of these rates:
Brazil ... (1920) - 38 United States ... (1940) - 63 Italy ... (1930) - 56 Chile ... (1930) - 38 Australia ... (1947) - 68 New Zealand .... (1938) - 67
f) Finally, we have the principle intro-duced by Wilhelm Lexis of the normal age corresponding to the age at which the num-ber of deaths of adults, in 100.000 births of the same period, attains the maximum. For a better understanding of this rate, it is in-dispensable to examine the general curve of deaths, in the manner suggested by Lexis. For this rate to be significant, the age it indi-cates must be correlated with the frequency of deaths verified at that age (Figure 5).
Figure 5 was drawn in the basis of the survival table, according to mortality in the period 1939-1941, organized by Giorgio Mortara (15), with the Gompertz-Makehan adjustment, starting with age 20, for the Federal District, Brazil.
Federal District
Brazil ... (1940) - 69 United States ... (1937) - 80
In a general way, all these rates with the exception of that relating to the principle of maximum or potential human life span, are studied separately for both sexes, since variations for all are very noticeable for the group of men and the group of women in one region, in a given period. However, the average values for both groups serve to es-tablish influences relating to death rates in the present economic studies.
B) Evolution of the Rates of Human Life B) Evolution of the Rates of Human Life B) Evolution of the Rates of Human Life B) Evolution of the Rates of Human Life B) Evolution of the Rates of Human Life Span
Span Span Span Span
The most common graphic forms for rep-resenting data referring to death rates for a population are the probability curves of sur-vival, of average life, and of general deaths.
Figures 6, 7 and 8 give several examples of these three types of graphic representa-tion of death rates.
Figure 6 shows the four following types of survival curves:
a) Survival curve according to the hy-pothetical life table of L.I. Dublin (1933);
b) Survival curve according to the table calculated by H.L. Dunn for the United States of North America (1946);
c) Survival curve for the city of São Paulo (Brazil) according to the table calcu-lated by Giorgio Mortara (1940); d) Survival curve for the city of Recife
(Pernambuco-Brazil), according to the table calculated by Giorgio Mortara (1940).
Figure 7 shows the five following types of average life curves, at various ages:
a) Representative curve, drawn accord-ing to the hypothetical life table of Dublin (1933);
b) Representative curve, according to the table calculated by H.L. Dunn for the United States of North America (1946);
d) Representative curve, according to the data of K. Pearson for Roman Egypt, 2.000 years ago;
e) Representative curve for Recife (Pernambuco-Brazil), according to the table of Giorgio Mortara (1940). Figure 8 shows the curves of general deaths of Wilhelm Lexis for the United States of North America (1940).
In analyzing these, it is possible to make a general examination of how the life span rates have evolved over the last 2.000 years. In the evaluative study, it is not possible to consider the life spans registered in Bib-lical literature, since these have not as yet been interpreted to the satisfaction of all who believe in the truth of the historical book. In any event, we would find refer-ences useful only in studying maximum or potential life span.
Scientific studies of value in determining the conditions of life and death about 2.000 years ago are those of Pearson and Macdonell, continued by Macdonell (17,18). The oldest known probability tables (19) are, those of Prefect Pretorian Ulpiano and of Jurisconsult Aemelius Macer, originated in the third century of the Christian era, but these are of purely historical interest. Lists of life spans of eminent personages of an-cient times give no evidence of evolution in the increase of the average life or of the nor-mal life or of any other rate. For example, one list among many is the following:
Alexander the Great ... - 33
Aristotles ... - 62
Cicero ... - 64
Demosthenes ... - 62
Herodotus ... - 59
Hippocrates ... - 85
Horace ... - 57
Ovid ... - 60
Plato ... - 80
Pythagoras ... - 82
Thales ... - 94
Virgil ... - 51 The average life span is 67 years
Investigations of Pearson and
Macdonell in 1902, analyzing data relative to the populations of North Africa about 2.000 years ago, when Egypt was under the dominion of Rome, enable them to draw a probability curve of live at each age, permit-ting a comparison of the conditions of life at that period with those in various regions of the world in modern times. Continuing the investigations initiated with Karl Pearson, W. R. Macdonell, based on mate-rial extracted from “Corpus Inscriptionum Latinarum” of the Academy of Berlin, se-lected three groups of data which permit-ted the establishment of curves analogous to those organized for the Egyptian popu-lation of that era, for the inhabitants of Rome, for the inhabitants of Spain and Lusitania under the dominion of Rome, and for the African colonies. These curve were organized separately for each sex and per-mit comparisons analogous to these re-ferred to.
An observation of Figures 6 and 7 shows how in some regions of the world sanitary and economic conditions have permitted life span rates to approach, and sometimes surpass the theoretical rates of the hypo-thetical table of Dublin, which has therefore been reviewed on account of that fact.
On the other hand, we note that in cer-tain regions general rates of life span do not show considerable progress when com-pared with the presumable sanitary condi-tions in the world 2.000 years ago, expressed by the curves drawn on the basis of the stud-ies of Pearson and McDonnell.
Most basic studies, however, were pos-sible only commencing with the Nineteenth Century, and even so with data referring to few countries, since statistics that could supply sufficient documentation for stud-ies on a scientific basis were rare and still are for a great number of countries. In or-der to have an idea of the evolution of the rates of life span during recent times, a few examples of average life at age 0 are given on the following page.
37.88 for men and 39.76 for women, and the situation for some cities in Brazil from 1939 to 1941 was, for São Paulo, 46.71 for men and 51.77 for women; Federal District, 39.75 for men and 45.24 for women; Salvador 32.49 for men and 37.88 for women; Recife, 28.4 for men and 32.47 for women.
5) The Value of Man and the
Economically Productive Life Span
-Need for Demo-Econometric
Investigations
Following the abolition of slavery the idea of attributing a financial value to man was almost abandoned for a time. Under the former system, at least, a small part of the population was given a value in money and the free man was of less financial value than the slave.
Gradually, however, the financial value of man was again considered, taking into account the goods produced by the popu-lation.
The creation of the primitive insurance systems required the organization on tables for the value of human life. These are being continuously perfected in all countries, but the values are proportional to the premi-ums. Their evaluations of the value of hu-man life are gradually becoming more an a priori personal estimate rather than the evaluation of the average values of man in each region.
The first attempts at a rational evalua-tion of the economic value of man were those of William Petty (1623-1687), who considered the value of a population as be-ing the equivalent of the capital which, at a specific interest rate, would earn the total goods produced by the population. The av-erage value of man would be the value of that capital divided by the number of indi-viduals in the population under consider-ation.
In addition to other errors in evaluation, consideration was not given to the values of consumption by the population in goods and services.
L. I. Dublin and A. J. Lotka (20) present a study, which can be summarized in the following steps.
In the Eighteenth century Adam Smith, taking into consideration the relation be-tween the productive capacity of nations and the consumption necessary for their populations, attempted to establish and economic value for man.
Adam Smith, however, did not give an intrinsic value to man himself, but gave more weight to the productive capacities such as knowledge acquired, abilities for work, since these contribute to an increase of credits for determining production bal-ances, whereas man himself contributes to increase the credits but contributes even more strongly in increasing debits because of goods and services he consumes.
In the Nineteenth century, stricter inter-pretations were made and these resulted in
TABLE
Average Life 0 year Countries Periods Men Women Australia 1881-1890 47.20 50.84
the studies of William Farr, T. Wittstein, R. Lüdtge, E. Engel, and V. Pareto.
William Farr tried to determine the val-ues of each individual, taking into account the capacity for production at a specific age, determining the value at other ages by set-ting interest rates and considering mortal-ity tables. T. Wittstein attempted to deter-mine the value of man at various ages of life by considering the value 0 at the date of birth and establishing that, for a certain population group, total production throughout his entire existence would be the equivalent of the expenses for his main-tenance. R. Lüdtge, studying specifically the value of man for the purpose of organizing insurance tables, shows the relative nature of these values, since they do not have a fic-titious average value but in each case have a real, physical significance of what the in-dividual represents financially to his family or insurance beneficiary.
E. Engel (3,21), a disciple of Quetelet and of Le Play, was the first to consider the ques-tion from a more ample viewpoint and he was the observer and initiator of various heretofore neglected elements among the factors determining man’s value.
In addition to the data for determining individual consumption according to age, described above, Engel promised to com-plete his investigations. His work, however, remained unfinished, but he did have great influence on later investigations.
In his studies, he did not take into ac-count the death rate or capital interest, al-though he was conscious of these deficien-cies, but he introduced the principle of the economically productive period of life.
Vilfredo Paredo (15), starting with Engel’s studies, not only introduced the fac-tor of infant mortality in the cost of the adult man, but also established continuous for-mulas to express the values at each age, us-ing the mortality tables of Bódio. He also proposed that, in determining the cost of adult man, consideration be given to the age limit of 20 years instead of 25 years, as used by Engel. He went so far as to question his
value of 20 years as being excessive since individuals already produced special value for their subsistence starting at 16 years.
In the Twentieth century there have been many studies referring to the value of man or of human life, the most important of these being the studies of Louis I. Dublin, Alfred J. Lotka, and Giorgio Mortara.
During this century, the problem be-came even more significant. The knowledge of the value of human life has become in-creasingly important for a perfect under-standing of economic problems.
A historical analysis shows that all those who took up the problem were limited in their studies by the deficiency of statistical data, which alone shows the need for de-veloping demo-econometric investigations. In this study, we are trying to introduce into the analysis of the economic value of man the factors of greatest influence in its variation, summarized under the heading of the economic value of health and taking into account disease rate in its many aspects in determining that value, a matter not yet duly estimated.
The study of the economically produc-tive life span will be a result of investiga-tions in each region for the coefficients re-lating to individual production and con-sumption, and also of the demographic analysis based on the death tables for the same regions.
Giorgio Mortara (22,23) made special studies to determine the economically pro-ductive life, published in a series of articles entitled “Demo-econometric Investiga-tions”, for the purpose of developing knowl-edge of these two branches of social sci-ence, facilitating exploration of the zone of common interest.
CHAPTER II
THE COST OF MORBIDITY
1) The Causes of Morbidity and its
Economic Importance
In the analysis covered by this chapter, it is first necessary to establish a concept for morbidity, since the determination of the characteristic elements of the general mor-bidity of a population vary greatly accord-ing to the concept adopted.
Important characteristics for evaluating cost at each age are:
-the coefficient of morbidity
px
nx
Zx
=
-the frequency of the disease or the pos-sibility of becoming ill
f
px
cx
x
=
-the duration of the disease
cx
nx
x
=
δ
were px, cx and nx represent, respectively; individuals, at age x, exposed to the risk of disease during the period of time under consideration; the number of individuals at age x, who in group rc were affected by the disease during the period under consider-ation; and the total number of sickness-days for individuals of group px during the pe-riod under consideration.
It is clear that for each concept adopted for morbidity there are very different cor-responding numerical values for the char-acteristic indices.
In calculating the cost of sickness, we should, in a general way, include among the diseases everything that represents harm-ful modification in the state of health and in the normal vigor of individuals at vari-ous ages. Therefore, consideration should be given to diseases in general, whether those of chronic evolution or of acute evo-lution, both in the forms which hinder the
normal activity of the individual during a certain period an in the forms in which they merely reduce the productivity of the indi-vidual at work. Consideration should also be given to physical lesions and traumatism in general; whether they cause temporary or permanent disability or whether they are merely harmful to the worker by reducing his output. We should also include all losses resulting from every and any physical or mental deficiency, or loss of productive ca-pacity, caused by diseases, in the broadest sense of the term.
In examining the economic influence of disease, it is also necessary to establish the concept of what may be considered as tech-nically avoidable morbidity and what may be termed as residual morbidity of more difficult control, in the population group considered.
This aspect of the problem was been better studied with reference to death, but it is evident that premature deaths are the final phase of a disease and everything in-dicates that it is by reduction or elimination of these diseases that the more rapid reduc-tion or eliminareduc-tion of premature deaths is obtained.
Statistics, however, leave much to be desired in the majority of countries with respect to morbidity.
During this century some countries have become concerned with the influence of morbidity on the economic indices and have undertaken special investigations and census-surveys to determine fundamental coefficients, not only in order to institute sickness insurance but also to determine the orientation of public health systems for the improvement of production indices of the population.
Edgar Sydenstricker (24) made a very valuable attempt to outline the “Age curve of good health”, which was later developed by Isidor S. Falk, Margaret C. Klem, and Nathan Sinai (25) following an analysis of 8.500 families of the white race from vari-ous regions of the United States.
dis-ables an individual for one or more days or any experience for which medical service of any kind is received. Any condition, symp-tom or disorder for which drugs costing 50 cents or more are purchased is considered an illness” (26).
It can be clearly seen that this concept is predominantly influenced by corporal factors, whereas the present phase of medi-cine is daily becoming more firmly based on a psychosomatic viewpoint.
The interrelation of a great number of pathological conditions of purely organic appearance, with alterations in the psycho-logical field, closely associates the clinical aspect of disease with the mental behavior of the patient.
This is the reason why medical care and social assistance, in their broadest sense, are working on parallel levels and as parts of the same system.
We therefore have an idea of the diffi-culty of appreciating present statistics of the neuropsychological factor, not only in the origin of the sickness but also in the pro-ductivity of the individual who has not yet stopped work, but whose activities have been affected.
Although considerations of this aspect of the problem are essential, we will go on to examine morbidity with the concrete el-ements available, in a effort to present its economic significance in a rough manner. Global and age rates, showing the eco-nomic importance of sickness, have been estimated in various countries, especially by insurance companies.
The United States was even established average percentages of lost production, by virtue of sickness and accidents, as well as owing to tardiness, in the disorganization of routines, in training time required for substitutions, and by lowered production resulting from other conditions of sickness. These percentages were estimated in 1929 - taking into account the cost of living at time - as being 4 billions dollars, corre-sponding during that year to approximately the ordinary expenditure of the Federal Government of the United States!
These evaluations did not include direct expenses with medical care, such as those paid for by the patients, by the government and public institutions, by philanthropic institutions and by the employers, also rep-resenting about 4 billions dollars.
In order to give an idea of the known coefficients, tables 1, 2 and 3 show: Table 1 - a survey of the Metropolitan Life Insurance Co. made in 1915/17; Table 2 - an estimate for 1930 of the cases of diseases and condi-tions requiring medical diagnosis and treat-ment; Table 3 - expenses with medical care for 1929, in the United States (26).
It is clear that figures in the three tables above vary considerably according to re-gion. Variations correspond not only to the value of the rates for the various diseases but also the occurrence of types of disease which are non-existent in one region and predominant in others.
Table 1 - Prevalence of Disabling Illness by Age and Sex, Metropolitan Life Insurance Co. Surveys, 1915-17(1)
Percentage of persons sick and unable to work Age Both sexes Male Female 0 - 14 1.1 1.1 1.1 15 - 24 1.3 1.2 1.4 25 - 34 1.6 1.4 1.8 35 - 44 2.1 2.0 2.2 45 - 54 3.0 3.3 2.8 55 - 64 4.8 5.4 4.2 65 + 9.5 10.6 8.7 (1) From Sydenstricker, Edgar, Health and Environment (1933), p. 33. Bases on some recent morbidity data compiled by Margaret Looms Stecker from the reports of the Community Sickness Surveys by Lee K. Frankel and Louis I. Dublin.
In addition, direct expenses with medi-cal care, in the various forms indicated in Table 3, show very different rates accord-ing to countries, since these expenses are related to the economic conditions of the region and to the political plans of public health as adopted for each country.
mor-Table 2 - Estimate of Cases of Disease and Conditions Requiring Medical Diagnosis and Treatment (1)
Disease Expectancy Estimated rates per cases, 1.000 persons United
all ages States 1930 TOTAL 936.30 114.954.000 Respiratory system 459.00 56.354.000 Digestive system 117.00 14.365.000 Acute diseases 92.50 11.357.000 Injuries from external causes 54.00 6.630.000 Puerperal state 23.56 2.893.000 Syphilis and gonorrhoea 23.00 2.824.000 General diseases 21.00 2.578.000 Diseases of the skin 19.90 2.443.000 Nervous and mental conditions 16.29 2.000.000 Non venereal diseases of the female genital organs 16.00 1.964.000 Diseases of the ear 15.00 1.842.000 Neuralgia, nevritis 13.10 1.608.000 Neurasthenics nervous exhaustions 13.10 1.608.000 Diseases of muscles, bones 13.00 1.596.000 Diseases of the kidneys 12.10 1.486.000 Diseases of the heart 11.70 1.436.000 Diseases of the eye 8.50 1.044.000 Other diseases of circulatory system 6.80 835.000 Non veneral diseases of male genital organs 0.75 92.000 (1) Expectancy rates from Lee, Roger and Jones, Lewis W., The Fundamentals of Good Medical Care, Committee on the Cost of Medical Care, Publication no 22 (1933), 97-100.
Table 3 - Total Expenditures for Medical Care(1) (in Millions of Dollars)
Sources of Funds
Service Total Patients Governments Philanthropy Industry Private physicians 1.090 1.040.0 ... ... 50 Private dentists 445 445.0 ... ... ... Secretaries and practical secretaries 193 193.0 ... ... ... Private graduate nurses 142 142.0 ... ... ... Private practical nurses 60 60.0 ... ... ... Hospital operating expenditures 656 278.0 300.0 54.0 24 Hospital new constructions 200 ... 100.0 100.0 ... Public health 121 ... 93.5 27.5 ... Private laboratory(2) 3 3.0 ... ... ...
Orthopaedics and other supplies(2) 2 2.0 ... ... ...
Glasses(2) 50 50.0 ... ... ...
Drugs(2) 665 665.0 ... ... ...
Organized medical services 29 7.9 16.0 0.2 5
TOTAL 3.656 2.885.9 509.5 181.7 79
(1) Source: Medical Care for the American People; the Final Report of the Committee on the Costs of Medical Care (1932), p. 14. The data, with a few minor exceptions, apply to the year 1929.
bidity is a fundamental matter in the study of the economic value of morbidity.
Climate conditions, basic economic conditions, the cultural development of the people, the degree of perfection of sanitary control, the stages of the main endemic dis-eases, the financial, technical, and human resources available for the control of pos-sible epidemics, and lastly, genetic condi-tions of the people result in a varied con-ception for each region of what should be considered as avoidable morbidity.
This can be seen in an incomplete but expressive manner by analyzing the “age curve of good health” and the already known curves representing specific mor-bidity tables, taking into consideration modern resources of preventive medicine. The modern world has the following means of reducing or eliminating avoidable morbidity: sanitation and sanitary engi-neering in general; health education and modern processes of health information; immunizations; epidemiological controls; chemotherapy; the antibiotics; residual in-secticides; and lastly, the resources of men-tal hygiene and sociology.
Precisely in those regions where the people have poor health rates, the control of disease is most rapid and efficient, and consequently financial results are most gratifying.
Although, as has been pointed out, sta-tistical investigations and surveys have not determined exactly the influence of mor-bidity on individual productivity and con-sequently on the total production of a popu-lation. It is well known that morbidity can reduce production over 50%.
For example, this is the case in some regions where incidence is high for malaria, trypanosomiasis, certain schistosomiasis, hookworm, etc. These diseases are of long duration and gradually reduce the produc-ing capacity of morbidity, used in organiz-ing the tables for insurance firms, consid-ers only the number of sick days which de-prive the worker of activity. As we have seen, in cases similar to those cited, the loss of production is not felt in the reduction of
days worked but in the high reduction of productivity of workers infested, but at work.
In addition to the above examples, vari-ous other diseases contribute in a high de-gree to reduced productivity, but are not frequent causes of deaths registered or main causes of absenteeism. Some of these are syphilis, certain types of diseases of the respiratory system, brucellosis and defi-ciency diseases. Under present conditions, public health services are in a better posi-tion to control these.
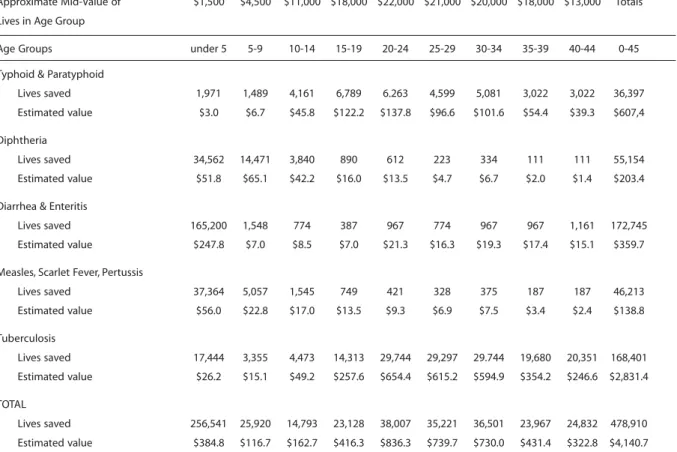
Another very interesting element in the economic study of morbidity, which can be used until specific coefficients become available, is the relation between the esti-mated number of cases of death and the number of deaths already determined for various types of diseases, at different ages, in some countries. Tables 4 and 5 are ex-amples (26).
These estimates, although constituting values of little precision, are very important in studies tending to establish numerical value of the cost of health and should be used freely. Often - as occurred in Engel’s studies, when he detailed presumable val-ues of the expenses of consumption at suc-cessive ages (4) - progress in a determined field of applied statistics results from hy-potheses and the fixing of empirical data for approximate solutions.
Table 4 - Deaths and Estimated Number of Cases of Certain Common Diseases of Childhood, USA, 1934(1)
Disease Estimated Deaths cases
Data relating to rates for lesions result-ing from accidents and traumatisms of all kinds are very poor. This also contributes in a pronounced manner to lowering pro-duction, whether in determining conditions of partial or total disability, or in determing disturbances of lesser importance capable of reducing productivity in the normal field of work of the individual affected, requir-ing correction by the consumption of con-siderable financial resources for readaptation to new activities.
Therefore, in a general way, four forms of economic influence of sickness may be considered:
- Number of days lost to production
by absence of the worker;
- Percentage reduction in productiv-ity of individuals at work, which may also be computed as work days; - Percentage reduction in production
because of individuals temporarily or permanently disabled, which may also be computed as work days; - Direct expenses with medical-social
assistance necessary for the preven-tion, reducpreven-tion, or elimination of ef-fects of disease.
In evaluating the cost of sickness, all four forms will be computed during the annual period referring to the evaluation.
Examples of tables of general morbidity and by disease, usually set values for ages 15 to 80 years, since these are especially used in calculating rates for premiums on sickness insurance taken out mainly to
cover periods of inactivity caused by sick-ness. In this study, it is also necessary to verify morbidity for ages 0 to 15 years and over 80 years.
In a study by Carlo Pinghini (27) we find the main morbidity tables of Italy, France, England, Germany, and Switzerland, as well as one, by diseases, organized for commer-cial employees in Italy. However, as has been pointed out, these tables show coeffi-cients much lower than those which must be taken into account in calculating the cost of sickness.
Other tables organized on the basis of surveys by the Metropolitan Life Insurance Co., by the United States Public Health Ser-vice, and by the Committee on Costs of Medical Care also show the economic ef-fects of disease (20).
It is interesting to note that, according to data of the “German Sickness Insurance”, the duration of illnesses resulting in inabil-ity to work tends to grow in proportion to the development of the work of insurance companies which undertake early diag-noses and prompt treatment. This increase was also verified in the “British Health In-surance System” (28).
This apparent paradox is probably due to two basic causes:
1st) Inclusion, among the disabling
dis-eases, of types which formerly did not nor-mally hinder work owing to lack of sickness insurance;
2nd) Because the worker who is
pro-tected by sickness insurance seeks treat-ment until he is completely well and does not return to work while still convalescing as was normally the case prior to the ben-efits of insurance.
2) Influence of Morbidity on the
Maintenance of Public Health Systems
Although the general principles of pub-lic health technique are the same for the most varied types of disease prevalence, of economic level and cultural development, working methods must vary greatly accord-ing to needs.
Table 5 - Deaths and Estimated Number of Cases of Tuberculosis, Malaria, and Typhoid Fever in the United States, 1934(1)
Disease Deaths Estimated cases(1)
Tuberculosis 71.609 644.000 Malaria 4.520 2.700.000 Typhoid and 4.237 42.000 paratyphoid fever
Starting with underdeveloped regions, priority is given to the phase of sanitation, including the provision of safe drinking water and proper excreta disposal.
Most of the efforts to control sickness without first instituting the above basic sanitation measures are ineffective. Sedgwick and MacNutt (29) gave the name of “Mills-Reinke Phenomenon” to the par-allel decline of typhoid fever and intestinal infections resulting from water treatment, with accompanying lowering of general and infant mortality excluded those causes of disease. In regions of the rural type, no pub-lic health measure is so effective and give such quick results in reducing morbidity as the proper establishment of water and sewer systems. Sanitation services contrib-uting to the reduction of morbidity in un-derdeveloped regions must be maintained on constantly higher levels at the rate that these regions are developed economically and attain better health rates. Therefore, in large cities the most advanced services of sanitary engineering guarantee the absence of epidemics or of endemic diseases and should be considered as permanent factors of lowered morbidity.
Another circumstance which should be given priority is the group of diseases pro-duced by microparasites, whether transmit-ted by vectors or not.
The discovery of the antibiotics and of residual insecticides makes the control of disease a matter of simplicity and feasibil-ity formerly unattainable by even the best equipped systems of public health. Previ-ously unsolvable problems, from the finan-cial or technical point of view, were trans-formed fundamentally into matters of or-ganization and the availability of normal resources of administration. Reduction al-ready obtained in this sector of sickness and what can hopefully be expected in the near future will permit arriving at the type of re-sidual morbidity and consequently other and more complex systems of public health. We therefore have two stages where the aspects of morbidity and of the public health systems for combating morbidity are
interrelated: sanitation and the control of communicable diseases. Many regions of the civilized world do not as yet enjoy the benefits of the first and much less of the second, resulting in the enormous amount of sickness which could be avoided by the already known and proven methods.
straying from the tendency toward residual morbidity, in many cases practically achieved and in others still far distant. There is not doubt that for each type or stage of morbidity there is an appropriate public health system.
Having examined the tendencies of the life curves, according to the various stages of mortality and of morbidity, it may be -theoretically at the present moment - as-serted that the abolition of the present pre-dominant diseases would give place to the purely degenerative or deteriorating dis-eases.
This fourth phase will require true knowledge of life and of aging, which would determine improvement of the potential life span.
3) Method of Determining the Cost of
Morbidity
A) General Considerations A) General Considerations A) General Considerations A) General Considerations A) General Considerations
The above evaluations of the economic influence of disease by means of global in-dices may be summarized in three groups of estimates:
- Expenses with medical care in all
forms, such as that undertaken by government public health services, that financed by semi-official and philanthropic agencies, and also that sought directly by patients. - Loss of production owing to
absen-teeism caused by diseases and acci-dents and also by tardiness by dis-organization of routines, and by low-ered output of all types, indirectly caused by absenteeism.
- Reduction caused by sub-normal
states of health in individual produc-tivity and consequently in the total production of population groups. This last item has been given the least consideration in statistics, resulting in the impression that it is of minimum influence on the losses caused by morbidity whereas, at least in determined regions, it may be stated that the part it plays is of the greatest
economic significance in determining the value of health.
Hence the necessity for developing demo-econometric studies, by means of general surveys and specific sampling in order to more precisely determine the losses, by period and region, which should be attributed to avoidable sickness, in the total production of the population.
In this study, we suggest adopting the following method to determine the cost of morbidity.
B) General Morbidity B) General MorbidityB) General Morbidity B) General MorbidityB) General Morbidity
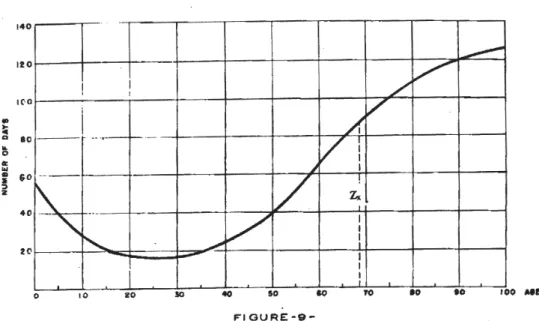
It first becomes necessary to determine the characteristic Zx, representing the total number of sickness-days, verified in the in-dividuals of the population group under consideration in the period of one year.
In order to determine this, consider-ation must be given to the three first forms of economic influence of morbidity sum-marized in item 1 of this Chapter, wherein morbidity is described as any disturbance, whether reducing productivity or causing specific consumption.
Until it becomes possible to determine numerically the limits of cases of avoidable morbidity and those that may be consid-ered residual morbidity we may first use the symbol Zx in calculating from the age 0 to the age w, the highest occurring in the population under consideration.
The curve indicated in Figure 9 shows the general form of the curve obtained by determining Zx, in accordance with the above principle.
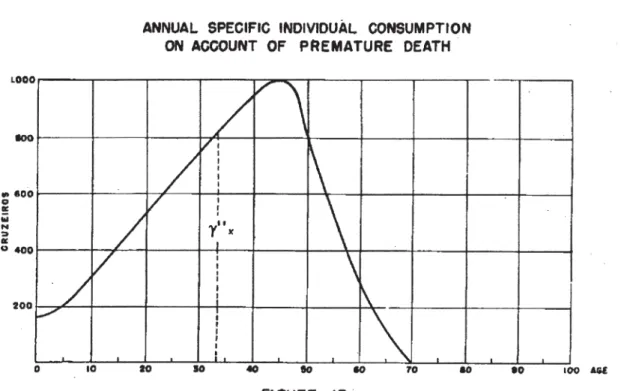
C) Annual Individual Specific C) Annual Individual SpecificC) Annual Individual Specific C) Annual Individual SpecificC) Annual Individual Specific
Consumption on Account of Morbidity Consumption on Account of MorbidityConsumption on Account of Morbidity Consumption on Account of MorbidityConsumption on Account of Morbidity
region under consideration and especially with the policy of public health adopted in each region.
In regions where the economy is not highly developed, this curve should have a form similar to that of Figure 10. Statistical determination of the numerical values of this curve offers no greater difficulties than determination of the values of Zx.
D) Annual Total Production Lost on D) Annual Total Production Lost on D) Annual Total Production Lost on D) Annual Total Production Lost on D) Annual Total Production Lost on Account of Morbidity
Account of Morbidity Account of Morbidity Account of Morbidity Account of Morbidity
Having arrived at the curve of values for Zx, the values of total annual production lost at each age x, owing to sickness, will be found by drawing the curves of ordinates sx for the various ages, according to the formula:
π
=
σ
.
x
300
px
.
Zx
x
)
2
(
If we divide the values of Zx.px by 300 we will have for each age a figure equivalent to the number of individuals who, during one year, will not produce a value equal to πx,
the annual individual production assumed in this study for 300 days of effective work.
Figure 11 shows the form of this curve for ordinates σx, based on the values taken for drawing the curve of ordinates πx (Fig-ure 1) and those for the curve of ordinates Z x (Figure 9).
E) Annual Total Consumption Increased E) Annual Total Consumption Increased E) Annual Total Consumption Increased E) Annual Total Consumption Increased E) Annual Total Consumption Increased on Account of Morbidity
on Account of Morbidity on Account of Morbidity on Account of Morbidity on Account of Morbidity
Having arrived at the curve of values for gx, the values of total specific annual con-sumption added, at each age, by virtue of sickness, will be obtained by drawing the curve of ordinates jx, for the various ages, according to the formula:
'x
.
300
px
.
Zx
x
)
3
(
ϕ
=
γ
If we divide the values of Zx.px by 300 we will have for each age a figure equivalent to the number of individuals who, during one year, will consume a value equal to ϕx.
CHAPTER III
COST OF MORTALITY
1) Natural Death and Premature Death
in the Moral Field and in the Financial
Field
Observations throughout the centuries have shown that pluri-cellular organisms have a limited life. The death of these or-ganisms is normally preceded by phenom-ena given the global denomination of ag-ing. This aging consists essentially in a de-crease of physiological activity and in a modification of the morphological ele-ments making up the body. It reduces the individual’s capacity for reproducing the species and makes him less resistant to ex-terior harmful agents.
Science has not yet definitely established whether aging is part of the pathological pro-cesses. This point is of limited interest in this study since an attempt is being made to es-tablish the concepts of natural death and of premature death, independent of the pri-mary causes of death. It therefore suffices to know the data of causes of death and the ages at which death occurs.
Hence it is proposed to give a statistical meaning to premature death. Applying this at each period in a determined region, vary-ing rates will be maintained that are spe-cific for those conditions.
Drawing the distribution curve of the number of deaths in a region, by age, for 100.000 persons supposedly born at the same time, on the basis of survival tables, the age corresponding to the maximum or-dinate over age 10 is considered as the nor-mal span of life, according to a denomina-tion introduced by Wilhelm Lexis. By draw-ing to the left of the maximum ordinate a branch symmetrical to the right descend-ing branch (see Figure 5), a curve is con-structed in the form of a bell, of the type of accidental error curve.
This latter curve, according to Lexis, out-lines the area of deaths where life was ter-minated mainly by natural exhaustion of the vital capacity. The remaining area shadowed
with lines consists of deaths due to abnor-mal causes, especially those resulting from insufficiency of sanitary conditions. There therefore represent premature deaths, the majority of which can be avoided by im-provement of the health rates. Figures 13, 14 and 15 show regions varying greatly from the viewpoint of health rates and show the cor-responding ordinates at the respective ages when premature deaths occur.
A simple analysis of these graphs, con-structed for each region, show how, from the financial point of view, priorities should be established for the main activities of public health services in each region.
Theses graphs, however, can and should be drawn as detailed as possible, breaking down each ordinate into the parts applicable to each cause of death. For example, Figures 16 and 17 emphasize the main causes of death in each of those regions. An analysis of these graphs shows the fields in which the control of premature mortality, and conse-quently of its causes, should be most intense. In addition to the differences found for the various regions and for the various pe-riods of time, as well as the variations in rates by sex, other aspects require an analy-sis of mortality for good interpretation of economic characteristics by using the cus-tomary indices.