*e-mail: [email protected]
Influence of Thermal Treatment on Porosity Formation on Carbon Fiber from Textile PAN
Jossano Saldanha Marcuzzoa*, Choyu Otania, Heitor Aguiar Polidorob,c, Satika Otanib
aInstituto Tecnológico Aeroespacial – ITA, São José dos Campos, SP, Brasil bMultivácuo Indústria e Comércio Ltda, São José dos Campos, SP, Brasil cCentro de Tecnologia e Ciência – CETEC, São José dos Campos, SP, Brasil
Received: May 6, 2012; Revised: August 20, 2012
Activated carbon fibers (ACFs) are known as an excellent adsorbent material due to their particular characteristics such as their high speed adsorption rate and for being easy to handle. The ACFs are commercially manufactured from carbon fibers (CF) which receive an additional activation process and can be produced from celluloses, phenolic resin, pitch and Polyacrylonitrile (PAN). In the present work, the oxidized 5.0 dtex textile PAN fiber was carbonized to CFs formation. During the carbonization process in different heating rates, the topographic features changes on fibers were monitored in order to determine the best carbonization condition for CFs production to be used as raw material for ACF. Different heating rates and maximum temperature of treatment were tested and the results indicated that it is possible to produce poorly activated carbon fiber, directly from oxidized textile PAN fiber, by one single step production process.
Keywords: carbon fiber, activated carbom fiber, activated carbon, adorption materials, carbonization
1. Introduction
Activated Carbons (AC) (granular, powdered or molded forms) are one of the most widely used adsorbent materials due to their ability to act over a wide range of adsorbates. Normally, ACs are used for drinkable and waste water treatment and in many other applications where the removal of generally dispersed contaminated molecules is desired1.
Activated carbon fibers (ACFs) have special characteristics when compared with common activated carbons (granular or powder), allowing their transformation into fabric, woven or yarn forms what give them self-sustainable characteristics. In addition, ACFs show well defined pore structures on their surface which provide a high and fast adsorption capacity for specific components2,3.
In spite of all advantages of ACFs application, their use has been limited due to their relatively high cost.
One of the most important characteristics, which make ACFs a very special adsorbent material, is their pore size distribution. The architecture of the pores presented by common AC is a ladder-like structure. In this structure, micropores are located inside mesopores, which in turn are inserted into the macropores structures. The main mechanism by which the molecules are adsorbed can be summarized by a sieving process, where molecules first cross the macropore, secondly the mesopores and subsequently find these micropores where they are adsorbed. In the ACFs case, a large amount of micropores can be found directly on their surface leading to a faster and less energetic adsorption mechanism, especially for gases4.
The common methods used to produce ACFs from a carbon fiber (CF) are not far from those used for AC production. The process can be simply described as a thermal treatment oxidant atmosphere at temperatures between 700 and 1000 °C2,3,5.
An efficient activation process can be performed by using a suitable feed gas, which reacts not only with the carbon surface, but also with the bulk atoms6. If the reactions are
carried out only on their surface, the CF loses all atoms on its surface and does not develop porosity, but if the oxidation takes place on bulky carbon atoms, a rapid damage in the mechanical property of fiber can be promoted. The pore distribution characteristics and all physical characteristics of ACFs are strongly dependent on activation process parameters and on the raw material (carbon fiber) quality5,6.
All the results presented in this paper are focused on carbon fiber surface feature, considering the influence of the carbonization process parameter, and they are an integrant part of a main research project “the study of technical and financial aspects of activated carbon fiber production based on commercial textile PAN fiber”.
2. Experimental
The carbonization was performed at final temperatures ranging from 600 °C up to 1100 °C, applying two different heating rates: 10 °C/min (low heating rate) and 100 °C/min (high heating rate). The process time for maximum temperature was set in 20 minutes for all carbonization experiments and at the end of the process the furnace was opened and the tube was removed to promote a condition of fast cooling to the room temperature.
The carbonization processes were analyzed by mass loss and shrinkage measurements of each sample. The densities were determined by the sink-float method (ASTMC 3800) and specific gravities were measured by helium ultra pycnometer. The microstructures of the fibers were analyzed using Scanning Electron Microscopy (SEM) NovaNanoSEM 400. The specific surface area and pore size distribution were determined by means of isotherm CO2 using the Micromeritics ASAP 2020 and the DA analysis method.
3. Results and Discussion
3.1.
Oxidized PAN fiber analysis
The oxidized PAN fiber experimentally produced b y M u l t iva c u o ( M V- O PA N ) , a n d c o m m e r c i a l (PANOX® - 5.0 dtex) characterization results, are presented
in Table 1. The MV-OPAN fiber presents higher density
and similar mechanical properties in comparison with the PANOX®. Main differences between these two types of
fibers are their filament cross section geometry and average moisture adsorption capability. Our fibers present a beam like cross section while the PANOX® one is circular, and the
humidity content is 5% which is lesser than 9% of PANOX®,
considered suitable for CF precursor oxidized PAN fiber7.
3.2.
Mass loss and shrinkage of MV-OPAN fibers
during their carbonization
The curves presented in Figure 2 show the mass loss evolution as a function of the carbonization temperature for MV-OPAN fiber for both heating rates used in this work (10 and 100 °C/min). It can be observed that the volatile matters gradually evolved producing mass loss in the order of 50 to 60% for any type of tested treatments. Both curve profiles are similar until 1000 °C, when a saturation behavior is observed for lower heating rate curve, not visible in the other one. This fact shows us that a lower heating rate promotes a higher molecular condensation reaction leading to a higher carbon yield process.
Figure 3 shows the fiber shrinkage rate as a function of carbonization temperature for both heating rates (10 and 100° C/min). In spite of the similarities observed in the mass loss analysis (Figure 2), the fibers shrank in a different way, showing a certain coherence only for treatments at
Figure 1. Carbonization set up used to produce carbon fiber sample from oxidized textile PAN fiber.
Table 1. MV-OPAN fiber and PANOX® LB C076 SSC properties.
Properties MV-OPAN fiber PANOX® LB C076 SSC
Single filament metric count (±0,3 dtex) 4.8 5
Tow’s linear density (g/m–1) 50
-Mean filament diameter (µm) Nd 21
Density (±0,01 g.cm–3) 1.36 1.35
Mean moisture absorption(%) 4.5-5.3 9
*Elongation at break (MPa) 15.3 (10-22) 16-26
*Mean tensile strength (MPa) 197 (122-252) 210
*Mean tenacity (cN/tex) 15.8 (12-21) >15
temperatures between 900 and 1000 °C. Out of this range of temperatures two heat treatments presented two samples with completely distinct shrinkage behavior, inferring that
the physical variation of fibers are strongly affected by
energy flux.
For a low heating rate condition, it was observed a gradual and monotonic increase in the shrinkage, with saturation at 9% for temperatures higher than 950 °C. This curve profile can be correlated with the gradual mass loss observed (Figure 2) for this carbonization condition, while
the fibers treated at higher heating rate showed a decrease in their shrinkage for treatment between 650 and 750 °C, followed by a rapid increment region for higher temperatures (until 900 °C). The shrinkage for both treatment conditions attained similar value in the temperature range of 900 to 1000 °C, and finally at temperatures above 1000 °C a new shrinkage is observed only for samples carbonized at a higher heating rate.
The correlated curves analysis presented in figures 2 and 3 leads to the conclusion that MV-OPAN fiber
Figure 2. Mass loss of the fiber during carbonization for two different heating rates.
and the cross section (b) SEM micrographs of MV-OPAN.
The analysis of these micrographs shows that the PANOX®
fiber has both a circular cross section and a lamellar type internal structure aligned with external longitudinal
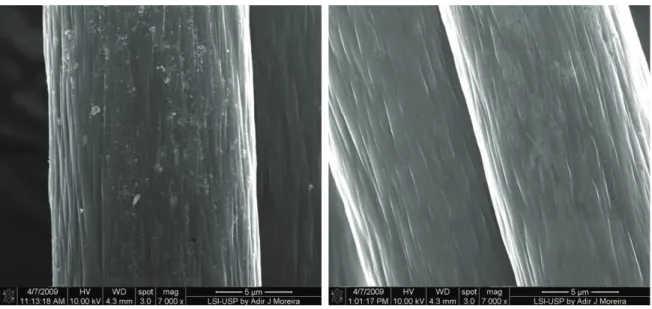
fissures. While, the MV-OPAN (Figure 6) shows a bean-like cross section and smoother internal structure. Along the longitudinal surface of the MV-OPAN a similar pattern with slightly rough and irregular surface can be observed. These different morphology aspects can be indebted to the different polymer composition of the fiber precursor and also to the different oxidation conditions performed on the fibers. Figure 7a, b show the SEM micrographs obtained for samples treated at 600 °C with 10° C/min and 100° C/min, respectively. The comparative analysis of these micrographs with those obtained from MV-OPAN fiber (Figure 6b) shows that the surface of 600 °C treated fiber is quite similar to the former one, presenting a smoother area with no holes, carbonization is strongly influenced by the heating rate
in terms of mass loss (process yield) and shrinkage (fiber physical characteristics).
3.3.
Specific gravity and density variation of
fibers thermally treated
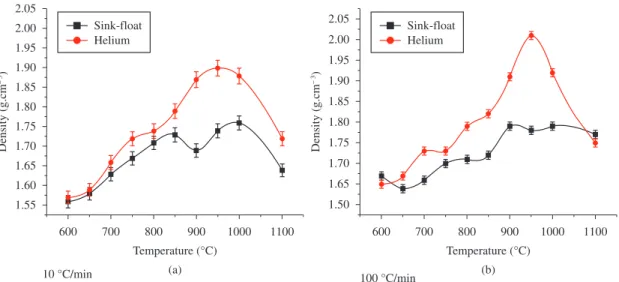
The sink-float density measurement results and helium ultra pycnometer specific gravity determination for samples treated by 10 °C/min and 100 °C/min are respectively shown in Figure 4a, b.
The sink-float method is based on the net volume, while in the helium ultra pycnometer, the volume is deducted by all its accessible pore volume generating higher density values for fibers. Consequently, the differences of values produced by these two methods for the same samples can be inferred to be due to the amount of pores which are not filled by solvent but accessed by He gas.
The analysis of the curves showed in Figure 4a reveals that the pycnometer density of samples, treated at low heating rate, increases with temperature until a maximum value of 1.90 g.cm–3 at 950 °C, and above it is observed a
decrease behavior. The sink-float density curve showed two maximum, first at 850 °C and second at 1000 °C, and a valley between them with minimum value (1.68 g.cm–3) at 900 °C.
Similar effects and shapes of curves are also observed for samples treated at higher heating rates (Figure 4b); however, three bands with maximum at 650, 850 and 950 ºC are observed in curves of both methods of density determination. It was verified two maximum differences, first at 900 °C and second at 950 °C, respectively for 10 °C/min and 100 °C/min. The differences observed can be attributed to a high volatilization reaction evolved in higher heating rate treatment, when compared with the lowest one, in which a polymerization reaction is more pronounced and leads to a lesser level of mass loss (Figure 2).
3.4.
Microstructure evolution during the heat
treatment analyzed by SEM
Figure 5 shows the commercial oxidized PAN fiber micrographs, and figure 6 shows the longitudinal surface (a)
Figure 4. Fiber density measurement performed by means of sink-float and helium ultra pycnometer techniques a) 10 °C/min; b) 100 °C/min.
both samples treated at 1100 °C. Fibers produced on these conditions display a relatively smooth surface without holes, damages, pits or any other discontinuities.
Representative micrographs from the samples treated at 900 °C-10 °C/min, and 950 °C-100 °C/min are respectively shown in Figure 9a, b. These treatment conditions are those which provided the highest differences between density values obtained by two distinct measurement methods (Figure 4a, b).
The lower heating rate produces a material with microstructure of nooks at 900 °C and apparently deep grooves leading to the rough comparison of this texture to a “tree bark” (Figure 9b). Moreover, the sample treated at damages, pits or any other surface disconformities. There
are some “powdered” materials on the surface (Figure 7a), but these are assigned as dust particles deposited on the
fibers without any consequence to their structure and any other fiber properties.
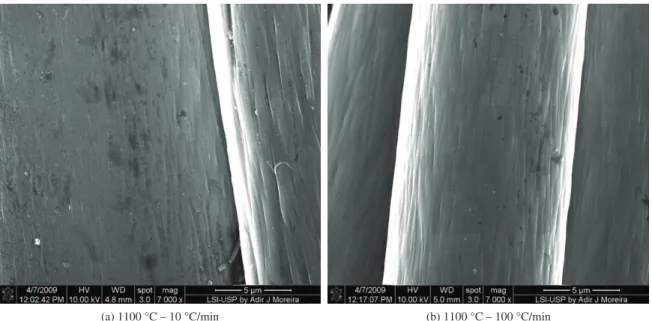
Increasing the heat treatment temperature up to 1100 °C a general smoothing on the fibers surface can be observed for both heating rate conditions. This fact is shown by micrographs presented in Figure 8a, b, for samples treated at 10 and 100 °C/min conditions at 1100 °C.
A gradual smoothing of the fiber external texture is a result of a carbon structure ordering process which gives rise to a better compacted structure, observed on the surfaces of
Figure 6. MV-OPAN SEM micrograph: (a) cross section and (b) longitudinal surface.
Figure 8. Surface micrograph of fibers heat treated at 1100 °C using two different heating rates a) 1100 °C-10 °C/min; b) 1100 °C-10 °C/min. higher heating rates produces a drastically damaged surface
by homogeneously distributed polidispersive macro and mesopores (Figure 9b).
3.5.
Specific surface area and pores size
distribution for samples treated at
900 °C-10°C/min and 950 °C-100 °C/min.
For the specific objective to study micropores formation the CO2 isotherm at 273 K was performed by Micromeritics ASAP 2020, these isotherms are showed in Figure 10. The DA (Dubinin-Astakhov) method8 was applied to
determine total micropores volume, pores size distribution and micropore surface area. The results are summarized on Table 2.
Quantitative analyses show that faster heating at 950 °C is the treatment condition that produces more micropores volume fraction. The specific micropres surface area of this sample was about 8% higher than that produced by lower heating rate condition.
Figura 9. SEM surface micrographs of fibers heat treated using a) 900 °C-10 °C/min; b) 950 °C-100 °C/min. Table 2. CO2 isotherm analysis.
Samples SDA
(m2/g –1)
VDA (m3/g
–1)
DDA (nm)
Dp (nm)
Ea (kJ/mol–1)
10 °C/min 348 0.135 1.85 2 24.44
100°C/min 369 0.142 1.9 2.2 25.04
Figure 10. CO2 isotherms performed by Micromeritics ASAP 2020.
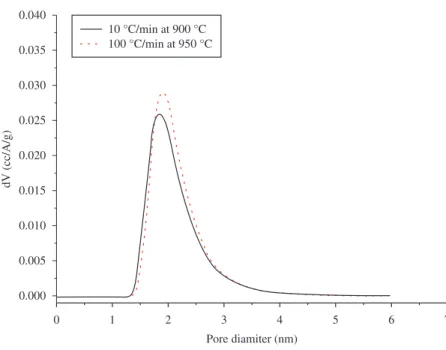
Figure 11. The carbon fibers pore size distribution produced by carbonization at 900 °C and 950 °C.
Table 3. Pores size classification.
Pore size
(nm) 0.7 1.4 2.0 3.2
IUPCA Microproes Mesopores
Brunauer/ Dubinin
Ultra
miicropores Micropores Supermicropores
The surface structures and larger pores dimensions for both heating treatment can be observed by micrographs. The 950 °C-100 °C/min (Figure 9b) shows deeper grooves between well developed carbon fibrils and circular pores which can be classified as meso and macro pores, being both absent in 900 °C-100 °C/min sample (Figure 9b).
Figure 11 shows the pore size distribution curves for both samples. The pore size distribution has a very similar shape for both cases, but for the highest heating rate, the total pore volume is about 5% higher than that presented by the lower heating rate sample. Considering the IUPAC9
and Brunauer/Dubinin10,11, micropore definition (Table 3) all
pores found in these samples can be classified as micropore.
4. Conclusion
there can be considered as a positive signal to perform a subsequent activation process, which can probably transform them into an interesting material to apply as adsorption or sieving media.
Acknowledgements
The authors thank Alessandro Coelho of Radicifibras
Ind. e Com. Ltda for providing fiber samples and equipment for fiber analysis. Ricardo Bicudo for the oxidized PAN fiber analyses. Maria Lucia of INPE and Adair J. Moreira of LSI-USP for SEM analyses. FAPESP for the financial support what made this work possible.
The density determination by two distinct methods can clearly show the presence of micropores on carbon fiber surface.
The open pores produced on Carbon Fibers surface by 950 °C-100 °C/min are polydispersive type, with diameter ranging from 1.3 to 3.5 nm (DA) and also larger pores were observed by SEM micrographs. But it is possible to observe narrow pick below 2 nm pores size
The micropores structure on produced Carbon Fibers gives a Specific Surface Area for micropores of 348 to 469 m².g–1 (DA), which are both relatively poorly valuable
to classify these fibers as highly activated materials, but
References
1. Marsh H and Reinoso FR. Activited Carbon. Elsivier; 2006.
2. Linares-Solano A and Cazorla-Amorós D. Adsorption on activated carbon fiber In: fiber. In: Bottani E and Tascón J.
Adsorption on activated carbon fiber: Adsorption by carbon.
Elsevier; 2008.
3. Yoon SH, Koray Y and Mochida I. Carbon fibers and activated carbon fibers.In: Marsh H and Rodríguez-Reinoso F. Sciences
of carbon materials. University of Alicante; 2000.
4. Mochida I, Korai Y, Shirahama M, Kawano S, Hada T, SeoY et al. Renoval of SOx and NOx over activated carbon fiber. Carbon. 2000; 38: 227-239. http://dx.doi.org/10.1016/ S0008-6223(99)00179-7
5. Carrott PJM, Nabais JMV, Ribeiro Carrott MML and Pajares JA. Preparation of activated carbon fibres from acrylic textile fibres. Carbon. 2001; 39:1543-1555. http://dx.doi.org/10.1016/ S0008-6223(00)00271-2
6. Nabais JMV, Carrott PJM and Ribeiro Carrott MML. From commercial textile fiber to activated carbon fiber. Materials
Chemistry and Physics. 2005; 93:100-108. http://dx.doi.
org/10.1016/j.matchemphys.2005.02.031
7. Morgan P. Carbon fiber and their composites. London: E d . Ta y l o r & Fa n c i s G r o u p ; 2 0 0 5 . h t t p : / / d x . d o i . org/10.1201/9781420028744
8. Gil A and Grange P. Application of the Dubinin-Radushkevich and Dubinin-Astakhov equations in the characterization of microporous solids. Colloids and Surfaces. 1996; 113:39-50. http://dx.doi.org/10.1016/0927-7757(96)81455-5
9. Sing KSW. Reporting physisorption data for gas/solid systems with special reference to the determination of surface area and porosity. Pure and Applied Chemistry. 1985; 57:603-619. http:// dx.doi.org/10.1351/pac198557040603
10. Brunauer S. Surface area determination. London: Ed. D.H. Everett and R.H. Ottewill.; 1970.