Recebido em 07/10/2013, texto inal em 07/10/2013.
(Sobre eiciência de arco em Soldagem GTAW)
Nils Stenbacka
University West, Trollhättan, Sweden. nils.stenbacka@hv.se
Abstract
The aim of this study was to review the literature on published arc eficiency values for GTAW and, if possible, propose a narrower band. Articles between the years 1955 – 2011 have been found. Published arc eficiency values for GTAW DCEN show to lie on a wide range, between 0.36 to 0.90. Only a few studies covered DCEP - direct current electrode positive and AC current. Speciic information about the reproducibility in calorimetric studies as well as in modeling and simulation studies (considering that both random and systematic errors are small) was scarce. An estimate of the average arc eficiency value for GTAW DCEN indicates that it should be about 0.77. It indicates anyway that the GTAW process with DCEN is an eficient welding method. The arc eficiency is reduced when the arc length is increased. On the other hand, there are conlicting results in the literature as to the inluence of arc current and travel speed.
Keywords: Gas Tungsten Arc Welding; GTAW; TIG; Arc eficiency; Process parameters;
Resumo: O objetivo deste trabalho foi o de fazer uma revisão na literatura de valores publicados de eiciência térmica do arco do processo GTAW e, se possível, propor uma banda mais estreita de valores aceitáveis. Valores publicados para GMAW CC- mostram situar-se numa larga faixa, entre 0,36 a 0,90. Muitos poucos estudos cobrindo CC+ e CA foram encontrados. Informações especíicas sobre a reprodutibilidade em estudos calorimétricos tanto quanto em modelagem e simulação (considerando que tanto erros aleatórios como sistemáticos são pequenos) são escassos. Uma estimativa do valor médio da eiciência do arco indica ser este de 0,77. Isto indica, de qualquer forma, que o processo GTAW com CC- é um processo de grande eiciência. A eiciência do arco é reduzida quando o arco é alongado. Por outro lado, existem resultados conlitantes na literatura quando se estuda a inluência da corrente de soldagem e velocidade de soldagem.
Palavras-Chave: GTAW, TIG, Eiciência de arco, parâmetros de soldagem
1. Introduction
Why is it important to know the arc eficiency at TIG-welding more precisely? GTAW is probably the largest arc
welding method of all when it comes to welding stainless steels,
far larger than for instance GMAW when measured by shielding gas consumption. Of great concern is to know how much of the energy is actually transferred to the material being welded. During the past years a wide range of arc eficiency values for GTAW have been reported in the standard literature, values between 0.22 – 0.80are for instance mentioned [1 - 4]. The intention of this report is to examine background references and the relevance of determined values for GTAW, and if possible to postulate a narrower band for the arc eficiency, ηa.
Arc eficiency (ɳa) (also called process eficiency, thermal
eficiency or heat transfer eficiency) plays an important
role in many aspects of welding technology. The concept is used for example when estimating process performance, in calculating cooling rates or cooling times, when modeling fusion characteristics etc. In order to accurately utilize modern FEM heat-low-models it has become more important to know ηa more precisely, and how different process parameters (for
example current, welding speed, electrode tip angle and type of shielding gas) will inluence the arc eficiency.
Arc eficiency ηa is normally deined as;
ηa = qw/qn(1)
Where qw is the net power input [J/s] transferred to the plate
(substrate) and qn is the gross (or nominal) power input at the
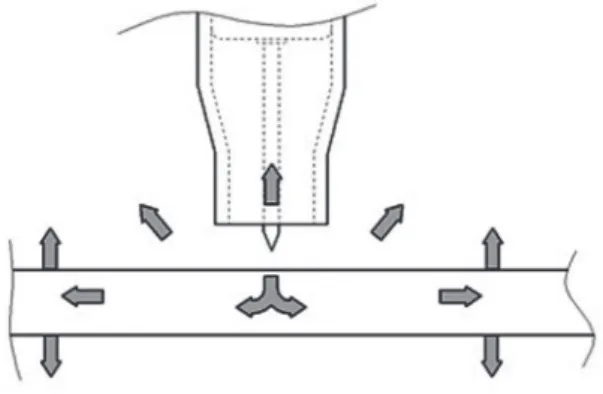
arc from a certain power source. The part not transferred to the work piece; (1 - ηa), is lost through radiation, convection,
On arc eficiency in Gas Tungsten Arc Welding
methods have been used which will be commented further on.
Fig 1. TIG torch and the heat transfer around it.
The gross energy input during welding can be measured in different ways. In the case of DC arc welding qn is simply the
product of current I [A], voltage U [V] at the arc, and welding time t. In the case of a sinusoidal AC current, effective values of
voltage u and current i can be used together with the power factor
when estimating arc power; P = uicos(φ). A better estimate of the gross arc power, when the current and voltage are highly luctuating for example in short arc or pulsed arc welding, is to use the arithmetic mean power value. It can be calculated from measured instantaneous current i
i and voltage ui values at the arc;
Pav = ∑(uiii)/n(2)
Summation is made from i =1 to i =n. When the sampling
frequency n tends to high values eq. (2) is replaced by;
Pav = (1/T) ∫u(t)i(t)dt(3)
This physically deines the average power. Integration is made over the time interval T of interest [19].
Melting eficiency ηm(also called fusion eficiency or thermal
eficiency of fusion),is another important process property. Process performance can for instance be described by the two parameters ηa and ηm. The arc eficiency (ɳa) must be known
in order to experimentally determine the melting eficiency for a given process or a given set of welding parameters. Over the years it has been shown, for various processes, that only a fraction of the effective energy supplied to the substrate is actually used for melting. The remaining part is lost through heat diffusion in the base material. The ratio of the power used for melting (fusion) qm divided by the power actually supplied qw to
the substrate deines the melting eficiency according to;
ηm = qm/qw(4)
Analytical models for calculating ηm have for instance been
given by [3-4]. For a rapidly moving high power heat source about 48% of the effective (net) heat input is available for fusion (2D case and no iller material). This is an analytically calculated value based on heat diffusion exclusively perpendicular to the moving heat source and without any addition of iller material [4]. Experiments support this value [14, 16, 21]. It is interesting
to note that the analytical 2D model and experimental support for it was given already in 1952 by Wells [21].
With lower travel speeds, heat conduction in the moving direction of the power source will become more important and ηm will consequently be lower. For slow moving power sources,
like manual GTAW, the thermal eficiency will indeed be much lower. A value of about 0.16 has for instance been reported by [17] in experiments with slow moving GTAW (travel speed about 0.5 m/min).
2. Methods to determine arc eficiencies
Two basically different routes can be selected in order to determine the arc eficiency (ɳa). One is through calorimetric
experiments and the other one is through calibrating heat low models with measured parameters (for instance depth of penetration, fused area or maximum temperature at a certain location from the weld centerline etc.). In both cases there are errors connected to the used method. Calorimetric experiments can be said to be a direct approach, whereas calculations through modeling and simulations (relaying on several fundamental assumptions inherent to the model) is an indirect
way of estimating ηa. In the past calorimetric experiments was
used extensively, whereas modeling studies have increased in popularity during later years partly because of increased accuracy and speed in the calculations (for example with FEM). Calorimetric experiments measures the net energy input
qw transferred to the substrate. The following methods are for
example mentioned [15].
1. Cooling water is used to remove the heat from the substrate
during welding, and the eficiency is estimated from the temperature rise and low of cooling water.
2. The workpiece is dropped into liquid nitrogen directly
after welding and the weight loss of liquid nitrogen due to vaporization is measured.
3. Welding is performed on a plate placed at the bottom of a calorimeter, the electrode is withdrawn and the lid of the
calorimeter is quickly closed. Total heat transfer to the workpiece is estimated by integrating the calorimetric signal over the entire cooling time.
There are of course variants of the third case [18]. One variant of the irst one for, and often used in GTAW experiments, is to mount a ixed TIG torch with the arc burning against a water cooled copper anode [6, 12], but other anode materials has also been used [5]. Some argue that for a given arc current and voltage the heat intensity on a water cooled anode (DCEN) is greater than that on a molten weld pool, because the convective heat transport by the plasma to the anode would be greater [12]. However it has also been pointed out that about 89% of the energy transfer from an arc is by electrons [6]. Convection and radiation accounts for the remaining 11% and could be affected by a lower surface temperature. But it should not have a major effect on arc eficiency (ɳa), although a difference in the order of
4 to 6% has been estimated [13].
unless systematic errors are accounted for this may lead to underestimate (or even overestimate) of actual values [20]. The total error in calorimetric studies depends basically on two parts;
Δηa/ɳa = Δqw/qw + Δqn/qn(5)
The measuring error in the gross arc power input Δqn/qn
depends on how arc current and voltage is measured and how the gross arc power is calculated. Electrical measuring systems have accuracy better than 1% and thus the error in Δqn/qn should be
less than that. Other claims error values for instance in the order of 3% [6] or even higher like for instance 5% [18].Accuracy and errors will be discussed later on.
The error in Δqw/qw can on the other hand be much larger.
There are both systematic and random errors which will inluence the result. The calorimeter (design and usefulness) itself may have a large inluence. Calibrations of a Seebeck Envelope Calorimeter (SEC) for instances indicates an accuracy better than 1% [13, 14, 16], whereas random errors for an insulated box and a nitrogen calorimeter was reported to be 1.5% and 8% respectively [20]. Further comments to the SEC system will be given below. The uncertainty when estimating
the enthalpy increase in a workpiece was on the other hand
reported to be about 3 % in one case [18]. Thus the total error Δηa/ɳa could be in the order of 10 % or larger as is also discussed
later. The reproducibility in repeated measurements in one case was reported to be 10 % [6].
Larger errors can, however, be introduced due to uncontrolled heat losses prior to the start of the calorimetric measurements [20, 26]. Heat losses will for instance occur during welding (from plate surface to surroundings and/or to a clamping jig used during the welding operation), when unclamping the sample, during the transfer of the sample to the calorimeter etc.
The inluence of welding time and delay time on determined ηa values was for instance recently investigated for GMAW [20].
Heat losses during welding and handling operations can lower determined arc eficiencies signiicantly (in the worst case up to 30% absolute). This has to be controlled and compensated for when determining ηa. One way is to do this (if the measuring
population is large enough) is to extrapolate down to zero welding and delay time [20].
As mentioned above, analytical and numerical methods (modeling and simulation) have also been used in estimating arc eficiency (ɳa). It can be done in various ways, for instance by
synchronizing measured maximum temperatures in the HAZ, or to correlate depth of penetration or fused area with values predicted from moving heat source solutions in the search for optimum ηa value. The method can be classiied as
semi-empirical. Different approaches have been used like analytical solutions with a point/line (Rosenthal/Rykalin solutions) heat source or distributed heat sources (Rykalin, Pavelic or Goldak), and numerical methods with inite difference or inite element [8, 13, 15, 17, 25, 27, 28]. The accuracy of matched ηa values
depends among other things to a high degree on heat source modeling, material data used in the computations and their temperature dependence (density, thermal conductivity, heat capacity, phase change, melting temperature, emissivity etc.), and the accuracy in measuring the matching parameter (depth, width or size fused area). It has been dificult to ind reports
that explicitly evaluate the ηa accuracy in modeling-simulation
attempts, and/or the sensitivity in the analytical/numerical model to variations in different measured input parameters.
3. Earlier studies of GTAW arc eficiency
In an early work, based on Russian calorimetric experiments, arc eficiency (ɳa) values between 0.50 – 0.70 were reported by
Rykalin [3] for a carbon arc, which have a similarity with a TIG arc. It is also mentioned that the arc eficiency decreases with increased arc length (increased arc voltage) due to increased heat losses [3].Results supporting these ηa values were published in
early works during the 50-ties and 60-ties [5, 6]. This will be commented more in detail in the following.
Schellhaase’s [2] interesting monograph from 1985 covers several processes and quotes several references (mainly German). For GTAW and mild steel reported values varies between 0.45 to 0.75. There is no information if this is DC- or AC-welding. It is mentioned however that increasing arc power decreases the arc eficiency. Several heat loss mechanisms are also mentioned. With increasing arc energy losses through radiation, heat conduction and convection will increase and thereby reducing the effective arc eficiency.
Apps& Milner [5] studied heat low in TIG-welding without any iller material for aluminum, lead, nickel, copper and Armco iron. The majority of heat determined was due to the electron current in the arc which enters the small area of the anode spot. Another smaller heating part stems from the heat received from the positive arc column by either radiation or gaseous conduction. Heat input measurements were made as calorimetric tests. A normal commercial welding torch was used and the metal specimen was placed above a copper calorimeter. After 10 – 30 s welding time the arc was extinguished and the specimen dropped into the calorimeter. Corrections for heat losses from the calorimeter were made. It is mentioned that variations in arc time had no effect on the results, contrary to other results [20]. Direct current (DCEN) was used in all cases except for aluminum.
Measurement of current and voltage presented no dificulties with DC arcs, but with AC there were a question of current and voltage waveforms [5]. Current was almost sinusoidal and the RMS value was recorded with “normal” AC instruments. Furthermore the arc voltage was in phase and exhibited an almost square waveform (measured with an oscilloscope), the maximum value were recorded by an AC instrument. Consumed power was calculated by taking 90% of the product of the instrument readings. As will be seen later substantial errors can be introduced when using RMS values if current and voltage are luctuating a lot for instance in pulsed GMAW [19]. Arc eficiency values based on RMS values can be substantially lower than “true” values calculated from average instantaneous power. Anyway the values determined by Apps & Milner [5] were;
• Armco iron (DCEN) 0.60 – 0.78
• Nickel (DCEN) 0.44 – 0.56
• Aluminum (AC) 0.31 – 0.44
On arc eficiency in Gas Tungsten Arc Welding
in arcs between a non-consumable (ixed) tungsten electrode and a water-cooled copper anode in different shielding gases (argon, nitrogen, helium and hydrogen). The main part of the investigation was directed to the examination of the heat low to
the anode, which comprised electron heating together with heat
transfer from the plasma jet. They found that the major part of the energy expended in the arc was found to go to the anode; the remainder was divided between cathode heating and heat carried away by the gas leaving the arc region at high temperatures (1000 – 6000oK).
The experimental set up and the measuring procedure is described in detail [6]. The authors mention that precautions were indeed necessary in order to obtain reproducible results. When the selected measuring technique was adopted, the measured heat and power consumed usually agreed within 3% or less. However, when measurements were made from one occasion to another the reproducibility was within 10%. Quoted energy values are mean values from several experiments (usually three, but occasionally more).
The heat entering the anode accounted for 80 – 90% of the total energy dissipated in the arc and was about the same for the different shielding gases [6]. But it decreased with increasing arc length (from 90% down to 80% at 10 mm arc length). With nitrogen as shielding gas the arc eficiency was some 5 – 10 % higher (depending on arc length) than with argon. The heat given to the cathode was found to be about the same for both gases and amounted to only a few percent of the total energy.
In a classical work by Christensen et al.[7], ηa was determined
for several processes like SAW, MMA, GMAW and GTWA. They used a calorimetric procedure consisting of depositing a weld bead on a plate cooled by a rapid stream of running water, the temperature rise of which was measured by means of a thermocouple. Details of their measuring technique were reported elsewhere and the test conditions are not known. The following values were, however, reported for GTAW;
• Mild steel (DCEN) 0.36 – 0.46
• Aluminum (AC) 0.21 – 0.43
These values are much lower than TIG arc eficiencies reported by contemporary and later studies. It is interesting, however, to note their observation that ηa values reported by
Apps & Milner [5] were considerably higher than their own values for mild steel. The reason for the deviation was however not explored further.
An early modeling and simulation attempt was made by Niels & Jackson [8]. Welding was made on a 25 mm thick steel base plate (mild steel, HY80- and HY130-steel) and they measured the temperature response at a certain location from the GTAW bead-on-plate weld fusion line. Effective (net) power input Pe was calculated with the Rosenthal equation for the 3D
case (point source, semi-ininite body, constant thermal material properties, no heat losses to the surroundings etc.), together with maximum recorded temperatures Tmax at certain locations from
the weld line and recorded process parameters (travel speed v
and total arc energy Pt). Arc eficiency was then given by ηa = Pe/ Pt. They calculated arc eficiency values in the range 0.35 – 0.65.
They report that ηa was lowered from 0.65 down to 0.35 when
the arc current was increased from 125 A to 225 A, contrary to other results [16, 18, 28].Changes in electrode tip vertex angle (from 30o to 120o) did not inluence calculated arc eficiency
values.
Interesting calorimetric experiments were made by Collings et al. [23] with high speed GTAW DCEN (travel speeds between 0.1 to 1 m/s and arc currents between 100 to 650 A). Their apparatus included a ixed TIG torch and a rotating anode. The magnitude of the total heat transferred to the workpiece could be determined and the arc eficiency calculated. Melting eficiency under various conditions was also determined (maximum value reported was about 0.5). A wide range of welding conditions were studied (current, travel speed, tip angle, electrode distance
and additions of H2 to the shielding gas Ar). Workpieces was
either mild steel or stainless steel. It was shown that the arc eficiency for these high speed TIG arcs were in the range 0.77 – 0.90, these values are similar to the ηa values for TIG
arcs moving at speeds at an order of magnitude less. Increased electrode distance (arc gap) lowered ηa. Moreover, the heat input
to the workpiece per unit time was virtually proportional to arc current and insensitive to large changes in electrode tip angel and travel speeds, within the observed experimental scatter of ±10% [23]. Additions of 10 – 20% H2 to the shielding gas
increased the arc eficiency.
Ghent et al.[9] conducted calorimetric experiments with a ixed and a moving TIG-torch DCEN. They report that the arc eficiency decreases with increasing arc power. Their values can be estimated from their report to be between 0.83 to 0.58 (arc power between 1.2 to 3.0 kW), i.e., for stationary or moving weld pools. It is mentioned that the eficiency can be lowered either by increasing arc gap or by increasing the current. Net power input will depend on the heat losses from the anode [9]. There is no report on measurement errors except for an information that total power collected varied between 0.97 to 1.06 of power generated. Smartt et al.[11] has shown that the GTAW arc eficiency decreases with increasing arc voltage. He reports an arc eficiency value of 0.75 for a 304 stainless steels.
Tsai & Eagar [12] made an experimental study of heat and current luxes, and their distribution, in GTAW with a split water cooled copper anode (ixed torch). Heat and current distribution follows each other closely, which is plausible since a major part of the heat is carried by electrons. Measurements were also made on arc eficiency and they determined values greater than 0.80 . In fact ηa drops slightly from 0.90 at 100 A down to 0.82
at 280 A.
Christensen et al [7] and Niles &Jackson [8], but supported by several calorimetric measurements and later modeling and simulation calculations, and by the early measurements by Apps & Milner [5] and Wilkinson et al [6].
An interesting part in the study of Geidt et al [13] is that they also compared arc eficiencies determined from temperature ields and fusion zone measurements with the calorimetric values. As mentioned earlier, values thus determined are of course adjusted values to obtain agreement between analytical and/or numerical solutions and experimental measurements (in their case it was the penetration depth). The average value from calculations using a moving-point source solution (the 3D Rosenthal equation) gave an average value of 0.57 ± 0.06, which is about 30% lower than the reported calorimetric average value. They conclude that for the overall prediction of weld characteristics, for instance when calculating ηa,
more correct models must be used; incorporating for example distributed heating, heat of fusion, thermal property variation and convection etc. When using more advanced models (like FEM models) estimated arc eficiencies values approach those (0.75 – 0.80) obtained from calorimetric measurements [13].
4. Reported GTAW arc eficiency values from 1990 and onwards
Fuerschbach & Knorovsky [14] made extensive calorimetric studies of GTAW and PAW (DCEN), with similar calorimetric equipment (SEC) as Geidt, et. al. [13] used in their study. Edge welds were chosen (industrial application was in fact micro-welded components). The experimental set up for GTAW (DCEN, continuous and pulsed current) was extensive. Two different base materials were included (304L SS and Nickel 200) and two test plates (1.3 x 25 x 127 mm each), were joined together with an edge weld. Arc output energy was determined by multiplying the voltage and current waveform together, and integrating the resulting power waveform for the weld period using the measuring oscilloscope’s internal software. Travel speed varied between 4.2 – 25.4 mm/s, current between 29 – 205 A, pulse duty cycle between 0.2 – 1.0 and pulse rate between 8.3 – 27.8 Hz, with differences whether there were continuous or pulsed current experiments.
Anyway, their results indicates that arc eficiency were relatively insensitive to travel speed. It was mostly around 0.8 – 0.85 for travel speeds between 10 – 25 mm/s. But decreased slightly from 0.8 to 0.7 when travel speed was reduced from 10 to 5 mm/s. Since the major part of the energy transfer is by electrons (ca 90%), the current is of course the dominate parameter in the arc energy balance, and thus convective and radiative losses will be of secondary importance. The arc eficiency was also relatively insensitive to duty cycle in the pulsed current experiments and ɳa values were between 0.80 –
0.85, with a slight reduction down to about 0.75 for the lowest duty cycle (ca 0.28). Another interesting result was the lack of arc eficiency dependence on anode material (304L or Ni200). It might indicate that the electron work functions in a GTAW arc for the two materials are similar, since the anode work function is believed to strongly affect the GTAW arc eficiency [14].
Dutta et al. [15] determined gas tungsten arc eficiencies through a combined experimental analytical (computational) technique. Measurements of width and depth of weld pool were obtained from sections using optical microscopy. Based on these measurements a 3D FEM model was used to calculate the arc eficiency, which accounted for weld pool convection and variations in speciic heat. Welding was done in a groove (depth x width: 1.6 x 1.6 mm) in order to simulate butt welding, but also as bead-on-plate welds as a comparison. In all test a naval HY-80 steel (0.16% C) was used. Welding speed varied between 1.27 – 2.12 mm/s, current between 237 – 322 A and arc voltage between 10.7 – 13.8 V. Their calculations revealed a mean value of about 72% for the arc eficiency. Reported variations (between 0.62 – 0.85) were claimed to be due to variations in arc current, voltage, welding speed and inherent unsteadiness of the welding process itself. Dutta et al. [15] also mentioned that a higher power input results in lower arc eficiencies and that the slower the speed the lower the eficiency. They also noted no signiicant difference in arc eficiency between grooved and ungrooved plates, at comparable welding speed and power input.
Another example of the use of the SEC equipment is the study of DuPont & Marder [16]. They made an extensive experimental study on arc eficiencies for several processes like PAW, GTAW, GMAW and SAW. GTA welding was done on a 100 x 100 mm square plate, 25 mm thick, steel plate (A 36 carbon steel). Current varied between 250 – 350 A, voltage between 15 – 16 V, whereas travel speed was kept constant at 7 mm/s. Welding time was kept below 10 s and transfer time to the calorimeter below 3 s, in order to minimize heat losses before the substrate was in the calorimeter. They also made a calculation of heat losses prior to measurements (welding + transfer), and concluded that they were less than 1 % of total arc power and could therefore be neglected. The arc eficiency did not vary signiicantly over the current range investigated and a value of ηa = 0.67 ± 0.05 (8%
variance) was determined for GTAW DCEN.
The thermal response of spheroidal graphite cast iron (substrate) was studied in calorimetric experiments by Orlowicz & Trytek [24] in GTAW DCEN. Travel speeds ranged from 0.2 to 0.8 m/min and arc currents from 100 to 300 A. The inluence of different electrode distances (arc gap from 3 to 6 mm) on ηa
was also studied. They determined arc eficiency values between 0.39 – 0.77 and concluded that ηa was strongly dependent on
travel speed (decreased with increased travel speed), contrary to what was reported earlier. At low travel speeds (< 0.4 m/min and currents between 100 to 300 A) they report ηa values in the range
0.66 – 0.77, i.e. similar values as reported earlier. The range 0.66 – 0.77 is the more plausible arc eficiency range. Increased arc gap reduced the arc eficiency [24].
On arc efficiency in Gas Tungsten Arc Welding
eficiency was calculated to 0.72, in line with what was reported earlier.
When it comes to calorimetric measurements Malin & Sciammarella [26] makes some interesting statements about measurement errors when using the SEC equipment, and speciic drawbacks when applied in welding. They point out for instance that the SEC is not a turnkey device intended for welding. In fact it was designed for biomedical research and needs additional equipment (like a chiller, a data-acquisition unit, processing hardware etc) and modiications to function properly in welding experiments. It also requires about 6 h to make one measurement. Anyway, the errors introduced when applying the SEC was estimated in the following manner. The SEC does not account for heat losses during welding and transfer of the specimen into the calorimeter. These losses depend on a number of factors (size of specimen and its physical properties, welding and transfer time etc.). The heat thus neglected could cause a measurement error in the order up of 2% [26]. Moreover, the SEC does not differentiate between transient and quasi-stationary energies, because the specimen has a rather short length (max 90 mm), and therefore the transient zones (start and stop areas) will inluence the measurements. An additional source of error up to 7% will then be introduced since transient and stationary (nominal) energies will be averaged [26]. Thus the total measuring error of ηa could be in the order of 9%.
Recently Gonzalez et al.[27] studied experimentally the heat lux transferred to a ixed anode (stationary water cooled copper anode). Although their main object was to determine transferred heat lux (for instance temperatures and temperature proiles), some interesting data can be found in their paper when it comes to power transmitted to the cooling water and total (input) power, and the scatter in these measurements. The average arc eficiency for four different input powers (from 1.1 to 1.6 kW) was 0.70, range between 0.63 to 0.77. The scatter in their power input measurements (estimated) was <± 2%, whereas the scatter in the power transmitted to the cooling water (estimated) was ± 10%.
Goncalves et al. [17] compared two modeling techniques when studying thermal phenomena (heat lux) during GTAW. The irst thermal model (A) considers quasi-stationary heat conduction (basically Rosenthal) in the interior of a plate, whereas the second one (B) uses a general transient heat equation for heat diffusion with phase change. In both cases the heat lux generated from the welding process could be estimated and temperature curves/proiles calculated considering phase change, varying thermal properties and heat losses to the surroundings due to convection and radiation. Calculated temperature proiles (using the two models) were compared with experimental ones obtained in TIG welding an AISI 304 steel plate with dimensions 200 x 50 x 4 mm, current 78 A, voltage 15 V and a constant travel speed of 8.33 mm/s (P = 1.178 kW). Based on heat low estimations the arc eficiency was calculated with model A to be 0.67 ± 0.09 (varied between 0.56 – 0.77 at four different thermocouple locations). The accuracy of model B was tested by calculating the weld pool radius and with measured values (golden sections) of the radius. The relative error was 4 ± 2.0 % (four locations) with maximum error < 7%.
Model B was used in estimating; heat of fusion, heat
transfer in the plate and heat losses due to convection/radiation. Goncalves et al. [14] could then estimate arc eficiency and thermal eficiency dynamically during the whole welding sequence through synchronization with the thermocouples. The thermal (fusion) eficiency was constant during the welding operation and had a value of about 0.16 in their speciic case. The “instantaneous” arc eficiency was about 0.8 (during 2 sec arc start), but fell slightly in an asymptotic manner from about 0.74 (after completion of arc start) down to about 0.70 at the end of the welding operation, i.e. when more heat is consumed during heat transfer in the plate and heat losses due to convection/ radiation.
Several different process situations were studied by Cantin &Francis[18]. The inluence of polarity, alternating current balance, shielding gas composition (Ar, Ar+75%He, He), arc length and welding current on arc power and arc eficiency were investigated. They used a calorimetric approach which comprised experiments in which GTAW weld runs were made on a cubical (110 x 120 x 120 mm) insulated block of electrical conductor grade aluminum. The temperature rise in the block was measured with several thermocouples attached to it and the energy absorbed in the sample was then calculated. Arc power was estimated by numerical integration of u(t)i(t) during welding
time T. As one of the few, Cantin & Francis [18] also discussed
the signiicance of different errors in their measurements and came to the assumption that the uncertainty when estimating arc power would be about 5%, whereas the uncertainty when estimating the enthalpy in the workpiece would be about 3%. Total error in arc eficiency measurements was then about 8%.
The arc eficiencies determined in DCEN experiments
fell within the range 0.76 – 0.89, i.e. in the same range as the
calorimetric experiments mentioned earlier for different materials
and much higher than the values reported by Christensen et al. [7]. The major part of the arc power is transferred to the workpiece and relative high arc eficiencies were obtained. Their results also showed that the type of shielding gas had a signiicant inluence on the arc eficiency in DCEN tests. Higher ηa values were recorded with Ar+75%He and He (average 0.87),
than with pure Argon(average 0.79). This was explained by differences in heat losses. With Ar as shielding gas heat losses through radiation will be dominant, whereas with Helium, conduction and convection losses will dominate. Minimum in the sum of radioactive conductive and convective losses occurs with a shielding gas with Ar+75%He [18]. Determined ηa-data
suggested also that changes in welding current (100 A – 200 A) didn’t have any signiicant inluence.
As expected lower arc eficiencies were recorded with
DCEP (direct current electrode positive) since the electrons condense on the electrode, and a large amount of the energy (roughly 25%) is transferred to the electrode. On average about 25% less energy is transferred then to the workpiece in this case, compared to the previous one. Measured arc eficiencies were in the range 0.52 – 0.63, but the cathode (substrate) was however the major recipient of the arc energy since ηa were > 0.50. Also
in this case higher ηa values were recorded (average 0.62) with
also found that an increase in arc length (from 2 to 4 mm) gave a slight decrease in arc eficiency.
Arc eficiencies with AC power were intermediate of those
for DCEN and DCEP and ranged between 0.65 – 0.83 and were dependent on the EN (electrode negative) fraction (0.50 – 0.75). For Argon with EN 50% the arc eficiency was 0.71 ± 0.03. An interesting approach in their study is the calculation of arc eficiencies at AC power by using weighted average of the arc eficiencies obtained at DCEN and DCEP polarity, under otherwise identical welding conditions. Estimated and measured arc eficiencies compared reasonably well.
Another recent example of a modeling and simulation approach is the one done by Bag & De [27]. They mention the same uncertain input parameters as Mishra & DebRoy [25], i.e., the data which are necessary for adequate modeling of heat transfer and luid calculations in GTAW. But Bag & De [27] synchronized their calculations with another substrate (stainless 304), which was TIG welded DCEN (arc power between 1.0 to 2.0 kW and travel speed between 5.0 to 8.8 mm/s). The size of the test plates is not mentioned. Calculations of the Uncertain Model Input Parameters gave an optimum arc eficiency value of 0.65, which is somewhat below the values reported earlier.
A creative modeling approach was made by Arul & Sellamuthu [28] recently, with the goal to overcome the dificulties in solving complex heat and luid low models when predicting temperature distributions, cooling rates and weld pool geometry. In their case the arc parameter, as the measure of the arc heat distribution, required for the simulation were experimentally determined from arc images. As a substrate they used 1005 carbon steel with the dimensions 150x50x25 mm, current values were between 100 to 200 A and travel speeds between 0 to 10 mm/s. The arc images were recorded with a CCD camera. As synchronizing parameter they selected the weld pool width. They determined an average arc eficiency value of 0.74. The scatter in their data was estimated to be in the order ± 0.05, when the current and travel speed varied. However, they conclude that the arc eficiency was independent of both current and travel speed. The heat distribution parameter was a function of current and independent of travel speed [28].
5. Discussion
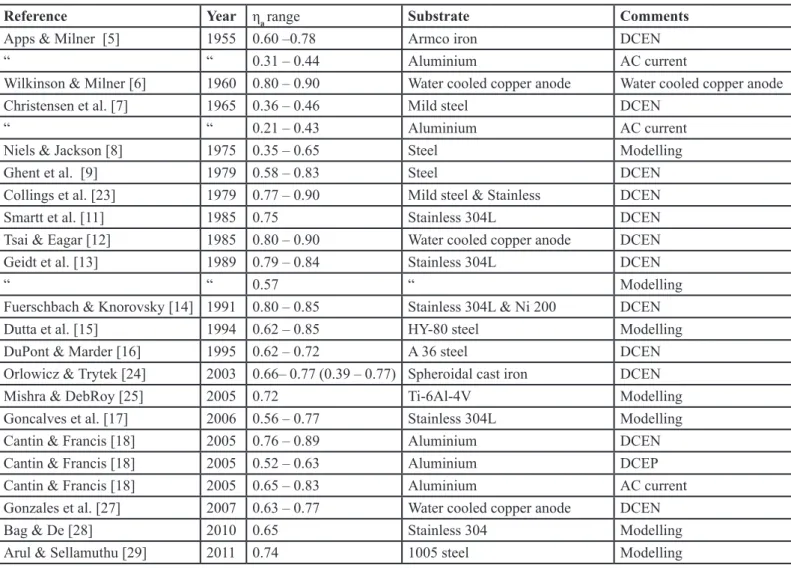
Reviewed references show a wide variation in determined arc eficiency values, regardless if they were determined through calorimetric experiments or achieved by modeling and simulation studies. A summary of referred ηa values and their
range can be found in Table 1.
An interesting observation is that many references have not made a thorough estimate of experimental errors in
their calorimetric experiments and/or in their modeling and
simulation studies. Measurement system errors, for instance, can be classiied into two main categories: accuracy and precision.
Accuracy is the difference between measured and actual value. This is of course dificult to estimate in the present case since the actual value is in fact unknown. Precision, on the other hand,
is the variation when measurements are repeated with the same equipment. Furthermore precision has two parts, repeatability
which is the variation due to the measuring equipment (the device) and reproducibility which is the variation due to the measuring system, i.e., when different “operators” measure the same object using the same equipment (device) or when measurements are made in different laboratories with the same equipment. Good repeatability means that random errors have a small inluence on the result, and good reproducibility indicates that both random and systematic errors are small.
Only in a limited number of cases were the experimental errors estimated and/or discussed, moreover no clear distinction was made between accuracy and precision. In some cases
precision was mentioned and it was mainly made towards
repeatability (but mixed with reproducibility). Anyway, there are some reports about errors encountered in the calorimetric studies mentioned earlier. Considering these reports, the error in power input measurements should be less than± 2%. Whereas, several reports indicates that the error in estimating the transmitted power (or heat) to a given substrate is in the order of±10%. Thus the total error could be about ± 12%, which is the linearized error estimate according to eq. (5). This magnitude in experimental error in ∆ɳa/ɳa can to a certain degree explain the
deviations between arc eficiency values given in Table 1. A difference between two average ɳa values, less than 12% is
not signiicant on a conidence level of 90% (estimated from the average value given below). If a 10% difference between two measured ɳa values should be signiicant (95% conidence level),
it would mean that the total error in calorimetric experiments have to <±5%. It is an open question if this reproducibility can be achieved with the systems used today.
Modeling and simulation experiments are also inluenced by different types of errors. They can be split between errors inherent to the used model and experimental errors. The approach depends for example on several fundamental assumptions about different material parameters (e.g. speciic heat, density, conductivity, viscosity etc.) and their temperature dependence, which can be more or less well known. Furthermore, in this approach there are also measurement errors, for instance when determining the synchronizing parameter (e.g. depth of penetration, width of weld bead, weld metal area or peak temperature etc.). No information was found about experimental errors in the modeling and simulation studies.
From the data given in Table 1 a possible average value and standard deviation can be estimated for GTAW DCEN. Considering the range in the individual cases, median values and individual spans are shown in Table 2. Using values in Table 2, relative and cumulative frequencies can be calculated. Assuming that all values can be described by a normal distribution, mean value and standard distribution can be estimated. Besides this assumption, it is also assumed that the substrate have no inluence on the arc eficiency. This has a support in the reviewed literature mentioned earlier.
Other factors such as arc gap and power can also inluence the ɳa value, but presently it is dificult to consider these
parameters and they will be commented later.
On arc eficiency in Gas Tungsten Arc Welding
1955 and 2011 and their range. In some cases the range was estimated from published values. The more plausible data range in [24] was selected.
Reference Year ηa range Substrate Comments
Apps & Milner [5] 1955 0.60 –0.78 Armco iron DCEN
“ “ 0.31 – 0.44 Aluminium AC current
Wilkinson & Milner [6] 1960 0.80 – 0.90 Water cooled copper anode Water cooled copper anode
Christensen et al.[7] 1965 0.36 – 0.46 Mild steel DCEN
“ “ 0.21 – 0.43 Aluminium AC current
Niels & Jackson [8] 1975 0.35 – 0.65 Steel Modelling
Ghent et al. [9] 1979 0.58 – 0.83 Steel DCEN
Collings et al. [23] 1979 0.77 – 0.90 Mild steel & Stainless DCEN
Smartt et al. [11] 1985 0.75 Stainless 304L DCEN
Tsai & Eagar [12] 1985 0.80 – 0.90 Water cooled copper anode DCEN
Geidt et al. [13] 1989 0.79 – 0.84 Stainless 304L DCEN
“ “ 0.57 “ Modelling
Fuerschbach & Knorovsky [14] 1991 0.80 – 0.85 Stainless 304L & Ni 200 DCEN
Dutta et al. [15] 1994 0.62 – 0.85 HY-80 steel Modelling
DuPont & Marder [16] 1995 0.62 – 0.72 A 36 steel DCEN
Orlowicz & Trytek [24] 2003 0.66– 0.77 (0.39 – 0.77) Spheroidal cast iron DCEN
Mishra & DebRoy [25] 2005 0.72 Ti-6Al-4V Modelling
Goncalves et al. [17] 2006 0.56 – 0.77 Stainless 304L Modelling
Cantin & Francis [18] 2005 0.76 – 0.89 Aluminium DCEN
Cantin & Francis [18] 2005 0.52 – 0.63 Aluminium DCEP
Cantin & Francis [18] 2005 0.65 – 0.83 Aluminium AC current
Gonzales et al. [27] 2007 0.63 – 0.77 Water cooled copper anode DCEN
Bag & De [28] 2010 0.65 Stainless 304 Modelling
Arul & Sellamuthu [29] 2011 0.74 1005 steel Modelling
Table 2. Arc eficiency range, median values and span for GTAW DCEN according to Table1.
References Range Substrate Median Span
[5] 0.60 – 0.78 Armco iron 0.69 0.18
[6] 0.80 – 0.90 Copper anode 0.85 0.10
[7] 0.36 – 0.46 Mild steel 0.41 0.10
[9] 0.58 – 0.83 Steel 0.71 0.25
[23] 0.77 – 0.90 Mild steel & Stainless 0.84 0.13
[12] 0.80 – 0.90 Copper anode 0.85 0.10
[13] 0.79 – 0.84 Stainless 304L 0.82 0.05
[14] 0.80 – 0.85 Stainless & Ni 200 0.83 0.05
[16] 0.62 – 0.72 A 36 steel 0.67 0.10
[24] 0.66 – 0.77(0.39 – 0.77) Spheroidal cast iron 0.72 0.11
[18] 0.76 – 0.89 Aluminum 0.83 0.13
A further question which arises is whether the values given by [7] are outliners or not? With a linear regression it to the cumulative frequency data the regression coeficient was 0.90 with all values present, and when values according to [7] was omitted the coeficient rose to 0.96. Values in Table 2 have probably a normal distribution. Based on the whole population it can be evaluated if the upper value of 0.46 according to [7] belongs to the population or not. With Student’s t-test it can be shown that this upper value it is not a part of the population (on the 0.01 level), which means that the values according to [7] are most likely outliners. When the data according to [7] were omitted the average ɳa value is 0.77 ± 0.07 (10% variance). The
95% probability range is fairly large (0.63 – 0.91) and it covers 86% of all observed values. It indicates that the GTAW process is an eficient welding method.
Figure 2 and 3 shows median values as functions of publication year, and it is interesting to note the gradual increase in calculated ɳa values in Fig 3 from modeling and simulation
studies of the years, i.e. when the model accuracy is enhanced. The gap between the two approaches is reduced over the years.
The majority of studies on arc eficiency so far were concerned with DCEN, although DCEP and AC current (for instance pulsed current with EN polarity) are also of industrial importance. Anyway, published data in this area indicates that ɳa
is lower in these cases, but since there are only a limited number of published studies it is dificult to point out any speciic range. Table 1 provides however some guideline.
Another interesting observation is the lack of factorial experiments or any design of experiment approach (DOE). Main process parameters of interest are for instance; travel speed, arc current and arc gap. A simple 23 factorial test would sufice to show both the inluence and the connection between these variables. There is however several articles which indicate that the arc eficiency is reduced when the arc length is increased [3, 9, 23]. But there are conlicting results with respect to the inluence of arc current and travel speed. There are some reports that there is no inluence of arc current or travel speed [14, 16, 18, 23, 28], whereas some claim that there is [2, 8, 9, 11, 12, 15, 24].
6. Conclusions
Published arc eficiency values for GTAW show a wide range. Values between 0.36 to 0.90 have been found in the reviewed literature for GTAW DCEN. The majority of published studies were made on DCEN and only a few studies covered DCEP and AC current.
In many cases measurement errors are not reported for the applied methods. This was evident both in calorimetric experiments as well as in modeling and simulation studies. Speciic information about the reproducibility in calorimetric studies (considering both random and systematic errors) was scarce. When considering several reports, the total error when determining arc eficiency with calorimetric methods was estimated to be about ±12% for a “good practice” procedure. But there can be larger errors.
If a 10% difference between two measured ɳa values should
be signiicant (95% conidence level), it would mean that the total error in calorimetric experiments have to <±5%. It is an open question if this reproducibility can be achieved with the systems used today.
An estimate of the average arc eficiency value for GTAW DCEN indicates that it should be about 0.77± 0.07 (10% variance), regardless of substrate (mild steel, stainless steel, Ni alloys, cast iron). One outliner value was found in the literature and it was omitted from this estimate. The 95% probability range of observed arc eficiency values is fairly large (0.63 – 0.91). It covers 86% of the observed min-max values. It indicates anyway that the GTAW process with DCEN is an eficient welding method.
The arc eficiency is reduced when the arc length is increased. On the other hand there are conlicting results in the literature as to the inluence of arc current and travel speed.
7. Acknowledgments
Financial support for the study given by the KK-foundation
Fig 2. Published arc eficiency median values for GTAW DCEN obtained from calorimetric experiments as function of
publication year. See also Table 1 and 2.
Fig 3. Published arc eficiency median values for GTAW DCEN obtained from modeling and simulation studies as
On arc eficiency in Gas Tungsten Arc Welding
is gratefully acknowledged. I am also grateful to constructive comments on the manuscript made by my colleagues Dr. Isabelle Choquet and Dr. Fredrik Sikström at University West.
8. References
1. LANCASTER, J. F. (ed). The Physics of Welding. Pergamon
Press, 1984.
2. SCHELLHASE, M., Der Schweisslichtbogen ein
technologisches Werkzeug. VEB Verlag Technick (DVS), Berlin, 1985.
3. RYKALIN, Berechnung Der Wärmevorgänge Beim
Schweissen. VEB Verlag Technik, Berlin, 1957.
4. RADAj D., Heat Effects of Welding. Springer-Verlag, 1992.
5. APPS, R.L. & MILNER, D.R., Heat low in argon-arc
welding. British Welding Journal, 1955, 2 (10), pp. 475-485.
6. WILKINSON, J.B. & MILNEr, D.R., Heat transfer from
arcs. British Welding Journal, 1960, 7 (2), pp. 115-128,
7. CHRISTENSEN, N., de DAVIEs, L. V., GJERMUNDSEN,
D., Distribution of Temperatures in Arc Welding. British Welding Journal, 1965, 12 (12), pp. 54 – 75.
8. NILES, R-W. & JACKSON, C.E., Weld thermal eficiency
of the GTAW process. Welding Journal 1975, 54 (1), pp. 26s – 32s.
9. Ghent, H.W., ROBERTS, D.W., HERMANCE, C.E.,
KERR, H.W. & STRONG, A.B., Arc eficiencies in TIG welds. Conf. Proc., Arc physics and weld pool behavior. The Welding Institute 1979.
10. EAGAR, T. W. & TSAI, N. S., Temperature ields produced
by traveling distributed heat sources. Welding Journal Research Supplement, December 1983, pp. 346-355.
11. SMARTT, H.B., STEWART, J.A. & EINERSON, C.J., Heat
transfer in gas tungsten arc welding. ASM Metals/Materials Technology Series, No. 8511-011, 1 – 14, ASM Int´l, Metals Park, Ohio.
12. TSAI, N. S. & EAGER, T. W., Distribution of the Heat
and Current Fluxes in Gas Tungsten Arcs. Metallurgical Transactions, Vol 16B, December 1985, pp 841 – 846.
13. GIEDT, W. H., TALLERICO, L. N. &FUERSCHBACH, P.
W., GTA Welding Eficiency: Calorimetric and Temperature Field Measurements. Welding Journal Research Supplement, January 1989, pp. 28s – 32s.
14. FUERSCHBACH, P. W. &KNOROVSKY, G. A., A Study
of Melting Eficiency in Plasma Arc and Gas Tungsten Arc Welding. Welding Journal, Research Supplement ,Nov 1991, 287s – 297s.
15. DUTTA, P., JOSHI, Y. &FRANCHE, C., Determination of
gas tungsten arc welding eficiencies. Experimental Thermal and Fluid Science, Vol 1, Issue 1, July 1994, pp. 80-89.
16. DUPONT, J.N. &MARDER, A.R., Thermal Eficiency
of Arc Welding Processes, Welding Journal, Research Supplement, Dec 1995, 406s – 416s.
17. GONCALVES, C. V., VILARINHO, L. O., SCOTTI, A.
&GUIMARAES, G., Estimation of heat source and thermal eficiency in GTAW process by using inverse techniques. Journal of Materials Processing Technology 172 (2006), pp. 42 – 51.
18. CANTIN, G.M.D. & FRANCIS, J.A., Arc power and
eficiency in gas tungsten arc welding of aluminium. Science and Technology of Welding and Joining, 2005, 10, 200-210.
19. JOSEPH, A., HARWIG, D., FARSON, D.F.
&RICHARDSON, R., Measurement and calculation of arc power and heat transfer eficiency in pulsed gas metal arc welding. Science and Technology of Welding and Joining, 2003, 8, 400-406.
20. N. PÉPE, S. EGERLAND, P.A. COLEGROVE, D.YAPP,
A. LEONHARTSBERGER, A. SCOTTI, Measuring the process eficiency of controlled gas metal arc welding processes, Science and Technology of Welding& Joining, Volume 16, Number 5, July 2011 , Pages 412-417.
21. HIRAOKA, K., SAKUMA, N. & ZIJP, J., Energy balance
in argon-helium mixed gas tungsten (TIG) arcs. Welding International, 1998 12 (5), pp. 372 – 379.
22. WELLS, A.A., Heat low in welding. Welding Journal, May
1952, pp. 263s – 267s.
23. COLLINGS, N., WONG, K.Y. & GUILE, A.E., Eficiency
of tungsten-inert-gas arcs in very-high-speed welding. Proc. IEE, Vol. 126, No. 3, March 1979, pp. 276 – 280.
24. ORLOWICZ, A.W. & TRYTEK, A., Susceptibility of Iron
Castings to Heat Absorption from an Electric Arc and to Hardened-Layer Shaping. Metall. & Material Trans. A, Vol 34A, Dec 2003, pp. 2973 – 2984.
25. MISHRA, S. & DEBROY, T., A heat-transfer and
luid-low-based model to obtain a speciic weld geometry using various combinations of welding variables. J. Appl. Phys. 98, 2005, 044902.
26. MALIN, V. & SCIAMMARELLA, F., Controlling Heat
Input by Measuring Net Power. Welding Journal, July 2006, pp. 44 – 50.
27. GONZALEZ, J.J., FRETON, P. & MASQUERE, M.,
28. BAG, S. & DE, A., Probing Reliability of Transport
Phenomena Based Heat Transfer and Fluid Flow Analysis in Autogeneous Fusion Welding Process. Metall. & Material Transactions A, Vol 41A, Sep. 2010, pp. 2337-2347.
29. ARUL, S. & SELLAMUTHU, R., Application of a