Cost-effective analysis of different
algorithms for the diagnosis of hepatitis C
virus infection
A.M.E.C. Barreto
1,2, K. Takei
1, E.C. Sabino
2, M.A.O. Bellesa
2, N.A. Salles
2,
C.C. Barreto
2, A.S. Nishiya
2and D.F. Chamone
21
Departamento de Análises Clínicas e Toxicológicas, Faculdade de Ciências Farmacêuticas,
Universidade de São Paulo, São Paulo, SP, Brasil
2
Fundação Pró-Sangue Hemocentro de São Paulo, São Paulo, SP, Brasil
Correspondence to: A.M.E.C. Barreto, Fundação Pró-Sangue Hemocentro de São Paulo, Rua Enéas de
Carvalho Aguiar, 155, 05403-900 São Paulo, SP, Brasil
Fax: +55-11-3088-8317. E-mail: [email protected]
We compared the cost-benefit of two algorithms, recently proposed by the Centers for Disease Control and Prevention, USA, with the conventional one, the most appropriate for the diagnosis of hepatitis C virus (HCV) infection in the Brazilian population. Serum samples were obtained from 517 ELISA-positive or -inconclusive blood donors who had returned to Fundação Pró-Sangue/Hemocentro de São Paulo to confirm previous results. Algorithm A was based on signal-to-cut-off (s/co) ratio of ELISA anti-HCV samples that show s/co ratio ≥95% concordance with immunoblot (IB) positivity. For algorithm B, reflex nucleic acid amplification testing by PCR was required for ELISA-positive or -inconclusive samples and IB for PCR-negative samples. For algorithm C, all positive or inconclusive ELISA samples were submitted to IB. We observed a similar rate of positive results with the three algorithms: 287, 287, and 285 for A, B, and C, respectively, and 283 were concordant with one another. Indeterminate results from algorithms A and C were elucidated by PCR (expanded algorithm) which detected two more positive samples. The estimated cost of algorithms A and B was US$21,299.39 and US$32,397.40, respectively, which were 43.5 and 14.0% more economic than C (US$37,673.79). The cost can vary according to the technique used. We conclude that both algorithms A and
B are suitable for diagnosing HCV infection in the Brazilian population. Furthermore, algorithm A is the more practical and economical one since it requires supplemental tests for only 54% of the samples. Algorithm B provides early information about the presence of viremia.
Key words: Hepatitis C virus; Immunoblot; ELISA; Polymerase chain reaction; Algorithm; Diagnosis Publication supported by FAPESP.
Received May 11, 2007. Accepted November 26, 2007
Introduction
In 1989 the Food and Drug Administration (FDA, USA) licensed the first antibody detection test for hepatitis C virus (HCV) using the c100-3 protein as antigen (1,2). Since then new generations of anti-HCV tests have been introduced for laboratory diagnosis and these have been widely used in the serological screening of infected symp-tomatic or asympsymp-tomatic individuals. Currently, second- or third-generation enzyme-linked immunosorbent assays
first-generation tests (4). However, these tests yield a high frequency of false-positive results, mainly in low-risk popu-lations such as blood donors (5-7). Therefore, supplemen-tal tests are required to ensure a reliable diagnosis.
The Centers for Disease Control and Prevention (CDC, Atlanta, GA, USA) have recommended that no individual be considered an HCV carrier until all positive results obtained by screening tests are confirmed by more specific tests, such as immunoblot (IB) (8). However, since the IB test uses the same antigens as the screening test it has limited value as a confirmatory test and is therefore re-garded as a supplemental test. Another limitation is that both screening and supplemental tests fail to detect infec-tion during the immunologic window, in which antibodies are either absent or present at very low concentrations. In this case, only molecular tests are able to detect HCV infection (9).
Thus, the laboratory diagnosis of HCV infection requires more than one test (screening and supplemental) to confirm a result, since a gold standard test is still unavailable. An-other problem is the lack of standardization in interpreting the results of supplemental tests. Furthermore, the high cost involved reduces the accessibility of these procedures in low budget laboratories. In this respect, there is a need for more available and less expensive alternative methods for the diagnosis of HCV infection.
In 2003, the CDC recommended two new algorithms (termed here A and B) as an alternative approach to the conventional algorithm C (8). Algorithm A is an option that uses signal-to-cut-off (s/co) ratios for screening-test-positive results to minimize the number of samples that require supplemental testing. For each population the proportion of IB-positive among screening-test-positive results increases with increasing s/co ratio. Algorithm B requires polymer-ase chain reaction (PCR) tests for all ELISA-positive or -inconclusive samples, as well as IB tests for samples with negative PCR results. Conventional algorithm C requires an IB test for all ELISA-positive or -inconclusive samples.
The use of these new algorithms in the US population has been helpful for simplifying HCV diagnosis and lower-ing its cost (8). In Brazil, few data concernlower-ing diagnostic performance (10) and cost (11) are available. With this in mind, we compared the diagnostic performance and the cost-benefit of the two new algorithms (A and B) with the conventional (C) one in Brazilian blood donors who showed positive or inconclusive anti-HCV results in screening tests.
Material and Methods
Samples
From September 1997 to December 1998, 197,637
blood donors at Fundação Pró-Sangue Hemocentro de São Paulo were screened with anti-HCV tests. Positive or inconclusive results were obtained for 1796 (0.91%) of the samples. A total of 692 blood donors who were positive at the time of donation returned to the Institution to repeat the screening test (ELISA). Of these, 175 (25.3%) were ELISA-negative and the 517 who remained positive (437) or inconclusive (80) formed our series and were submitted to supplemental tests for anti-HCV.
The donors were informed that their blood samples would be used for research purposes and they all signed the corresponding informed consent term. The study was approved by the Faculdade de Ciências Farmacêuticas, Universidade de São Paulo (Protocol No. 204/2003) and the Ethics Committee of Fundação Pró-Sangue Hemocen-tro de São Paulo (Protocol No. 08/2003).
Algorithms evaluated for the laboratory diagnosis of HCV infection
The basic strategy of this study was to compare the results obtained for our sample by a conventional rithm, designated here algorithm (C), with the new algo-rithms A and B recommended by the CDC.
Algorithm A requires the establishment of a specific level of s/co ratio to determine the need for reflex supple-mental testing. For this purpose, the s/co ratios of each sample tested by ELISA were stratified into 6 groups: ≥1
<2, ≥2 <3, ≥3 <4, ≥4 <5, ≥5 <6, ≥6. The s/co ratio chosen for
cut-off (cut-off ratio) corresponded to the ratio which had the highest ≥95% concordance with positive results in the IB test. The sample was positive when the result had an s/ co ratio higher than the cut-off ratio. When the ratio was lower than the cut-off ratio, reflex testing (IB) was required. The sample was considered true positive when IB was positive.
For algorithm B, reflex testing by the supplemental nucleic acid amplification test (NAT) was required for samples that were positive or inconclusive in the screening test. A sample was considered true positive when both ELISA and PCR were positive. When PCR was negative IB was carried out.
The most commonly used algorithm is C, which is based on the use of supplemental serologic reflex testing such as IB to confirm screening-test-positive results.
We evaluated the concordance of the results obtained by each algorithm. Samples with indeterminate IB results were further analyzed by PCR using an algorithm termed here as expanded form.
Number of tests required to apply each algorithm
required to implement each of the three algorithms in all samples. To predict the cost estimate of each algorithm, we multiplied the resulting figures by the cost of each test. The same estimate can be performed for each algorithm in its expanded form.
Costs were estimated as follows and do not include personal time or additional equipment: US$4.07/sample for ELISA; US$68.80/sample for IB, US$22.93/sample for in-house PCR, or US$91.74/sample for commercially avail-able PCR. These values were obtained from 7 Brazilian commercial kit suppliers and the mean value was used as a base for cost estimation and converted into US dollars.
Laboratory tests
Screening test. The HCV antibody test was performed according to manufacturer instructions using third-genera-tion ELISA kits from EMBRABIO (Hemobio® ELISA HCV
third generation, São Paulo, SP, Brazil), which detects antibodies against recombinant antigenic proteins NS3 and NS5 and against synthetic peptides corresponding to core and NS4 genes. The cut-off recommended by the manufacturer was calculated by the average absorbance of the positive controls plus the average absorbance of the negative controls, dividing the total by 5. Samples with absorbance above this cut-off were considered to be posi-tive, samples with absorbance below it were considered negative, and ±10% ranges around the cut-off were con-sidered to be inconclusive. The s/co ratio referred to ab-sorbance of the sample signal (s) divided by co. Samples with s/co ratio higher than 1.0 were considered to be reactive by this screening test.
Immunoblot. The confirmation of positive and inconclu-sive ELISA anti-HCV test results was obtained using a supplemental third-generation immunoblot kit (Immuno-blot LiaTeK® HCVIII from Organon Teknika, Boxtel,
Neth-erlands) according to manufacturer instructions. The kit contained protein fractions corresponding to the genomic regions of core 1, core 2, E2NS1, NS3, NS4 (A and B), and NS5A.
The reactive bands were read as scores, specifically 1+, 2+, 3+, and 4+, which were compared to the internal control bands of the kit. Results were interpreted according to literature references (12): positive when at least two bands were ≥1+; negative when bands were absent and indeterminate otherwise.
Samples were classified as serologically positive when both ELISA and IB tests were positive.
Molecular tests
HCV RNA detection was performed in all serum samples, which were stored at -20°C, using the nested
PCR in-house technique.
Extraction of RNA HCV and cDNA synthesis. RNA isolation: 100 µL serum was mixed with 300 µL Trizol (Gibco-BRL, Gaithersburg, MD, USA), and incubated for 5 min at room temperature. Eighty microliters chloroform (Sigma, St. Louis, MO, USA) was then added. The mixture was vigorously shaken, incubated at room temperature for 2 to 15 min, and centrifuged at 12,000 g for 15 min at 4°C. The supernatant was transferred to a tube and RNA was precipitated from the colorless aqueous phase with 40 µL 1 µg/µL dextran T500 (Amersham Pharmacia Biotech Inc., Piscataway, NJ, USA) and 200 µL isopropanol (Sigma). The mixture was agitated briefly and incubated at room temperature for 10 min, and centrifuged at 12,000 g for 10 min at 4°C. The pellet was washed in ice cold 70% ethanol and centrifuged at 7500 g for 5 min. The supernatant was removed and the RNA pellet was briefly air dried.
cDNA synthesis. The pellet was dissolved in 12 µL of a solution containing diethyl pyrocarbonate-treated water and 300 ng random primers (Pharmacia Biotech). After the denaturation step at 70°C for 10 min, cDNA was synthe-sized from RNA by the addition of a solution containing 100 U reverse transcriptase (SuperScript™II Rnase H-Reverse Transcriptase Gibco-BRL), 50 mM Tris-HCl, 75 mM KCl, 3 mM MgCl2,10 µM DTT, 5 U Rnase inhibitor (Gibco-BRL),
and 0.5 mM 2'-deoxynucleoside 5'-triphosphate mix (dNTP; Pharmacia Biotech), in a final reaction volume of 20 µL. The mixture was incubated at 42°C for 90 min and then heated at 70°C for 15 min.
Polymerase chain reaction amplification
A two-round PCR was run in a thermal cycle as follows: initial cycle at 94°C for 1 min and 40 cycles at 94°C for 30 s, 55°C for 30 s, and 72°C for 30 s, followed by a final extension-cycle at 72°C for 5 min. NCR1 (5'-GTATCTCGA GGCGACACTCCACCATAG-3') and NCR2 (5'-ATACTCGA GGTGCACGGTCTACGAGAC-3') were used as outer prim-ers, and NCR3 (5'-CCACCATAGATCTCTCCCCTGT-3') and NCR4 (5'-CACTCTCGAGCACCCTATCAGGCAGT-3') as inner primers. For the first amplification round, 5 µL cDNA was mixed with 45 µL of a reaction mixture containing 20 mM Tris-HCl, 50 mM KCl, 2 mM MgCl2,0.15 mM dNTP
(Pharmacia Biotech) mix, 1 U Taq DNA polymerase (Gibco-BRL), and 12.5 pmol of each outer primer. The second amplification was performed using 3 µL of the first amplifi-cation product and a mixture of the same composition as described above, but using inner primers, 0.2 mM dNTP (Pharmacia Biotech) mix and 1.5 mM MgCl2.The second
The first PCR round amplified a fragment of the 5'-untranslated region of the HCV genome with about 300 bp, and the second round amplified an internal fragment of the first amplification product of approximately 235 bp (13,14). The test sensitivity was about 1000 copies/mL, as determined by the control VQC serum panel (Viral Quality Control Laboratory, Alkmaar, Netherlands) of the profi-ciency program for viral NAT assays (15).
Commercially available polymerase chain reaction kits
A total of 38 samples reactive for both ELISA and IB but negative for nested PCR were submitted to a commercially available PCR test (Amplicor HCV version 2.0, Roche Molecular Systems, Branchburg, NJ, USA). This PCR was performed according to manufacturer instructions and com-prised three major steps: RNA extraction, cDNA amplifica-tion with biotinylated primers, and amplicon detecamplifica-tion. The
internal control of known concentration was amplified simul-taneously with the HCV RNA to ensure the validity of the test reaction. The biotinylated amplicon product was detected by hybridization with specific probes adsorbed on the micro-plate surface. The test detection limit was 50 IU/mL.
Results
A global comparison of algorithms A, B and the con-ventional algorithm (C) for the diagnosis of HCV infection is given in Figure 1. The conventional algorithm (C) was able to define the serological diagnosis in 72.7% of the samples (285/517 as positive and 91/517 as negative results); however, 27.3% (141/517) remained indeterminate.
For algorithm A the stratification of s/co ratio performed in all 517 ELISA-positive samples resulted in the IB confir-mation rates shown in Table 1.
Figure 1. Figure 1. Figure 1. Figure 1.
The use of algorithm A provided 287 positive results, in which 238 samples had s/co ratio ≥6, while 49 had s/co ratio <6 but positive by IB. Negative results were obtained in 91 samples and indeterminate in 139. Therefore, algo-rithm A was able to define serologic diagnosis in 73.1% (378/517) of the samples, and 26.9% (139/517) remained undefined (IB indeterminate). The concordance of positive results obtained by algorithm A and by the conventional algorithm C was 99.3% (285/287).
For algorithm B, 287 results were considered positive, comprising 249 PCR-positive and 38 PCR-negative (in-house and commercial PCR) but IB-positive tests. Nega-tive results were obtained for 91 samples by both PCR and IB tests, and 139 samples were PCR negative and IB indeterminate. Thus, algorithm B defined a serological or molecular diagnosis in 73.1% (378/517) of the samples. Despite the indeterminate IB results, 26.9% (139/157) of the samples were defined because PCR-negative results allowed us to exclude possible active infection.
The concordance between algorithm B and
conven-Table 2. Table 2. Table 2. Table 2.
Table 2. Serological and molecular results of the four samples whose results were in disagreement with algorithms A, B, and C.
Sample ELISA-s/co ratio Immunoblot PCR Algorithm result
A B C
86 8.6 Indeterminate Negative Positive Indeterminate Indeterminate 2268 7.0 Indeterminate Negative Positive Indeterminate Indeterminate 1992* 1.0 Indeterminate Positive Indeterminate Positive Indeterminate 2699** 4.3 Indeterminate Positive Indeterminate Positive Indeterminate s/co = signal-to-cut-off; cut-off ratio = s/co ratio with ≥95% concordance with IB-positive results. *The initial sample, 31 days before the confirmation sample, showed s/co ratio = 1.0 as determined with the Embrabio kit (Hemobio®
ELISA HCV third generation, São Paulo, SP, Brazil). However, it was positive when tested with the Murex-Abbott kit (s/co ratio >4.0); **Initial sample, 2 months before the confirmation test that showed the s/co ratio = 1.6 (possible window period).
tional algorithm C was 99.3% (285/287).
The positive results obtained using the three algo-rithms were: 287 for algorithm A, 287 for B, and 285 for conventional algorithm C. However, some of the samples did not receive a definite diagnosis owing to indeterminate IB results.
A total of 283 samples were positive for all three algo-rithms. Discrepant results were observed in four samples. Two of them were only positive for algorithm A (samples 2268 and 86, with s/co ratio ≥6) and the other two were only
positive for algorithm B (samples 1992 and 2699, PCR-positive). All four samples were indeterminate for the con-ventional algorithm (C; Table 2).
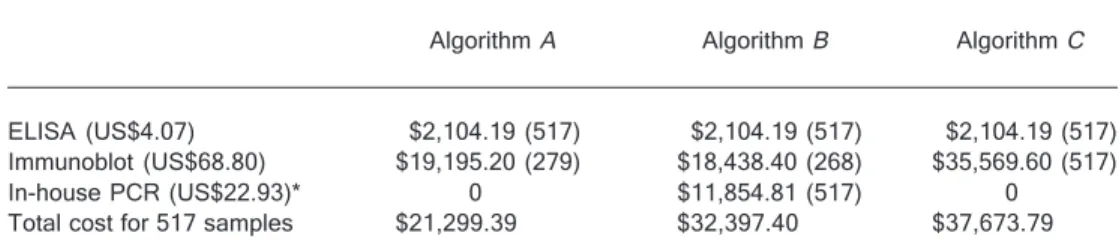
The cost of each algorithm depends on the method used and on the number of tests performed. The number and the cost of ELISA, IB and PCR tests performed for algorithms A, B and conventional C are shown in Table 3. The cost of algorithms A and B (in-house PCR) were 43.5 and 14.0%, respectively, lower than the cost of C; the cost of algorithm B using a commercial PCR kit was 80.4%
Table 1. Table 1. Table 1. Table 1.
Table 1. Association of the signal-to-cut-off (s/co) ratio obtained in all of the 495 ELISA-positive results, stratified into six groups, with the frequency of positive results obtained by anti-HCV immunoblot (IB) or by in-house nested PCR, or both.
ELISA-s/co ratio IB positive PCR positive IB and PCR positive
≥1<2 (164) 4.9% (8/164) 0.6% (1/164) 0.0% (0/164)
≥2<3 (29) 13.8% (4/29) 0.0% (0/29) 0.0% (0/29)
≥3<4 (22) 36.4% (8/22) 13.6% (3/22) 13.6% (3/22)
≥4<5 (29) 65.5% (19/29) 51.7% (15/29) 48.3% (14/29)
≥5<6 (13) 76.9% (10/13) 46.2% (6/13) 46.2% (6/13)
≥6 (238) 99.2% (236/238) 94.1% (224/238) 94.1% (224/238) Determination of the cut-off ratio = s/co ratio value with ≥95% concordance with IB-positive results. Twenty-two
higher than the cost of C.
In order to clarify indeterminate results (139 by algo-rithm A and 141 by algorithm C), these algorithms were expanded by performing PCR, with two samples becoming positive by this procedure. The total number of tests per-formed for each method, the cost involved in expanding the algorithms and the comparison among their cost can be seen in Table 4. The cost of algorithms A and C increased by 15.0 and 8.6%, respectively, when the algo-rithms were expanded using in-house PCR and by 59.1 and 34.3% if a commercial PCR was used. When using in-house PCR, the expanded algorithm A was 40.1% cheaper than the expanded algorithm C and 32.7% less expensive than when commercial PCR was used.
Discussion
Some laboratories report a result as positive for HCV infection considering only the screening antibody test, without any further confirmation by supplemental tests
such as IB or PCR (8). Since there is no established gold standard test, and given the high cost of supplemental tests for diagnosing HCV infection, the CDC published guidelines that proposed the two new algorithms (termed A and B in the present study) as an alternative to the conven-tional one.
In the present study, for algorithm A, the cut-off ratio ≥6 for ELISA-positive samples agreed with IB-positive results in 99.2% of the cases, underscoring its ability to accurately predict true antibody-positive results.
Some investigators have also considered s/co ratio as an effective viremia predictor. In samples with strong ELISA-positive results (s/co ratio >50) HCV RNA was detected in 93.6% of the cases. These investigators suggested a threshold set at s/co ratio = 10 to separate viremic and non-viremic populations (12). The cut-off ratio may vary ac-cording to the kit manufacturer and to the population tested, so it must be carefully established for each labora-tory. Reports from the US CDC show that average s/co ratio >3.8 is highly predictive of the true anti-HCV status for
Table 4. Table 4.Table 4.
Table 4.Table 4. Number of ELISA, immunoblot, or in-house PCR tests required for 517 samples to implement expanded algorithms A or C.
Confirmatory test Expanded algorithm A Expanded algorithm C In-house PCR (US$22.93)* $3,187.27 (139) $3,233.13 (141) Total cost of algorithms A andC (shown in Table 3) $21,299.39 $37,673.79 Total cost for 517 samples $24,486.66 $40,906.92 Data are reported in US dollars with number of tests in parentheses. *The cost of PCR using a commercially available kit (Amplicor® Hepatitis C virus test, version 2.0, Roche, Branchburg, NJ, USA)
was US$91.74 per sample tested. For all 517 samples the total cost for the expanded algorithm A was US$34,051.25, and for the expanded algorithm C it was US$50,609.13.
Table 3. Table 3.Table 3.
Table 3.Table 3. Number of ELISA, immunoblot, or PCR tests required for 517 samples and the estimated cost to implement algorithms A, B or C.
Algorithm A Algorithm B Algorithm C
ELISA (US$4.07) $2,104.19 (517) $2,104.19 (517) $2,104.19 (517) Immunoblot (US$68.80) $19,195.20 (279) $18,438.40 (268) $35,569.60 (517) In-house PCR (US$22.93)* 0 $11,854.81 (517) 0 Total cost for 517 samples $21,299.39 $32,397.40 $37,673.79 Data are reported in US dollars with number of tests in parentheses. *In algorithm B, the cost of PCR using a commercially available kit (Amplicor® Hepatitis C virus test, version 2.0, Roche, Branchburg, NJ,
kits manufactured by Ortho-Clinical Diagnostics (Ortho HCV version 3.0 ELISA, Raritan, NJ, USA) and by Abbott EIA (Abbott EIA 2.0, Chicago, IL, USA) and ratios >8.0 for kits manufactured by VITROS anti-HCV (Ortho-Clinical Diagnostics) (16,17), with sensitivity higher than 95%. A wide range of variation has been reported by Ren et al. (18) for domestic EIA kits, such as 6.0 to 14.0, with ≥95% sensitivity. Reflex supplemental testing could be limited to screening test-positive samples with ratios below the cut-off value. In studies conducted in October 2000 using the second-generation HCV ELISA assay, the authors ob-tained s/co ratio >3.0 as cut-off and high concordance (96%) with IB-positive tests (10).
In our samples, algorithm A was able to diagnose 46% (238/517) of the samples as true positive only by ELISA (s/ co ratio ≥6). In 54% (279/517) of the cases with s/co ratio <6 the IB tests were performed, producing definite positive (N = 49) or negative (N = 91) results in almost half the samples (140/279). For the remaining 139 (26.9%) samples, algorithm A was unable to define a laboratory diagnosis because of the indeterminate IB results.
Algorithm A was considered to be the best in terms of cost and feasibility, and for minimizing the number of samples requiring supplemental testing, being particularly suitable for limited resource laboratories. However, supple-mental PCR tests were still required to detect active infec-tion.
For algorithm B, all 517 ELISA-positive samples were submitted to reflex PCR testing, which produced positive results in 48.2% (249/517) of the cases. IB tests were carried out for the remaining 51.8% (268/517) of PCR-negative samples. No conclusive diagnosis was obtained for 139 (26.9%) samples (indeterminate IB). Nevertheless, the PCR-negative results for these samples were sufficient to define diagnosis, showing the absence of viremia, which is important in clinical practice.
The conventional algorithm (C) is particularly important in low prevalence populations, especially prone to false-positive HCV infection results. However, infection activity cannot be confirmed using only IB testing. The IB test used for this algorithm resulted in 141 (27.3%) indeterminate results, similar to the rate obtained using algorithm A, providing no conclusive diagnosis.
All three algorithms had similar diagnostic performance for the samples studied. Positive results were obtained in 287, 287 and 285 cases for algorithms A, B, and C, respectively. These data revealed a remarkable agree-ment in the results obtained by the algorithms.
PCR was performed to clarify indeterminate results (139 samples from algorithm A and 141 samples from conventional algorithm C) and was also applied to samples
from the three algorithms that did not agree. This supple-mental diagnosis entailed increased cost and is not man-dated by the CDC.
The main problem related to IB testing concerns the indeterminate results. Some plausible causes are: 1) sero-conversion phase, during which ELISA is already positive due to its higher sensitivity when compared to the IB test, which can still fail to meet the positivity criteria (19,20); 2) seroreversion in patients who spontaneously eliminate HCV. In these individuals, antibodies against some anti-genic fractions have already turned negative for the IB test, but they are sufficient to yield ELISA-positive results (19,21); 3) individuals infected with genotype 3 or other uncommon genotypes that could have low reactivity to antigen frac-tions from genotype 1a used in most commercially avail-able kits for anti-HCV. In this case, IB may be indetermi-nate but ELISA could be positive due to the reaction with better-preserved antigens such as core (22). 4) Other factors related to the kit performance (23) or to patient immunoresponse variability (24) may be involved.
Two samples (2699 and 1992) were PCR positive for algorithm B, but were indeterminate for both algorithm A and C. Sample 2699 had an s/co ratio three times higher in the sample collected at the donor’s return visit when com-pared to that collected at the time of donation. This sug-gests that the sample belonged to an individual who was under seroconversion. IB was indeterminate in the pres-ence of an NS3 band. This band was supposedly the one that most favors early seroconversion detection. It also shows concordance with viremia (25), which is consistent with the hypothesis we proposed. Sample 1992 had an s/ co ratio of 1.0 and was IB indeterminate, with bands NS3 (±), NS5 (±) and NS4 (2+). A sample collected 31 days before the patient’s return visit also had an s/co ratio of 1.0, indicating the low probability of its corresponding to a seroconversion phase, because the antibody level de-tected by ELISA did not increase during the period be-tween the two sample collections. However, this same sample was ELISA positive upon further testing using a kit from a different manufacturer (Murex, Abbott Laborato-ries), showing s/co ratio >4.0, suggesting low reactivity of the ELISA kit initially used. The positive PCR result en-sured that the sample belonged to a patient truly infected by HCV.
The cost of each algorithm depends on the number of supplemental tests required and varies according to the frequency of positive results in the population studied. It can be estimated by multiplying each test by its unitary cost (11) that was estimated taking into account the selling price used in Brazil; however, it must be only considered as an example. The following supplemental tests were car-ried out for the 517 ELISA-positive samples: 279 IB tests for algorithm A; 517 PCR and 268 IB tests for algorithm B, and 517 IB tests for conventional algorithm C. The total cost of the algorithms in American dollars on August 2007 based on the mean cost of 7 commercial tests (ELISA, and IB) and in-house PCR showed that algorithms A and B were respectively 43.5 and 16.0% cheaper than C. How-ever, if the commercial PCR is used, the total cost of algorithm B will be 80.4% higher than the cost of algorithm C. Algorithm A was certainly the most economical option while the cost of algorithms B and C depends on the use of either in-house PCR or a commercially available kit.
In order to solve the problem of indeterminate IB re-sults, algorithms A and C were expanded by performing in-house PCR testing which detected two additional positive samples. Algorithms A and C became 15.0 and 8.6% more expensive when they were expanded. Therefore, the cost of expanded algorithm A was 40.1% lower than that of expanded algorithm C that required lower number. In labo-ratories using the commercially available PCR kit, the cost of algorithms A and C increased significantly for a total of 517 samples (US$34,051.25 and US$50,609.13, respec-tively) but is lower than algorithm B (US$67,972.17). The expanded algorithm A involved the lowest number of supple-mental tests, which are very expensive.
Algorithm A is also recommended for populations with a high prevalence of HCV infection owing to its consistently positive results in screening tests and high concordance
with true-positive results, in that IB testing was required only for weakly reactive samples (3). With respect to algo-rithm B, PCR performance may speed up the clinical decision and lead to early treatment of HCV infection. This algorithm is the most suitable for immunosuppressed pa-tients for whom the IB test could represent a problem because of its low antibody level, leading to occasional false-negative results. Conventional algorithm C was use-ful for determining the immune status of the patients against HCV infection and also for confirming the specificity of positive ELISA results. It is recommended for low preva-lence populations for which false-positive antibody results are usually high. However, in the present study, this algo-rithm yielded a high frequency of IB-indeterminate results, producing no conclusive diagnosis. Furthermore, this al-gorithm did not differentiate between active and past infec-tions, a fact that may be crucial for clinical purposes.
Since screening tests are currently performed using only serological tests, of the three alternatives, algorithm B provided the most complete information. However, it was unable to screen pre-seroconversion phase individuals because ELISA-negative samples (a condition observed during the window phase) were not submitted to PCR.
The mandatory application of the NAT would render the IB test unnecessary except for ELISA-positive and NAT-negative samples. In this case, the IB test would screen patients with past HCV infections who have sponta-neously eliminated the virus.
The new algorithms A and B are highly sensitive and could be validated to diagnose HCV infection in Brazil. The choice of an algorithm must take into account its purpose, the population and the prevalence of HCV infection. It would also depend on the financial and infrastructure conditions of the laboratory.
References
1. Choo QL, Kuo G, Weiner AJ, Overby LR, Bradley DW, Houghton M. Isolation of a cDNA clone derived from a blood-borne non-A, non-B viral hepatitis genome. Science 1989; 244: 359-362.
2. Kuo G, Choo QL, Alter HJ, Gitnick GL, Redeker AG, Purcell RH, et al. An assay for circulating antibodies to a major etiologic virus of human non-A, non-B hepatitis. Science 1989; 244: 362-364.
3. Gretch DR. Diagnostic tests for hepatitis C. Hepatology 1997; 26: 43S-47S.
4. Neville JA, Prescott LE, Bhattacherjee V, Adams N, Pike I, Rodgers B, et al. Antigenic variation of core, NS3, and NS5 proteins among genotypes of hepatitis C virus. J Clin Micro-biol 1997; 35: 3062-3070.
5. Alter MJ, Kruszon-Moran D, Nainan OV, McQuillan GM, Gao F, Moyer LA, et al. The prevalence of hepatitis C virus infection in the United States, 1988 through 1994. N Engl J Med 1999; 341: 556-562.
6. Conry-Cantilena C, VanRaden M, Gibble J, Melpolder J, Shakil AO, Viladomiu L, et al. Routes of infection, viremia, and liver disease in blood donors found to have hepatitis C virus infection. N Engl J Med 1996; 334: 1691-1696. 7. Centers for Disease Control and Prevention (CDC).
Hepati-tis C virus infection among firefighters, emergency medical technicians, and paramedics - selected locations, United States, 1991-2000. Morb Mortal Wkly Rep 2000; 49: 660-665.
Guide-lines for laboratory testing and result reporting of antibody to hepatitis C virus. Morb Mortal Wkly Rep 2003; 52: 1-15. 9. Hoofnagle JH. Course and outcome of hepatitis C.
Hepatol-ogy 2002; 36: S21-S29.
10. Gonçales NS, Costa FF, Vassallo J, Gonçales FL Jr. Diag-nosis of hepatitis C virus in Brazilian blood donors using a reverse transcriptase nested polymerase chain reaction: comparison with enzyme immunoassay and recombinant protein immunoblot assay. Rev Inst Med Trop São Paulo 2000; 42: 263-267.
11. Barreto AMEC, Takei K, Sabino EC, Salles NA, Barreto CC, Nishiya AS, et al. Análise do custo benefício dos diferentes algoritmos para o diagnóstico da infecção pelo HCV. Annals of Congresso Brasileiro de Patologia Clínica/Medicina Labo-ratorial. 2004. p 38 (Abstract).
12. Bossi V, Galli C. Quantitative signal of anti-HCV by an automated assay predicts viremia in a population at high prevalence of hepatitis C virus infection. J Clin Virol 2004; 30: 45-49.
13. Stuyver L, Rossau R, Wyseur A, Duhamel M, Vanderborght B, Van Heuverswyn H, et al. Typing of hepatitis C virus isolates and characterization of new subtypes using a line probe assay. J Gen Virol 1993; 74 (Part 6): 1093-1102. 14. Stuyver L, Wyseur A, van Arnhem W, Hernandez F,
Maertens G. Second-generation line probe assay for hepa-titis C virus genotyping. J Clin Microbiol 1996; 34: 2259-2266.
15. VQC proficiency programme for viral NAT assays in 2000. The Viral Quality Control (VQC) laboratory, The National Serology Reference Laboratory, The Delft Diagnostic Labo-ratory, organized [Cited Aug 27, 2007]. Viral Quality Control (VQC) laboratory http://www.inmunochem.com/descargar/ VQC_2000.pdf; 2007.
16. National Institutes of Health Consensus Development Con-ference Statement: Management of hepatitis C: 2002 - June 10-12, 2002. Hepatology 2002; 36: S3-S20.
17. Oethinger M, Mayo DR, Falcone J, Barua PK, Griffith BP. Efficiency of the ortho VITROS assay for detection of hepa-titis C virus-specific antibodies increased by elimination of supplemental testing of samples with very low sample-to-cut-off ratios. J Clin Microbiol 2005; 43: 2477-2480. 18. Ren FR, Lv QS, Zhuang H, Li JJ, Gong XY, Gao GJ, et al.
Significance of the signal-to-cut-off ratios of anti-hepatitis C virus enzyme immunoassays in screening of Chinese blood donors. Transfusion 2005; 45: 1816-1822.
19. Kiely P, Kay D, Parker S, Piscitelli L. The significance of third-generation HCV RIBA-indeterminate, RNA-negative results in voluntary blood donors screened with sequential third-generation immunoassays. Transfusion 2004; 44: 349-358.
20. Kleinman SH, Stramer SL, Brodsky JP, Caglioti S, Busch MP. Integration of nucleic acid amplification test results into hepatitis C virus supplemental serologic testing algorithms: implications for donor counseling and revision of existing algorithms. Transfusion 2006; 46: 695-702.
21. Kondili LA, Chionne P, Costantino A, Villano U, Lo Noce C, Pannozzo F, et al. Infection rate and spontaneous serore-version of anti-hepatitis C virus during the natural course of hepatitis C virus infection in the general population. Gut 2002; 50: 693-696.
22. Bassit L, Da Silva LC, Ribeiro-Dos-Santos G, Maertens G, Carrilho FJ, Fonseca LE, et al. Chronic hepatitis C virus infections in Brazilian patients: association with genotypes, clinical parameters and response to long-term alpha inter-feron therapy. Rev Inst Med Trop São Paulo 1999; 41: 183-189.
23. Zachary P, Ullmann M, Djeddi S, Meyer N, Wendling MJ, Schvoerer E, et al. Evaluation of three commercially avail-able hepatitis C virus antibody detection assays under the conditions of a clinical virology laboratory. J Clin Virol 2005; 34: 207-210.
24. Busch MP. Insights into the epidemiology, natural history and pathogenesis of hepatitis C virus infection from studies of infected donors and blood product recipients. Transfus Clin Biol 2001; 8: 200-206.
25. Feucht HH, Zollner B, Polywka S, Laufs R. Study on reliabil-ity of commercially available hepatitis C virus antibody tests. J Clin Microbiol 1995; 33: 620-624.
26. Simon N, Courouce AM, Lemarrec N, Trepo C, Ducamp S. A twelve year natural history of hepatitis C virus infection in hemodialyzed patients. Kidney Int 1994; 46: 504-511. 27. Lefrere JJ, Guiramand S, Lefrere F, Mariotti M, Aumont P,
Lerable J, et al. Full or partial seroreversion in patients infected by hepatitis C virus. J Infect Dis 1997; 175: 316-322.