A MODEL TO EXPLAIN HIGH VALUES OF pH
IN AN ALKALI SODIC SOIL
José Guerrero-Alves1*; Ildefonso Pla-Sentís2; Rafael Camacho1
1
Center for Research and Extension of Soils and Waters (CIESA), University “Rómulo Gallegos”, San Juan de los Morros 2301, Guárico-Venezuela.
2
Edafology Institute, University Central of Venezuela, Maracay-Venezuela. *Corresponding author <joseguer@cantv.net>
ABSTRACT: For alkali sodic soils (pH>8.5), the “hydrolysis of exchangeable sodium” has been used as a possible explanation for the alkalinity production and rise in pH of these soils. As an alternative to this hypothesis, a model was developed to simulate and to explain that the alkalinity production and rise in pH is possible in a soil that accumulates alkaline sodium salts and CaCO3. Several simulations were performed by using different combinations of CO2 partial pressures (P), presence or absence of MgCO3, along with experimental values of exchangeable sodium percentage (ESP) and ion concentrations in saturation extracts from an alkali sodic soil (named Pantanal). A hypothetical system with similar conditions to the Pantanal soil but with a Gapon selectivity coefficient (KG) of 0.01475 (mmol L-1)-1/2 was also considered. Good agreement was obtained between
experimental and predicted values for pH and ion concentrations in the soil solution when the model (without MgCO3) was applied to the Pantanal soil. However, KG values calculated for the Pantanal soil were generally higher than 0.01475 (mmol L-1)-1/2. Moreover, high pH values and elevated ionic strength were obtained when
a KG of 0.01475 (mmol L-1)-1/2 was used at high ESP (similar to those found in the Pantanal soil). KG values
obtained for the Pantanal soil and the results obtained in the simulation of the hypothetical system are suggesting that a value higher than 0.01475 (mmol L-1)-1/2 should be used to adequately simulate the behavior of the
Pantanal soil at low ionic strength and high ESP values.
Key words: Gapon selectivity coefficients, calcium carbonate, sodium bicarbonate, alkaline hydrolysis
MODELO PARA EXPLICAR VALORES ELEVADOS DE pH
EM UM SOLO SÓDICO ALCALINO
RESUMO: Em solos alcalino sódicos (pH>8,5), a “hidrólise de sódio trocável” tem sido usada como uma possível explicação para a produção de álcali e elevação do pH nestes solos. Como uma alternativa a essa hipótese, um modelo foi desenvolvido para simular e explicar que a produção de álcali e elevação do pH é possível num solo que acumula sais alcalinos de sódio e CaCO3. Várias simulações foram feitas fazendo uso de diferentes combinações da pressão parcial de CO2 (P), presença ou ausência de MgCO3, com valores experimentais da porcentagem de sódio trocável (ESP) e concentrações de íons em extratos de saturação de um solo sódico alcalino (chamado Pantanal). Um sistema hipotético com condições similars ao solo Pantanal mas com um coeficiente de selectividade de Gapon (KG) de 0,01475 (mmol L-1)-1/2 foi, também, considerado.
Boa concordância foi obtida entre os valores experimentais e os predezidos para o pH e concentração de íons na solução do solo quando o modelo (sem MgCO3) foi aplicado ao solo Pantanal. Porém, valores de KG calculados para o solo Pantanal estiveram muito acima de 0,01475 (mmol L-1)-1/2. Além disso, elevados valores
de pH e da força iónica foram obtidos quando o KG de 0,01475 (mmol L-1)-1/2 foi usado a altos ESP. Valores de
KG obtidos para o solo Pantanal e os resultados achados na simulação do sistema hipotético sugerem que um valor maior de 0,01475 (mmol L-1)-1/2 poderia ser empregado adequadamente para simular o comportamento
do solo Pantanal a baixa força iônica e altos valores de ESP.
Palavras-chave: coeficiente de selectividade de Gapon, carbonato de cálcio, sais alcalinos de sódio, porcentagem de sódio trocável
INTRODUCTION
For alkali sodic soils (pH > 8.5) the hydrolysis of exchangeable sodium has been used as a possible explanation for the alkalinity production and rise in pH. The reaction:
NaX + H2O → HX + Na+ + OH- (1) could be used to define the “hydrolysis of exchangeable sodium” (U.S. Salinity Laboratory Staff, 1954; Mashhady & Rowell, 1978). After an increase in the exchangeable
Na, subsequent dilution of the soil solution by rainwater or irrigation would cause desorption and hydrolysis of the weakly adsorbed Na with a rise in pH (Brown & Miller, 1971; Shainberg, 1973; Mashhady & Rowell, 1978). Reaction (1) can, however be split in two parts: H2O → H+ + OH- (2)
In alkali sodic soils, the production of “H+”, as suggested by reaction 2, must be strongly suppressed and, consequently, monovalent hydrogen cannot compete with the sodium ion for exchange sites. Under these conditions, the presence of “protonated clays” (HX) would not be possible in these soils and, therefore, both NaOH and alkalinity production cannot be explained by reaction (1).
In alkali sodic soils, at relatively low ionic strength, high pH values may be related to the accumulation of sodium bicarbonates and carbonates, which are soluble salts capable of undergoing alkaline hydrolysis (Kovda & Samoilova, 1969; Szabolcs, 1969; Cruz-Romero & Coleman, 1975; Gupta et al., 1985; Szabolcs, 1987; Gupta & Abrol, 1990; Guerrero-Alves, 1998). Other evidences also point out that the presence
of precipitated CaCO3 and MgCO3 are determining high
values of pH in alkali sodic soils (Cruz-Romero & Coleman, 1975; Pla-Sentís, 1985; Gupta & Abrol, 1990; Guerrero-Alves, 1998). For these reasons, reaction (1) cannot explain the high pH values in alkali sodic soils.
The purpose of this work was to find a model to simulate and to explain the alkalinity production and rise in pH in soils that accumulate alkaline sodium salts jointly
with precipitated carbonates of divalent ions (CaCO3 and
MgCO3) to relatively low ionic strength. Exchange of
Ca-Mg-Na ions was considered. Other anions such as chlorides and sulfates were also included in the model to have conditions closer to real alkali sodic soils. The procedure of Nakayama (1970) was modified to establish a computational routine.
Development of the model
The balance of charges in solution for a system composed by sodium carbonates and bicarbonates; an
exchanger limited to Ca-Mg-Na ions; CaCO3; MgCO3;an
external CO2 source; and chlorides and sulfates; can be
given by:
[H+] + [Na+] + 2[Ca2+] + 2[Mg2+] = [HCO 3
-] + 2[CO 3
2-] +
[OH-] + [Cl-] + 2[SO 4
2-] (4)
where the brackets for chemical species [ ] denote molar concentration in aqueous solution.
Concentrations of H+, Ca2+, Mg2+,HCO 3
-, CO 3
2-and OH- are regulated by the constants of dissociation,
ionization or precipitation, which have been adapted from Nakayama (1970) [except equation 9].
K =[H ].r .[HCO ].r (H CO )
1A +
1 3- 3 2 3
(5)
K =[H ].r .[CO ].r [HCO ].r
2A +
1 32- 4
3
-3 (6)
K = [H ].r .[OH ].rW +
1 - 2 (7)
K = [Ca ].r .[CO ].rS 2+
5 32- 4 (8)
KS2= [Mg ].r .[CO ].r2+
9 32- 4 (9)
(H CO ) = k.2 3 P (10)
k = 0.0344 - 0.0084.I (11) where K1A and K2A respectively define the first and second constants of H2CO3 ionization; Kw= water self-protolysis constant; KS= solubility product constant of CaCO3; KS2=
solubility product constant of MgCO3; k= Henry’s law
constant for the solubility of CO2; P= partial pressure of CO2; and I= ionic strength of the resulting solution. r1, r2, r3, r4, r5 and r9 are respectively the activity coefficients for H+, OH-, HCO
3 -, CO
3
2-, Ca2+ and Mg2+. The activity coefficients for Na+, Cl- and SO
4
2- ions, not explicitly included in equations from (4) to (11) but necessary in the calculations, are respectively r6, r7 and r8. Brackets for chemical species ( ) define the activities in solution.
The Ca-Na exchange reaction, as initially proposed by Gapon (Bohn et al., 1979), has the form: Ca1/2X + Na+ ————> NaX + 1/2Ca2+ (12)
Considering for the magnesium ion an analogue behavior to the calcium ion (Porta et al., 1999), the Gapon selectivity coefficient (KG) can be calculated as follows:
KG =[NaX].[Ca + Mg ] [Ca X + Mg X].[Na ]
2+ 2+ 1/2
1/2 1/2 + (13)
where the concentrations of exchangeable cations, [NaX] or [Ca1/2X+Mg1/2X], are expressed on cmol(+) kg-1, and the
soluble cation concentrations are expressed as mol L-1.
From equation (13), it follows that sodium concentration in the solution can be estimated from the equivalent fractions of sodium on the exchanger (ENa), [Ca2++ Mg2+] and KG as follows:
[Na ] =E .[Ca + Mg ] (1- E ).KG
+ Na
2+ 2+ 1/2
Na (14) Combining equations (5), (6), (7), (8) and (9) with equations (10), (11), (14) and (4) results:
[
]
[H ] ++ KS.r9+KS.r5 +
K1A.K2A.k. .r5.r9
1/ 2 r1.[H+ ].ENa KG.(1-ENa )
(2.KS.r9 +2.KS2.r5 ).[H+ ]2.r12 r5.r9.K1A .K2A .k.
•
P P =
K1A.k. [H+ ].r1.r3
2.K1A.K2A.k. [H+ ]2 .r12 .r4
KW r1.r2.[H+ ]
-4
2-+ + + [Cl ] + 2[SO ]
P P
(15)
Rearranging equation (15) and expressing H+ as
hydrogen ion activity (H+), the equation becomes:
F1.(H+)4 +F2.(H+)3 + F3.(H+)2 +F4(H+) + F5 = 0 (16)
where:
F1= 2.K .r + 2.K .r K .K .k. .r .r .r
S 9 S2 5
The same experimental values of ESP and ion concentrations used in the second simulation were also employed in a third simulation. However, the partial pressures of CO2 were additionally varied to generate the pH values in the saturation pastes of the Pantanal soil (Table 1). Results of third simulation are shown in Table 4.
A system composed by alkaline sodium salts,
CaCO3 (without MgCO3) and an exchanger of ions
(Ca-Mg-Na) with an hypothetical KG of 0.01475 (mmol L-1)-1/2 [U.S. Salinity Laboratory Staff, 1954], was also simulated by using equations (20) to (24). The pH and concentrations of all chemical species in solution were generated at 10% ESP (exchangeable sodium percentage) intervals, from 10 up to 90%. Chloride, sulfate and magnesium concentrations of respectively 4, 1 and 1 mmolc+ L-1 (similar to those found in the Pantanal soil) were considered (Table 5). To study the effect of the ionic strength and to maintain the validity of the approximation [Mg2+]>>>[Ca2+] (necessary to operate the model), the sulfate concentration was increased in 2 mmolc+ L-1 for each 10% ESP intervals from a initial value of 2 mmolc+ L-1(Table 6).
In all simulations, the models use an autoconsistent iterative method, similar to the one of Nakayama (1970), which compare consecutive values of the ionic strength and hydrogen ion activity (H+); the latter comparison is “nested” into the ionic strength iterations. At the first stage of the computational process, a reasonable initial “guess” of the ionic strength was necessary for estimating the ionic activity coefficients, which were calculated according to the extended Debye-Hückel equation (Peters et al., 1974). This step was necessary because the ionic concentrations were unknown at this stage (Nakayama, 1970).
The initial activity coefficients, in combination with the equilibrium constants, KG, ESP, P, and chloride, along with sulfate and magnesium (when necessary) concentrations, were used to compute the coefficients (equations from 17 to 21 or from 20 to 24) of the 4th grade
polynomial (equation 16). To solve the 4th grade
polynomial equation for (H+), the Newton-Raphson
iterative procedure was used, which also needs a reasonable initial “guess” of pH. This iterative procedure was continued until two similar consecutive values of (H+) [differences <10-30] were obtained. The first (H+) value (first iteration for ionic strength) and the necessary set of equations (equations from 5 to 11 and 14) were then used to compute the cation and anion concentrations and, consequently, a new ionic strength value was obtained. This new ionic strength was used in the second iteration to improve the activity coefficients. The iterative procedure for the ionic strength was continued until obtaining two close successive values (differences <10-21).
In the first, second and third simulations, in order to find a KG value compatible to both, the concentrations of exchangeable ions as well as soluble ions, the ionic strength iterations were nested in a computational
[
]
F2 =r1+ .
13
KS.r9+KS2.r5 K1A .K2A .k. .r5.r9
1/2 ENa
KG.(1-ENa ).r12
P (18)
F Cl
r r SO r r
3 2
12 7 4 2
12 8
= -
--
-( ) .
( )
. (19)
F4 =K .k. r .r 1A
1 2
3 P
- K
r r W
1 2
2
. (20)
F5 = -2.K .K .k. r .r
1A 2A
12 4
P
(21)
The preceding procedure used to obtain polynomial coefficients of equation (16) can be also employed to obtain an equivalent expression to equation
15 but considering that precipitated MgCO3 does not
control the presence of magnesium in solution. To facilitate the resolution of this equivalent expression it is
necessary to assume that [Mg2+] is much higher as
compared to [Ca2+] ([Mg2+]>>>[Ca2+]). In consequence, it can be shown that F1, F2 and F3, new coefficients of equation (16), correspond to the following expressions:
F1= 2.K
K .K .k. .r .r
S
1A 2A P 12 5 (22)
F2 = 1
r13 (23)
F3 = (Mg )r2+ 1/2 . ENa +2(Mg )-(Cl-)-2(SO ) 9
2+
4
2-KG.(1-ENa).r12 r .r12 9 r .r12 7 r .r12 8 (24) In this case, F4 and F5 do not change and they are respectively equal to equations (20) and (21).
MATERIAL AND METHODS
In order to calculate pH, concentrations of all chemical species in aqueous solution and KG (when necessary), the models (equations from 17 to 21 or from 20 to 24) were translated into the BASIC language and operated using a digital computer system. The programs
(when necessary) used different partial pressures of CO2
(P).
In the first and the second simulations, a natural
system with accumulation of alkaline sodic salts, CaCO3,
MgCO3 (only CaCO3 in the second simulation) and the
partial atmospheric pressure of CO2 (P) [0.35x10⁻⁴ MPa] was assumed. Both programs used experimental values of ESP and, [Cl-], [SO
4
2-], [Mg2+] (assumed as [Ca+Mg] in the second simulation and predicted in the first simulation) and [Na+] in the saturation extracts, from an alkali sodic soil named Pantanal (Table 1). These values
were employed to predict pH, KG, and [CO32-], [HCO
routine, which departing from an initial KG value (<0.01475 (mmol L-1)-1/2)gave different KG values. These KG values were changed until the last KG value permitted to obtain [Na+] similar to the one in the saturation extracts.
The equilibrium constants (except KS2) used in
equations 17, 18, 20, 21 and 22 were taken from
Nakayama (1970). Their values were: K1A=4.34x10⁻⁷,
K2A=4.69x10⁻¹¹, Kw=1x10-14, Ks=5.0x10⁻⁹, and k=0.0344-0.0084.I. The KS2 value (1x10⁻⁵) was obtained from Skoog & West (1975 ).
Samples were collected from a pedon belonging to the Chaguaramas Series (Chaguaramas, Guárico State-Venezuela), 9° 20’ 36’’ NL and 66° 14’ 40’’ WL. The pedon, named here as Pantanal soil, was classified as a Typic Natrustalf (Soil Survey Staff, 1998) and was sampled at 0.1 m depth intervals up to the 2.5 m depth. The twenty-five soil samples obtained were air dried and passed through a 2 mm sieve. The material >2 mm was individually crushed to sizes <2 mm and incorporated to the previously sieved soil less than 2 mm, and then homogenized.
In every individually homogenized soil samples, the pH was measured in the saturation paste, and the extract was used for determination of Ca2++Mg2+, Na+, CO32-, HCO
3
-, Cl- and SO 4
2- (U.S. Salinity Laboratory Staff, 1954). As all extracts were dark colored, it was necessary
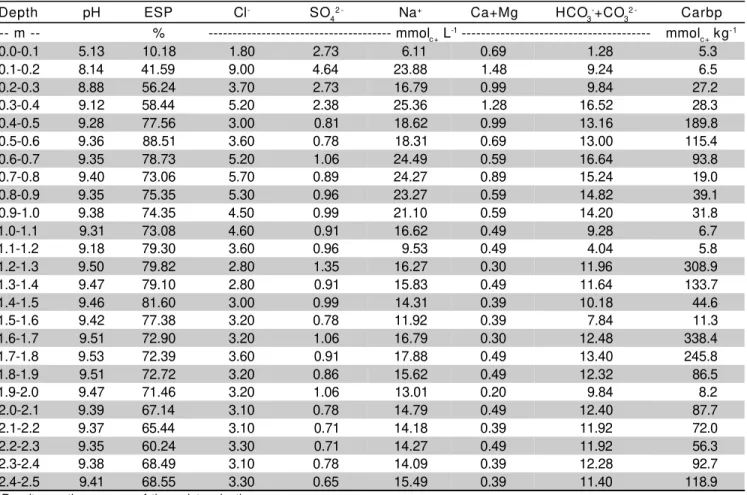
Table 1 - Experimental values* of pH, exchangeable sodium percentage (ESP), soluble ions and precipitated carbonates (Carbp) of the Pantanal soil, determined at 0.1 m depth intervals.
*Results are the average of three determinations.
to process them with the clarifying technique of Robbins (1989).
On the other hand, 100 g of the same twenty five processed soil samples were additionally crushed to sizes <0.425 mm and homogenized. These samples were used for the determination of the cation exchange capacity (CEC) and ESP (U.S. Salinity Laboratory Staff, 1954). Calcium and magnesium carbonates were analyzed as described by Pla-Sentís (1969).
All determinations were carried out in triplicate and the experimental values shown in the Table 1 are the averages of these determinations.
RESULTS AND DISCUSSION
Results obtained by our model, assuming a soil
that accumulates alkaline sodium salts, CaCO3 and
MgCO3 (using equations from 17 to 21), show that the
values of pH measured in the Pantanal soil were similar to the predicted ones (the differences were lower than 3% of measured data) to 0.5-2.5 m depth (Figure 1; Tables 1 and 2). However, predicted [Mg2+] (Table 2) were 16 to 92 times higher than [Ca+Mg] measured in saturation extracts at the same depth (Table 1). These
results indicate that MgCO3 phase is not controlling the
[Mg2+] in the soil solution of the Pantanal soil. Precipitated
Depth pH ESP Cl- SO
42 - Na+ Ca+Mg HCO3-+CO32 - Carbp
-- m -- % --- mmolc+ L-1 --- mmol c+ kg-1
0.0-0.1 5.13 10.18 1.80 2.73 6.11 0.69 1.28 5.3
0.1-0.2 8.14 41.59 9.00 4.64 23.88 1.48 9.24 6.5
0.2-0.3 8.88 56.24 3.70 2.73 16.79 0.99 9.84 27.2
0.3-0.4 9.12 58.44 5.20 2.38 25.36 1.28 16.52 28.3
0.4-0.5 9.28 77.56 3.00 0.81 18.62 0.99 13.16 189.8
0.5-0.6 9.36 88.51 3.60 0.78 18.31 0.69 13.00 115.4
0.6-0.7 9.35 78.73 5.20 1.06 24.49 0.59 16.64 93.8
0.7-0.8 9.40 73.06 5.70 0.89 24.27 0.89 15.24 19.0
0.8-0.9 9.35 75.35 5.30 0.96 23.27 0.59 14.82 39.1
0.9-1.0 9.38 74.35 4.50 0.99 21.10 0.59 14.20 31.8
1.0-1.1 9.31 73.08 4.60 0.91 16.62 0.49 9.28 6.7
1.1-1.2 9.18 79.30 3.60 0.96 9.53 0.49 4.04 5.8
1.2-1.3 9.50 79.82 2.80 1.35 16.27 0.30 11.96 308.9
1.3-1.4 9.47 79.10 2.80 0.91 15.83 0.49 11.64 133.7
1.4-1.5 9.46 81.60 3.00 0.99 14.31 0.39 10.18 44.6
1.5-1.6 9.42 77.38 3.20 0.78 11.92 0.39 7.84 11.3
1.6-1.7 9.51 72.90 3.20 1.06 16.79 0.30 12.48 338.4
1.7-1.8 9.53 72.39 3.60 0.91 17.88 0.49 13.40 245.8
1.8-1.9 9.51 72.72 3.20 0.86 15.62 0.49 12.32 86.5
1.9-2.0 9.47 71.46 3.20 1.06 13.01 0.20 9.84 8.2
2.0-2.1 9.39 67.14 3.10 0.78 14.79 0.49 12.40 87.7
2.1-2.2 9.37 65.44 3.10 0.71 14.18 0.39 11.92 72.0
2.2-2.3 9.35 60.24 3.30 0.71 14.27 0.49 11.92 56.3
2.3-2.4 9.38 68.49 3.10 0.78 14.09 0.39 12.28 92.7
Table 2 - Ion concentrations, pH and Gapon selectivity coefficients (KG) of the Pantanal soil, at 0.1-m depth intervals, predicted by using the proposed model (equations from 17 to 21) and experimental data from Table 1 (PCO2 = 0.35x10⁻⁴
MPa).
carbonates in the Pantanal soil seem to be mainly
composed by CaCO3, which was additionally
corroborated by the analysis of precipitated salts (not reported here) in this soil (Guerrero-Alves, 1998).
Taking into account these previous results, a new model was used for the Pantanal soil, which excludes the
presence of MgCO3 (using equations from 20 to 24) and
employs [Ca+Mg] as magnesium concentrations. The values of pH measured in the Pantanal soil were also similar to the predicted ones, except for the 0.0-0.2 m
depth (Figure 2) where the differences were over 4%. This can be due to the very low concentrations of precipitated calcium carbonates found at that depth (Table 1), or the assumption that the CO2 partial pressure is atmospheric (0.35x10⁻⁴ MPa) is not very realistic for a saturation paste. On the other hand, this model seems
to predict adequately [HCO3-]+[CO
3
2-] in the saturation extracts, as is shown in Figure 3. In 90% of the cases below 0.2 m depth, differences between experimental and predicted data (Tables 1 and 3, respectively) oscillated
between 2 and 21% of experimental [HCO3-]+[CO
3 2-]; which are respectively representing differences between 0.3 and 2.6 mmolc+ L-1 in predicted [HCO
3 -]+[CO
3 2-]. In relation to divalent ions below 0.2 m depth
(Table 3), predicted values of [Ca2+] (between 0.01 and
0.08 mmolc+ L-1) correspond around to 1-10% of the
experimental [Ca+Mg] (assumed totally as [Mg2+]) in 90%
of these values; which indicates that the approximation [Mg2+]>>>[Ca2+] (necessary to operate the model) was reasonable in these systems that accumulate alkaline
sodium salts and CaCO3. Excluding the 0.0-0.2 m depth,
where the model had a bad performance, the main differences between experimental and predicted concentrations can be due to the fact that the pH was measured in saturation pastes, whereas experimental concentrations were measured in saturation extracts.
Depth C a2+ Mg2+ HCO
3- CO32 - HCO3-+CO32- pH KG
-- m -- --- mmolc+ L-1 --- (mmol L-1)-1/2
0.0-0.1 0.01 22.16 16.62 7.09 23.71 9.42 0.06176
0.1-0.2 0.01 18.60 19.09 9.73 28.82 9.48 0.09096
0.2-0.3 0.01 17.86 18.89 9.30 28.19 9.48 0.22878
0.3-0.4 0.01 14.94 21.02 11.67 32.69 9.52 0.15161
0.4-0.5 0.01 15.66 20.03 10.41 30.44 9.50 0.51959
0.5-0.6 0.01 16.06 19.80 10.16 29.96 9.50 1.19251
0.6-0.7 0.01 14.62 21.11 11.71 32.82 9.52 0.40880
0.7-0.8 0.01 14.84 20.95 11.54 32.49 9.52 0.30444
0.8-0.9 0.01 15.05 20.74 11.29 32.03 9.51 0.36050
0.9-1.0 0.01 15.51 20.31 10.78 31.09 9.51 0.38268
1.0-1.1 0.01 17.36 19.04 9.40 28.44 9.48 0.48130
1.1-1.2 0.01 20.22 17.40 7.77 25.17 9.44 1.27864
1.2-1.3 0.01 16.81 19.28 9.62 28.90 9.49 0.70506
1.3-1.4 0.01 16.75 19.26 9.58 28.84 9.49 0.69212
1.4-1.5 0.01 17.57 18.77 9.09 27.86 9.48 0.91875
1.5-1.6 0.01 18.67 18.13 8.45 26.58 9.46 0.87696
1.6-1.7 0.01 16.64 19.40 9.74 29.14 9.49 0.46222
1.7-1.8 0.01 16.30 19.64 10.00 29.64 9.49 0.41880
1.8-1.9 0.01 17.02 19.12 9.44 28.56 9.48 0.49801
1.9-2.0 0.01 18.32 18.36 8.68 27.04 9.47 0.58264
2.0-2.1 0.01 17.29 18.93 9.24 28.17 9.48 0.40624
2.1-2.2 0.01 17.52 18.78 9.08 27.86 9.48 0.39528
2.2-2.3 0.01 17.58 18.75 9.06 27.81 9.47 0.31490
2.3-2.4 0.01 17.60 18.74 9.04 27.78 9.47 0.45771
2.4-2.5 0.01 17.01 19.10 9.42 28.52 9.48 0.41048
Figure 1 - Experimental pH values measured in saturation paste (SP) and pH values predicted by using the proposed model (MOD) [equations from 17 to 21], at 0.1 m depth intervals, in the Pantanal soil.
4 5 6 7 8 9 10
0.00 0.25 0.50 0.75 1.00 1.25 1.50 1.75 2.00 2.25 2.50 DEPTH (m)
pH
On the other hand, for predicting the pH and concentration values shown in Figures 2 and 3, the model with the best performance (using equations from 20 to 24) generates KG values (Table 3) between 2 and 17 times greater than 0.01475 (mmol L-1)-1/2; except for 0.0-0.1 m depth where is comparable to this value. These KG values are identical, until the fourth decimal figure, to the KG values (not reported here) calculated by using
the experimental values of ESP, [Na+] and [Ca+Mg]
(Table 1) in equation 14. Bohn et al. (1979) indicated that the Gapon equation, with a KG value of 0.01475
Table 3 - Ion concentrations, pH and Gapon selectivity coefficients (KG) of the Pantanal soil, at 0.1-m depth intervals, predicted by using the proposed model (equations from 20 to 24) and experimental data from Table 1 ([Mg2+] = [Ca+Mg],
PCO2 = 0.35x10⁻⁴ MPa).
(mmol L-1)-1/2, cannot be satisfactorily applied for soils when ESP values are above 40%. All ESPs for the Pantanal soil, except at a 0.0-0.1 m depth, are higher than 40% (Table 1). These high ESP values are associated with both relatively high quantities of alkaline sodium salts (expressed as [HCO3-]+[CO
3
2-]-[Ca+Mg]) and very low [Ca+Mg] in solution (Table 1). Under these conditions, a poor competition of divalent ions for the exchange sites can be expected and also a progressive sodification of the exchanger phase. The KG values obtained in conditions where alkaline sodium salts in
Figure 2 - Experimental pH values measured in saturation paste (SP) and pH values predicted by using the proposed model (MOD) [equations from 20 to 24], at 0.1 m depth intervals, in the Pantanal soil.
4 5 6 7 8 9 10
0.00 0.25 0.50 0.75 1.00 1.25 1.50 1.75 2.00 2.25 2.50 DEPTH (m)
pH
pH(SP) pH(MOD)
Figure 3 - Concentrations of HCO3- + CO
32-, Ca2+ + Mg2+ and Ca2+ in
the Pantanal soil, at 0.1 m depth intervals, measured in saturation paste (SP) and predicted by using the proposed model (MOD) [equations from 20 to 24]. 0
5 10 15 20
0.00 0.25 0.50 0.75 1.00 1.25 1.50 1.75 2.00 2.25 2.50
DEPTH (m)
concentration (mmol(+)/L)
HCO3+CO3 (SP) HCO3+CO3 (MOD)
Ca+Mg (SP) Ca (MOD)
Depth C a2+ HCO
3- CO32 - HCO3-+CO32- pH KG
-- m -- --- mmolc+ L-1 --- (mmol L-1)-1/2
0.0-0.1 0.33 2.46 0.13 2.59 8.63 0.01090
0.1-0.2 0.03 9.52 2.21 11.73 9.19 0.02565
0.2-0.3 0.03 9.32 2.04 11.36 9.19 0.05385
0.3-0.4 0.01 14.14 4.91 19.05 9.36 0.04436
0.4-0.5 0.02 12.25 3.55 15.80 9.31 0.13060
0.5-0.6 0.02 11.50 3.11 14.61 9.28 0.24711
0.6-0.7 0.01 14.03 4.78 18.81 9.36 0.08209
0.7-0.8 0.01 13.88 4.68 18.56 9.36 0.07454
0.8-0.9 0.02 13.31 4.28 17.59 9.34 0.07135
0.9-1.0 0.02 12.48 3.72 16.20 9.31 0.07462
1.0-1.1 0.03 9.51 2.10 11.61 9.20 0.08085
1.1-1.2 0.08 4.99 0.55 5.54 8.93 0.19897
1.2-1.3 0.02 10.07 2.35 12.42 9.23 0.09416
1.3-1.4 0.02 10.20 2.41 12.61 9.23 0.11834
1.4-1.5 0.03 8.91 1.82 10.73 9.18 0.13685
1.5-1.6 0.04 7.19 1.16 8.35 9.09 0.12673
1.6-1.7 0.02 10.34 2.49 12.83 9.24 0.06205
1.7-1.8 0.02 11.02 2.84 13.86 9.26 0.07258
1.8-1.9 0.02 9.83 2.23 12.06 9.22 0.08447
1.9-2.0 0.04 7.65 1.32 8.97 9.11 0.06086
2.0-2.1 0.03 9.39 2.02 11.41 9.20 0.06838
2.1-2.2 0.03 8.94 1.83 10.77 9.18 0.05897
2.2-2.3 0.03 8.93 1.83 10.76 9.18 0.05255
2.3-2.4 0.03 8.83 1.78 10.61 9.17 0.06812
solution are present reflect a greater preference of the soil for sodium ion. Therefore, the high-predicted KG in the Pantanal soil could be due to the high accumulation of alkaline sodium salts.
Table 4 shows for different depths in the Pantanal soil, both predicted ion concentrations and partial
pressures of CO2 by using the proposed model
(equations from 20 to 24) and forced to adjust
simultaneously the experimental data for [Na+] and pH in
Table 1. In the shallow horizon (0.0-0.1 m), the misleading
CO2 pressure calculated for the model clearly indicates
no equilibrium with the calcite phase. A value of CO2
partial pressure of 4.90x10⁻⁴ MPa, 14 times greater than
the atmospheric CO2 partialpressure (0.35x10⁻⁴ MPa),
was calculated in the sample that corresponded to 0.1-0.2 m depth. This fact seems to indicate some microbiological activity in that sample, probably due to a relatively high content of organic matter. Important discrepancies were also obtained between predicted [Ca] and [HCO3-]+[CO
3
2-] determined to CO
2 partial pressure
of 4.90x10⁻⁴ MPa and those calculated considering a CO
2
partial pressure of 0.35x10⁻⁴ MPa. For this reason, the
assumption that the CO2 partial pressure is atmospheric
could be not very realistic for a saturation paste if it contains high quantities of organic matter.
Moreover, below 0.2-m depth, where this degraded soil has presumably very low quantities of
organic matter, the CO2 partial pressures had been
calculated to be between 0.4 and 2.3 times the
atmospheric CO2 partial pressure (Table 4). In these
cases, the differences in [Ca2+] and [HCO
3 -]+[CO
3 2-]
obtained as a function of their respective CO2partial
pressures (Table 4) and those calculated assuming a P
of 0.35x10⁻⁴ MPa (Table 3) were, respectively, between 0
and 0.03 mmolc+ L-1 and between 0 and 0.04 mmol
c+ L -1. For this reason, when the quantity of organic matter in
the sample is low, the assumption that the CO2 partial
pressure is atmospheric can produce realistic results for a saturation paste as it is reacted with water.
Results obtained by our model for a system
that accumulates alkaline sodium salts and CaCO3,
with a hypothetical KG of 0.01475 (mmol L-1)-1/2, show
that all pH values were above 8.3 (Tables 5 and 6). Sodium salts undergoing alkaline hydrolysis (expressed
as [HCO3-]+[CO
3
2-]-[Ca+Mg]) and pH values were
enhanced by increasing ESP; but the values were higher at [SO42-]=1 mmol
c+ L
-1 (relatively low ionic strength, Table 5) as compared with the [SO42-]>1 mmol
c+ L
-1 (Table 6). High pH values are possible in soils that accumulate alkaline sodium salts (bicarbonates and carbonates) and
CaCO3, even in soils with relatively low ionic strength,
without considering the hypothesis of the “hydrolysis of exchangeable sodium”.
Tables 5 and 6 show an inversion in the [HCO3-]/ [CO32-] ratio (values of less than 1) at ESP values above 60%. These results could be used as a partial explanation of the genesis of sodic soils. The following reactions are
proposed to represent the dominant processes of sodification in soils as a function of ESP:
2 NaHCO3 + CaX2 ——> 2NaX + CaCO3 + CO2 +
H2O (ESP<60%) (25)
Na2CO3 + CaX2 ——> 2NaX + CaCO3 (ESP>60%)
(26) According to reaction (25), at ESP values between 10% and 60%, an accumulation of sodium
bicarbonate, and production of CO2 and CaCO3 would
characterize the sodification process. Consequently, relatively lower pH values would be obtained. On the
other hand, reaction (26) shows that Na2CO3 would
dominate in the soil solution at ESPs higher than 60%, and pH could reach values of 10 and even higher. Both reactions point out that the accumulation of alkaline sodium salts in soils cause the increase of exchangeable sodium
and the production of CaCO3. Both processes have been
reported in alkali sodic soils (Gupta et al., 1985; Pla-Sentís, 1985; Gupta & Abrol, 1990; Guerrero-Alves, 1998).
Table 4 - Ion concentrations and partial pressures of CO2 (P) in the Pantanal soil, at 0.1 m depth intervals, predicted by using the proposed model (equations from 20 to 24) and forced to adjust simultaneously the experimental data for [Na+]
and pH in Table 1.
Note: Gapon selectivity coefficients (kg) were also calculated in Table 4. Their values are indentical to kg values reported in Table 3.
Depth C a2+ HCO
3- CO32 - HCO3-+CO32- (Px104)
-- m -- --- mmolc+ L-1 --- MPa
Received July 11, 2001
For ESP>40%, the predicted concentration of alkaline sodium salts ([HCO3-]+[CO
3
2-]–[Ca+Mg]) [Tables 5 and 6] are considerably higher than the experimental concentrations of alkaline sodium salts in the Pantanal soil (Table 1). However, these predicted values were considerably lower than the solubilities of sodium
carbonate (4038 mmol L-1) and bicarbonate (1143 mmol
L-1) in pure water (Welcher & Hahn, 1969). In these
simulations, increasing KG to values higher than 0.01475 (mmol L-1)-1/2 (no reported here), it was possible to obtain lower concentrations of alkaline sodium salts and pH for a given ESP. According to our simulation model, an exchanger of ions seems to cause a depressive effect on solubilities of alkaline sodium salts, especially at low ESP and KG>0.01475 (mmol L-1)-1/2. Therefore, under these conditions, sodium carbonate and bicarbonate would be less soluble in the soil solution than in pure water. However, the solubilities increase at higher ESP values, resulting in higher pH values. From this, it appears that KG values of 0.01475 (mmol L-1)-1/2, used to generate our data in Tables 5 and 6, could not be adequate to simulate the behavior of the
Table 6 - Constituents of Na2CO3(NaHCO3)-CaCO3-CO2 -exchanger system, for different exchangeable sodium percentages (ESP), obtained from the application of the proposed model (equations from 20 to 24): PCO2 = 0.35x10⁻⁴ MPa, KG =
0.01475 (mmol L-1)–1/2, [Cl-] = 4 mmol
c+ L-1, [Mg2+]
=1 mmolc+ L-1.
alkali sodic soil Pantanal under conditions of low ionic strength and high ESP.
CONCLUSIONS
KG values determined by our model seem to show a high selectivity of the Pantanal soil for the sodium ion. This could be due to the fact that the accumulation of alkaline sodium salts severely restricts the presence of divalent cations in solution, which are mainly precipitated as calcium carbonates. KG values obtained for the Pantanal soil and the results obtained in the simulation of the hypothetical system are suggesting that a KG value higher than 0.01475 (mmol L-1)-1/2 should be used to adequately simulate the behavior of the Pantanal soil at low ionic strength and high ESP values.
REFERENCES
BOHN, H.L; MCNEAL, B.L.; O’CONNOR, G.E. Soil chemistry. New York: John Wiley & Sons, 1979. 329p.
BROWN, D.S; MILLER, R.J. Bentonite instability and its influence on activation energy measurements. Proceedings of Soil Science Society of America, v.35, p.705-710, 1971.
CRUZ-ROMERO, G.; COLEMAN, N.T. Reactions responsible for high pH of Na-saturated soils and clays. Journal of Soil Science, v.26, p.169-175, 1975.
GUERRERO-ALVES, J. Génesis de suelos sódicos en diferentes ambientes edafoclimáticos de Venezuela. Maracay, 1998. 237p. Tesis (Doctoral) -Facultad de Agronomía, Universidad Central de Venezuela.
GUPTA, R.K.; SINGH, C.P.; ABROL, I.P. Determining cation exchange capacity and exchangeable sodium in alkali soils. Soil Science, v.139, p.326-332,
1985.
GUPTA, R.K.; ABROL, I.P. Reclamation and management of alkali soils. Indian Journal of Agricultural Science, v.60, p.1-16, 1990.
KOVDA, V.A.; SAMOILOVA, E.M. Some problems of soda salinity. Agrokémia és Talajtan, v.18, p.21-36, 1969.
MASHHADY, A.S.; ROWELL, D.L. Soil alkalinity. I. Equilibria and alkalinity development. Journal of Soil Science, v.29, p.67-75, 1978.
NAKAYAMA, F.S. Hydrolysis of CaCO3, Na2CO3 y NaHCO3 and their combinations in the presence and absence of external CO2 source. Soil Science, v.109, p.391-398, 1970.
PETERS, D.G.; HAYES, J.M.; HIEFTJE, G.M. Chemical separations and measurements: theory and practice of analytical chemistry. Philadelphia: W.B. Saunders, 1974. 749p.
PLA SENTÍS, I. Metodología de laboratorio recomendada para el diagnóstico de salinidad y alcalinidad en suelos, aguas, y plantas.
Maracay: Universidad Central de Venezuela, Facultad de Agronomía, Instituto de Edafología, 1969. 103p.
PLA SENTÍS, I. Origen, distribución y diagnóstico de suelos afectados por sales en Venezuela. Revista de la Facultad de Agronomía, v.14, p.125-150, 1985. PORTA, J.; LÓPEZ-ACEVEDO, M.; ROQUERO, C. Edafología: para la
agricultura y el medio ambiente. Madrid: Ediciones Mundi-Prensa, 1999. 849p. ROBBINS, C.W. Sample preparation for determining ions in dark colored sodic soil extracts. Soil Science Society of America Journal, v.53, p.721-725, 1989.
SHAINBERG, I. Rate and mechanism of Na-montmorillonite hydrolysis in suspensions. Proceedings of Soil Science Society of America, v.37, p.689-694, 1973.
SKOOG, D.A.; WEST, D.M. Análisis instrumental. México: Nueva Editorial Interamericana, 1975. 718p.
SOIL SURVEY STAFF. Keys to soil taxonomy. Washington: USDA, Natural
Resources Conservation Service, 1998. 326p.
SZABOLCS, I. The influence of sodium carbonate on soil forming processes and soil properties. Agrokémia és Talajtan, v.18, p.37-68, 1969. SZABOLCS, I. The global problems of salt-affected soils. Acta Agronomica
Hungarica, v.36, p.159-172, 1987.
UNITED STATES SALINITY LABORATORY STAFF. Diagnosis and improvement of saline and alkali soils. Washington: USDA, 1954. (Agriculture Handbook, 60).
WELCHER, F.J.; HAHN, R.B. Semimicro qualitative analysis. New York: Van Nostrand Reinhold, 1969. 497p.
Table 5 - Constituents of Na2CO3(NaHCO3)-CaCO3-CO2 -exchanger system, for different exchangeable sodium percentages (ESP), obtained from the application of the proposed model (equations from 20 to 24): PCO2=0.35x10⁻⁴ MPa, KG =
0.01475 (mmol L-1) –1/2, [Cl-] = 4 mmol c+ L
-1,
[SO42-] = [Mg2+] =1 mmol c+ L-1.
*B/C = [HCO3-]/[CO32-]
ESP [HCO3-] [CO
32-] [Na+] [Ca2+] B/C* pH
% --- mmolc+ L-1
---10 1.83 0.07 5.33 0.58 25.40 8.50 20 6.93 1.09 11.98 0.05 6.37 9.07 30 12.69 3.85 20.55 0.02 3.30 9.32 40 18.91 9.02 31.96 0.01 2.10 9.48 50 25.94 17.96 47.94 0.01 1.44 9.61 60 34.31 33.53 71.91 0.00 1.02 9.72 70 45.11 62.66 111.86 0.00 0.72 9.82 80 60.78 126.85 191.76 0.00 0.48 9.94 90 89.34 337.90 431.45 0.00 0.26 10.11
ESP [HCO3-] [CO
32-] [SO42-] [Na+] [Ca2+] B/C* pH
% --- mmolc+ L-1
![Table 3 - Ion concentrations, pH and Gapon selectivity coefficients (KG) of the Pantanal soil, at 0.1-m depth intervals, predicted by using the proposed model (equations from 20 to 24) and experimental data from Table 1 ([Mg 2+ ] = [Ca+Mg], PCO 2 = 0.35x1](https://thumb-eu.123doks.com/thumbv2/123dok_br/15856818.661798/6.918.77.830.152.601/concentrations-selectivity-coefficients-pantanal-intervals-predicted-equations-experimental.webp)
![Table 4 shows for different depths in the Pantanal soil, both predicted ion concentrations and partial pressures of CO 2 by using the proposed model (equations from 20 to 24) and forced to adjust simultaneously the experimental data for [Na + ] and pH in](https://thumb-eu.123doks.com/thumbv2/123dok_br/15856818.661798/7.918.477.838.596.1092/different-pantanal-predicted-concentrations-pressures-equations-simultaneously-experimental.webp)
