www.jped.com.br
ORIGINAL
ARTICLE
Association
of
uric
acid
levels
with
components
of
metabolic
syndrome
and
non-alcoholic
fatty
liver
disease
in
overweight
or
obese
children
and
adolescents
夽
Anajás
S.
Cardoso
a,
Nathalia
C.
Gonzaga
b,∗,
Carla
C.M.
Medeiros
c,
Danielle
F.
de
Carvalho
caPhDStudentinNursing.UniversidadeFederaldaParaíba(UFPB),JoãoPessoa,PB,Brazil bPhDStudentinNursing.UniversidadeFederaldoCeará(UFC),Fortaleza,CE,Brazil
cPhDinChildandAdolescentHealth.Professors,ProgramadePós-graduac¸ãoemSaúdePública,UEPB,CampinaGrande,PB,
Brazil
Received6September2012;accepted27December2012 Availableonline19June2013
KEYWORDS Uricacid;
Metabolicsyndrome X;
Fattyliver; Cardiovascular diseases; Obesity
Abstract
Objective: Toinvestigatetheassociationbetweenserumuricacidconcentrationaccordingto
thepresenceorabsenceofnon-alcoholicfattyliverdisease(NAFLD)and/ormetabolicsyndrome (MS)inoverweightorobesechildrenandadolescents.
Methods: Thiswas a cross-sectional study conducted fromApril of2009to March of2010,
including129children andadolescentstreatedattheCenterfor ChildhoodObesity. Anthro-pometricdata,bloodpressuremeasurements,andlaboratorytestresultswereobtained,and NAFLDdiagnosiswasmadebyultrasound.ThediagnosisofMSwasmadeusingthecriteriaof theNationalCholesterolEducationProgram/AdultTreatmentPanelIII,adaptedtoagerange. Thechi-squaredtestororFisher’stestwereusedtoevaluatetheassociationofuricacidwith thegroups,witha95%confidenceinterval.One-wayanalysisofvariance(ANOVA)wasusedfor comparisonofmeans.Multiplelogisticregressionwasusedfor adjustmentofvariables.The datawereanalyzedwiththeStatisticalPackageforSocialSciences(SPSS),release17.
Results: Highlevelsofuricacidweresignificantlyassociatedwithadolescence,MS,and
sys-tolicbloodpressure.Thehighestquartileofuricacidshowedsignificantlyhighervaluesofbody massindex,waistcircumference,systolicbloodpressure,diastolicbloodpressure, triglyceri-des,totalcholesterol,andhomeostaticmodelassessmentindex(HOMA-IR),andlowermean valuesofHDLcholesterol.Inthefinalmodel,onlyagerangeandthepresenceofMSremained associatedwithuricacidlevels.
Conclusions: HighlevelsofuricacidwereassociatedwithMSandadolescence,whichwasnot
observedwithNAFLD.
©2013SociedadeBrasileiradePediatria.PublishedbyElsevierEditoraLtda.
夽 Pleasecitethisarticleas:CardosoAS,GonzagaNC,MedeirosCC,deCarvalhoDF.Associationofuricacidlevelswithcomponentsof metabolicsyndromeandnon-alcoholicfattyliverdiseaseinoverweightorobesechildrenandadolescents.JPediatr(RioJ).2013;89:412---8.
∗Correspondingauthor.
E-mail:[email protected](N.C.Gonzaga).
0021-7557©2013SociedadeBrasileiradePediatria.PublishedbyElsevierEditoraLtda.
http://dx.doi.org/10.1016/j.jped.2012.12.008
Este é um artigo Open Access sob a licença de CC BY-NC-ND
PALAVRAS-CHAVE Ácidoúrico; SíndromeX metabólica; Fígadogorduroso; Doenc¸as
cardiovasculares; Obesidade
Relac¸ãoentreácidoúricoeoscomponentesdasíndromemetabólicaeesteatose hepáticanãoalcoólicaemcrianc¸aseadolescentescomsobrepesoouobesidade
Resumo
Objetivo: Verificar arelac¸ão entrea concentrac¸ão de ácido úrico séricode acordo com a
presenc¸aounãodeesteatosehepáticanãoalcoólicae/ousíndromemetabólica(SM)emcrianc¸as eadolescentescomsobrepesoouobesidade.
Métodos: Estudotransversal desenvolvidonoperíododeabril/2009amarc¸o/2010,incluindo
129 crianc¸as e adolescentes atendidos no Centro de Obesidade Infantil. Foi realizada antropometria,aferic¸ãodapressãoarterial,dosagemdosexameslaboratoriaiseodiagnóstico deesteatosehepáticaporexameultrassonográfico.ParaodiagnósticodeSM,foramutilizados oscritériosdaNationalCholesterolEducationProgram/AdultTreatmentPanelIIIadaptados parafaixaetária.Paraavaliac¸ãodaassociac¸ãodoácidoúricocomosgrupos,foirealizado o testedoQui-quadradoouFisher,adotando-seointervalodeconfianc¸ade95%.Paracomparac¸ão demédias,utilizou-seoANOVAOneWay.Paraoajustedasvariáveisfoiutilizadaaregressão logísticamúltipla.OsdadosforamprocessadosnoSPSSversão17.
Resultados: Níveiselevadosdeácido úricoassociaram-se significativamenteàadolescência,
SMepressãoarterialsistólica.Omaiorquartildeácidoúricoapresentouvaloresmédios signi-ficativamentemaiselevadosdeíndicedemassacorpórea,circunferênciaabdominal,pressão arterialsistólica,pressãoarterialdiastólica,triglicerídeos,colesteroltotaleHOMA-IR,emenor médiadocolesterolHDL.Nomodelofinalsópermaneceramassociadasaosníveisdeácidoúrico afaixaetáriaeapresenc¸adesíndromemetabólica.
Conclusões: Níveiselevadosdeácido úricoestiveramassociados àsíndromemetabólica eà
adolescência,oquenãofoiobservadocomaesteatosehepática.
©2013SociedadeBrasileiradePediatria.PublicadoporElsevierEditoraLtda.
Introduction
Uric acid at normal plasma levels has been known to exertaneuroprotectiveeffect,byactingasafree-radical scavenger;however,severalobservationalstudieshave indi-cated that high levels of serum uric acid are associated withthe riskof cardiovascular diseaseandmay beuseful intheassessmentofindividualcardiovascularrisk. Further-more,highuricacidlevelshavealsobeenassociatedwith insulinresistance(IR),diabetesmellitustype2(DM2),and metabolicsyndrome(MS).1,2
Among these cardiometabolicalterations, MS hasbeen stressed,asitrepresentsaset ofrisk factors,which con-sists of alterations in the metabolism of carbohydrates --- hyperinsulinemia, IR, glucose intolerance or DM2, lipid metabolismalterations(increasedtriglycerides(TG)and/or decreased cholesterol bound to high-density lipoprotein [HDL]),abdominalobesity,andhighbloodpressure.3
The hepaticexpressionofMSis nonalcoholicfatty liver disease (NAFLD), which is characterizedby fat deposition in the hepatocytes of patients with little or no alcohol ingestion.4 In a study of 102 adults diagnosed with dia-betes,itwasobservedthatalmosthalfNAFLD,andtheyalso presented higherBMIand uricacid levelsthanindividuals withoutNAFLD.5
Despite evidence that uric acid is considered a car-diometabolic risk factor,6 there is no reference in the literaturetotheassociationbetweenthisbiochemical vari-able and steatosis in the pediatric population, especially amongobeseoroverweightchildrenandadolescents.Thus, this study aimed to investigate the association between
serumuricacidlevelsaccordingtothepresenceorabsence of NAFLDand/or MS in overweight or obese children and adolescents.
Methods
This was a cross-sectional study with a quantitative approach performed between July of 2009 and March of 2010, aspart of a larger project entitled‘‘Prevalence of cardiometabolicriskfactorsinoverweightorobesechildren andadolescents’’,approvedbytheEthicsResearch Commit-teeoftheUniversidadeEstadualdaParaíba,underprocess No.0040.0.133.000-08.
Aconveniencesamplewasused,consistingofoverweight orobesechildrenandadolescentsagedbetween2and18 yearswhowerereferredbyhealthteamstotheChildhood ObesityCenter(CentrodeObesidadeInfantil---COI), imple-mentedattheInstitutodeSaúdeElpídiodeAlmeida(ISEA), located in Campina Grande, state of Paraíba, Brazil, The enrollmentwascarriedoutattheBasicHealthUnitsunder thesupervisionofthehealthdepartmentofthat municipal-ity.The COIconsistsofresearchersandamultidisciplinary team comprising endocrinologists, nutritionists, psychol-ogists, nurses, pharmacists, social workers, and physical trainers.
thatinterfered withglucosemetabolism orlipids, suchas steroids,wereexcluded.Twoindividualswereexcludeddue tocorticosteroiduse;thus,atotalof129individualswere evaluated.
Parents or guardians who agreed to let their children participateinthestudy signedaninformedconsent,after beinginformedofthegoals,methods,andprocedurestobe followed.
Data on socioeconomic status and personal and fam-ily history were obtained; anthropometric measurements wereassessedby previouslytrained students,and labora-tory testing and ultrasound examination were scheduled. Twomeasurementsofanthropometricdata(weight,height, andwaistcircumference)wereperformedonthesameday, andthemeanvaluewasusedintheanalysis.Nutritional sta-tuswasclassifiedusingtheWorldHealthOrganization(WHO) Anthro(for childrenyoungerthan5 years)andAnthroPlus (≥5years)software,obtainingthez-scorerelatedtobody massindex(BMI)forage.
For children younger than 5 years, the use of the international reference by the WHO published in 2006 is recommended,classifyingthem as: at risk for overweight (zscore+1<BMI≤zscore+2),overweight(zscore+2<BMI
≤z score+3), andobesity (BMI>z score+3).Forchildren aged5 to19 years,the useofthereferencepublishedby theWHO in2007isrecommended,consideringthe follow-ingcategories:overweight(zscore+1<BMI≤z score+2), obesity(zscore+2<BMI≤z score+3),andsevereobesity (BMI>zscore+3).7
Forstatisticalanalysis,thenutritionalstatuswas cate-gorizedintotwogroups,consideringchildrenyoungerthan 5yearstobeoverweightwhenzscore+1<BMI≤zscore+3 andobese,whenBMI>zscore+3;thoseaged5yearsorolder wereconsideredtobeoverweightwhenzscore+1<BMI<z score+2andobese,whenBMI≥zscore+2.
The waist circumference (WC) wasmeasured using an inelastictapeatmidpointbetween thesuperiorborderof theiliaccrestandtheinferior costalmargin. Values>90th
percentilewereconsidered increased.However,girls with WC≥88cmandboyswithWC≥102cmwereconsideredas havingalteredresultsregardlessofthepercentile.8
Three blood pressure measurements were performed with a two-minute interval between them, according to the method established in the V Brazilian guidelines on hypertension.9Themeanofthelasttwomeasurementswas considered asthe systolic(SBP) anddiastolic (DBP) blood pressurevalues.
The diagnosis of steatosis wasbased on the results of ultrasonographyof theupper abdomen,performed at the Hospital Universitário Alcides Carneiro (HUAC), by a sin-gleradiologistblinded toclinical dataandlaboratory test results.The equipmentusedwasaMedisonSonoAce Prime 8000EX,withamultifrequencyconvextransducerof5MHz. Alterations in liver parenchyma were classified as nor-mal, mild, moderate, and severe diffuse steatosis.10 This classificationusesasparameters theliver echogenicity in comparison with the renal cortex, the echo penetration intensityintheliverparenchyma,thediaphragmvisibility, andtheechogenicityofthelivervascularstructures.11
Blood collection wasperformed after a 10 to 12 hour fast,attheClinicalAnalysisLaboratoryoftheUniversidade EstadualdaParaíba(LAC/UEPB).
Themeasurementsofuricacid,HDL-C,TG,andglucose were performed bythe enzymaticcolorimetricmethod in automated equipment(BioSystems 310 model), according totherecommendationsoftheLabtest®kitmanufacturer. Insulinwasmeasuredbychemiluminescenceinautomated equipment (IMMULITE 1000 - SIEMENS®). Hyperuricemia wasconsideredwithvalues >5.5mg/dL.12Thehomeostatic modelassessmentindex(HOMA-IR)wasusedasthecriterion forthediagnosisofIR.ThecutoffusedwasHOMA-IR≥2.5.13 The diagnosis of MS was attained using the criteria recommended by the National Cholesterol Education Pro-gram/AdultTreatmentPanelIII14adaptedtotheagegroup, whichconsidersasMSthepresenceofatleastthreeofthe followingitems:WC≥90th percentileforage,gender,and
ethnicity;TG≥130mg/dLand/orHDL-C<45mg/dL,fasting glucose≥100mg/dL,SBPand/orDBP>90th percentilefor
gender, height, and age. The cutoffs for TG, HDL-C, and fastingglucosefollowed thevaluesrecommendedin theI guideline for atherosclerosis prevention in childhood and adolescence.15
Thefollowing groups wereconsideredaccording tothe presenceand/or absenceofMSandNAFLD:G1 -presence ofMSandsteatosis;G2-presenceofMSwithoutsteatosis; G3-absenceofMSandpresenceofsteatosis;G4---absence ofMSandsteatosis.
The data were presented as proportions, means, and standard deviations (SD). After applying the Kolmogorov-Smirnoff test to assess for normality, the association of uric acid levels with gender, age range, ethnicity, nutri-tional status, WC, SBP, DBP, TG, fasting glucose, IR, MS, and hepatic steatosis was verified using the chi-squared or Fisher’sexact test, when necessary, witha 95% confi-dence interval (95% CI) and prevalence ratio (PR). One wayanalysisofvariance(ANOVA)wasusedforcomparison of the means of MScomponents according toquartiles of uricacidand,whennecessary,usingBonferroni’spost hoc test.
Multiplelogisticregressionwasusedforvariable adjust-ment, whose criterion for variable inclusion was the association with the dependent variable in the bivariate analysiswithp-value<0.20.Thevariableswereincludedin theregressionanalysisusingthe‘enter’method,according tothedecreasingvalueofoddsratio.TheHosmer-Lemeshow testwasusedasameasureofquality-of-fitforthelogistic regressionmodels,inwhichap-value≥0.05indicatesthat themodelisadjusted.
Allanalysesweretwo-tailedandwereperformedusing the Statistical Packagefor Social Sciences (SPSS),release 17.0(SPSSInc,Chicago,USA)withthesignificancelevelset at5%.
Results
The mean uric acid level found was 4.191mg/dL (±
SD=2.32). Hyperuricemia wasobserved in 12.4%(16/129) of assessed individuals, MSin 49.6% (64/129), and RIwas diagnosedin44.2%(57/129)ofthem.NAFLDwasdiagnosed in28.7%(37/129)ofchildrenandadolescents.
Lowlevels ofHDL-C wereobserved in85.3% (110/129) oftheassessedindividuals,and39.5%(51/129)had hyper-triglyceridemia.Hyperglycemiawasobserved inonly 0.8% (1/129)oftheassessedindividuals. SBPwashigh in34.1% (44/129)andDBPin64.3%(83/129)oftheindividuals.
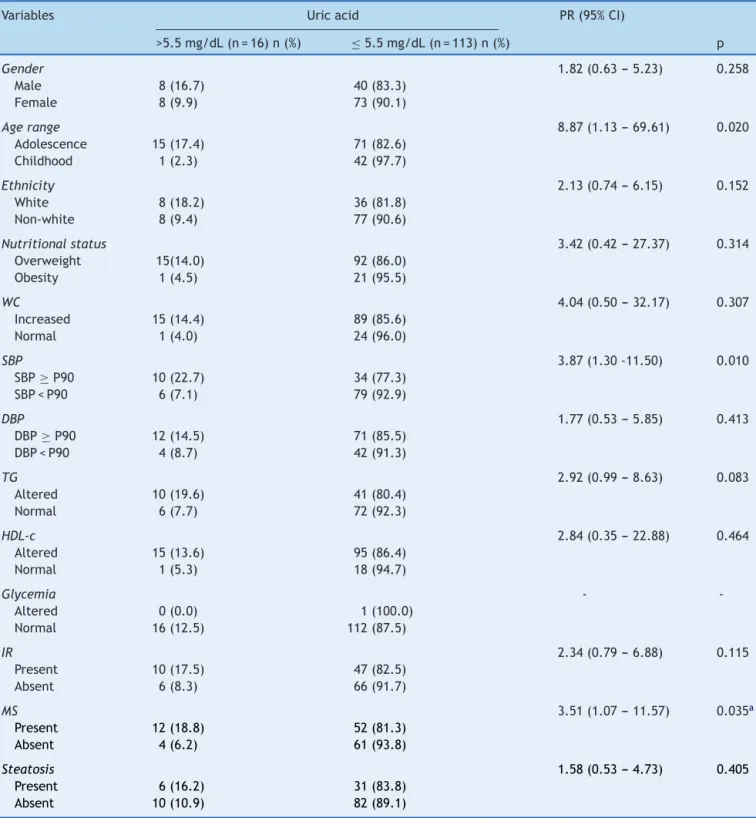
Table1 Social,anthropometric,clinicalandlaboratoryvariablesaccordingtoserumlevelsofuricacidin129overweightor obesechildrenandadolescents.CentrodeObesidadeInfantil,ISEA,CampinaGrande-PB,2009-2010.
Variables Uricacid PR(95%CI)
>5.5mg/dL(n=16)n(%) ≤5.5mg/dL(n=113)n(%) p
Gender 1.82(0.63---5.23) 0.258
Male 8(16.7) 40(83.3)
Female 8(9.9) 73(90.1)
Agerange 8.87(1.13---69.61) 0.020
Adolescence 15(17.4) 71(82.6)
Childhood 1(2.3) 42(97.7)
Ethnicity 2.13(0.74---6.15) 0.152
White 8(18.2) 36(81.8)
Non-white 8(9.4) 77(90.6)
Nutritionalstatus 3.42(0.42---27.37) 0.314
Overweight 15(14.0) 92(86.0)
Obesity 1(4.5) 21(95.5)
WC 4.04(0.50---32.17) 0.307
Increased 15(14.4) 89(85.6)
Normal 1(4.0) 24(96.0)
SBP 3.87(1.30-11.50) 0.010
SBP≥P90 10(22.7) 34(77.3) SBP<P90 6(7.1) 79(92.9)
DBP 1.77(0.53---5.85) 0.413
DBP≥P90 12(14.5) 71(85.5) DBP<P90 4(8.7) 42(91.3)
TG 2.92(0.99---8.63) 0.083
Altered 10(19.6) 41(80.4)
Normal 6(7.7) 72(92.3)
HDL-c 2.84(0.35---22.88) 0.464
Altered 15(13.6) 95(86.4)
Normal 1(5.3) 18(94.7)
Glycemia -
-Altered 0(0.0) 1(100.0)
Normal 16(12.5) 112(87.5)
IR 2.34(0.79---6.88) 0.115
Present 10(17.5) 47(82.5)
Absent 6(8.3) 66(91.7)
MS 3.51(1.07---11.57) 0.035a
Present 12(18.8) 52(81.3)
Absent 4(6.2) 61(93.8)
Steatosis 1.58(0.53---4.73) 0.405
Present 6(16.2) 31(83.8)
Absent 10(10.9) 82(89.1)
CI,confidenceinterval;DBP,diastolicbloodpressure;HDL-C,high-densitylipoprotein;IR,insulinresistance;MS,metabolicsyndrome; PR,prevalenceratio;SBP,systolicbloodpressure;TG,triglycerides;WC,waistcircumference.
Table2 MeanvaluesofBMI,bloodglucose,WC,SBP,DBPandHOMA-IRquartilesaccordingtouricacidof129overweightor obesechildrenandadolescents.CentrodeObesidadeInfantil,ISEA,CampinaGrande-PB,2009-2010.
Uricacid
Variables P1 <3.0n=30 P253.0-3.9n=32 P504.0-4.8n=32 P75≥4.9n=35 p Mean(SD) Mean(SD) Mean(SD) Mean(SD)
BMI 25.02(2.74) 26.66(4.25) 28.17(4.55) 30.33(4.32) 0.000a
WC 80.15(8.88) 81.77(12.25) 89.54(12.38) 93.12(12.52) 0.000b
SBP 103.20(10.51) 104.84(10.19) 110.53(11.34) 113.86(12.66) 0.001c
DBP 69.20(8.70) 68.91(7.15) 75.31(9.66) 75.69(11.86) 0.003d
TG 106.00(53.87) 117.59(54.94) 134.63(68.09) 165.40(77.28) 0.002e
HDL-c 38.50(11.59) 39.13(7.54) 38.53(7.56) 33.23(6.49) 0.014f
HOMA-IR 1.81(1.09) 2.18(1.62) 2.52(1.48) 3.39(1.76) 0.000g
Glycemia 78.90(7.75) 80.56(7.67) 79.75(6.75) 82.69(6.54) 0.172
BMI,bodymassindex;DBP,diastolicbloodpressure;HDL-C,high-densitylipoprotein;HOMA-IR,homeostaticmodelassessmentindex; SBP,systolicbloodpressure;SD,standarddeviation;TG,triglycerides;WC,waistcircumference.
aDifferencesbetweenquartile1with3and4,andbetween2with4. b Betweenquartile1with3and4,andbetween2with3and4. c Differencebetweenquartile1and4,and2and4.
d Betweenquartile1and4,and2and4.
e Differencebetweenquartile1and4and2and4. f Betweenquartile2with4.
gDifferencebetweenquartile1and4.
Table 1 shows that higher values of uric acid were significantly associated with adolescence, altered SBP, hypertriglyceridemia,andMS.Nosignificancewasobserved whencorrelating levels of uric acid withthe presence of steatosis.The chance of havinghyperuricemia washigher inthe following groups: adolescence(PR=8.87), high SBP (PR=3.87),andthosewithMS(PR=3.51).
Thequartilesofuricacidobservedwere:<3.0;3.0-3.9; 4.0-4.8;and≥ 4.9.Table 2 showsthat the group consist-ingofindividualsfromthe4thquartile(percentile>75thfor
uricacidvalues)showedsignificantlyhighervaluesofBMI, WC,SBP,DBP,TG,andHOMA-IR,andlowermeanofHDL-C (Table2).
Therewasnoassociationbetweenlevelsofuricacidand thecombinedgroupsaccordingtothepresence/absenceof MSandnonalcoholichepaticsteatosis(Table3).
Through multiple logistic regression analysis, it was observed that in the final model, only age and the presence of MS remained associated with uric acid lev-els. It was observed that, among adolescents, the odds of having increased uric acid levels was approximately nine times higher than among children; when compared with patients with MS, this probability was 3.7 times greater. As demonstrated by the results of the Hos-mer and Lemeshow test, the model showed a good fit (Table4).
Table3 Uricacidvaluesaccordingtothepresenceand/orabsenceofmetabolicsyndromeandliversteatosisin129overweight orobesechildrenandadolescents.CentrodeObesidadeInfantil,ISEA,CampinaGrande-PB,2009-2010.
Uricacid
Variables Mean(mg/dL)±SD 95%CI
PresenceofMSandsteatosis 4.5±1.64 3.64-5.40
PresenceofMSandabsenceofsteatosis 4.4±1.79 3.87-4.91 AbsenceofMSandpresenceofsteatosis 4.7±4.62 2.58-6.80
AbsenceofMSandsteatosis 3.6±1.05 3.29-3.92
CI,confidenceinterval;MS,metabolicsyndrome;SD,standarddeviation. p=0.220.
Table4 Crudeandadjustedoddsratio(95%confidenceinterval)ofalterationsinuricacidin129overweightorobesechildren andadolescents.CentrodeObesidadeInfantil,ISEA,CampinaGrande-PB,2009---2010.
Parameter Variables Crude
OR
Adjusted OR
Adjusted p-value(95%CI)
p-valueHosmer
andLemeshow
Discussion
Serum uric acid is the primary end product of purine metabolisminhumans,anditslevelsarestrictlycontrolled bythebalancebetweenproductionandexcretion.16Inthis study,highlevelsofuricacidwereassociatedwith adoles-cenceandMS.Itisnoteworthythattherewasnoassociation betweenincreasedlevelsofuricacidwiththediagnosisof overweightandobesityandwiththepresenceofNAFLD.
Inthisstudy,theprevalenceofMSwashigherthanthat found byother authorswhoevaluatedobesechildren and adolescents,17,18andconfirmspreviousresultsfromasample ofhypertensiveadultsfromCuiabá,stateofMatoGrosso,in whichtheprevalenceofhighlevelsofuricacidwas signifi-cantlyhigherinpatientswithMS.19
The evidencethat explainsthe association ofuric acid withMSisbasedontwomechanisms.The firstmechanism isrelatedtothefactthatglucoseuptakeinskeletal mus-cle partially depends on the increase in insulin-mediated blood flow, stimulating the release of nitric oxide from endothelialcells.ComponentsofMSdevelopedinmicewith endothelial nitric oxide synthesis. The second mechanism is relatedtothe factthaturic acidinduces oxidative and inflammatoryalterationsinadipocytes,sincexanthine oxi-doreductase (the enzyme that generates uric acid from xanthine) is expressedin adipocytes andis criticalto the adipogenesisprocess.20
Pacifico etal.,21 inastudy performedinItalytoverify theassociationofhyperuricemiawithMSandatherosclerosis inobesechildrenandadolescents,concludedthatpatients withhighuricacidlevelshadahigherincidenceofcarotid atherosclerosis as demonstrated by the thickening of the carotidintima-media,assessedbyDopplerultrasonography ofthisregion.
It was observed that individuals with high SBP were approximatelyfourtimesmorelikelytohavehyperuricemia; abiologicalexplanationforthisfactissupportedbyastudy performed in an animal model with rats, which demon-strated that after induction of hyperuricemia there was developmentofhypertension,probablyduetoreductionin nitricoxideinrenalmaculadensaandbydirectstimulation oftherenin-angiotensinsystem,asbothmechanismscause vasoconstrictionandthereforeincreasebloodpressure.22
Regarding the variables of lipid metabolism an asso-ciation between uric acid levels and the means of TG and HDL (inversely associated with the latter) has been demonstrated,1,23 confirming the findings of the present study.
Thefindingofhyperglycemiainthisagegroupisunusual, asthemorefrequentmanifestationofglucosemetabolism is IR, which is a compensatory mechanism, while glucose toleranceremainsnormal.24
Although no association with hepatic steatosis was observed in this sample, recent studies have described a significantassociationbetweenhighlevelsofuricacidand NAFLD, representing an independent risk factor for liver disease.25---27
Themostplausibleexplanationforthisassociation,which hasbeeninferredfromthecurrentunderstandingofNAFLD progression, wouldbethe‘‘two-hit’’theory. Accordingto this theory, the accumulation of fat in the liver is the
first ‘‘hit’’, which makes the hepatocytes more vulnera-bletofurtherdamageduetocertaintriggers, suchasIR, excessinflammation,alcohol consumption,andobesity.In thisprocess, IR plays a central rolein the vicious circle, whichpromoteslipolysisoftheperipheraladiposetissueand increasestheinfluxoffreefattyacidsintotheliver.ThisIR leadstohyperinsulinemia,whichincreasesthesynthesisof uricacidanddecreasesitsrenalexcretion.24
Oxidative stress appears to be involved in the ‘‘hit’’ process,whichpromoteslipidperoxidationandthe inflam-matoryresponse.Uricacidreflectstherateofcellrenewal, whichinitselfcanbeapart oftheinflammatoryprocess, making it a pro-inflammatory factor. Uric acid increases interleukin (IL)-6 and tumor necrosis factor alpha (TNF-␣) levels.Thus, high levelsof uric acid in blood are due to oxidative stress that occurs in response to metabolic disorders.28
AstudybyRobertsetal.29 demonstratedthaturicacid clearanceintheobesegroupwaslowerthaninthecontrol group, suggesting that hyperuricemia in the obese popu-lation would be mainly attributed to a decrease in the clearanceofuricacid,ratherthantoanoverproductionof urates.
The method usedtodiagnose NAFLD wasconsidered a limitation of the present study, as the gold standard is biopsy,aninvasiveandexpensivetechnique.Thus,the ultra-soundtechniquewaschosen,whichhasbeenwidelyusedin publichealthstudiesduetoitseasyaccessibility,safety,and excellentsensitivity, especiallywhenevaluating the pedi-atricpopulation.
In conclusion, high levels of uric acid were associated with MS and adolescence, which was not observed with NAFLD.Thepossibilityofcardiovascularcomplicationsdoes notdependonaparticularfactor,ratherontheconcomitant presence of individual characteristics capable of increas-ingthispossibility---symptomaticornot---intargetorgans andassociated clinical complications. Thus, the inclusion ofmeasurementofuric acidlevelsin theassessment pro-tocolsfor obeseoroverweightchildrenandadolescentsis suggested,inordertoverifypossiblecomplicationsofearly cardiovascularalterations.
Funding
ThisstudyreceivedfinancialsupportfromtheFundac¸ãode Apoio à Pesquisa do Estado da Paraíba (FAPESQ) through Edict01/2008(FAPESQ/PB-MCT/CNPqTermo deConcessão No. 198/08) and from Universidade Estadual da Paraíba, throughProgramadeIncentivoàPós-Graduac¸ãoePesquisa (PROPESQ)Edict01/2008(PRPGP/UEPBTermodeConcessão No.98/2008).
Conflicts
of
interest
Theauthorsdeclarenoconflictsofinterest.
References
riscocardiovascularemumapopulac¸ãonãohospitalar.ArqBras Cardiol.2011;96:212---8.
2.SerpaNetoA,RossiFM,ValleLG,TeixeiraGK,RossiM.Relation ofuricacidwithcomponentsofmetabolicsyndromebeforeand afterRoux-en-Ygastricbypassinmorbidlyobesesubjects.Arq BrasEndocrinolMetab.2011;55:38---45.
3.GrundySM,BrewerB,CleemanJI,SmithJrSC,LenfantC. Def-initionofmetabolicsyndrome.Circulation.2004;109:433---8.
4.HwangIC,SuhSY,SuhAR, AhnHY.Therelationshipbetween normalserumuricacidandnonalcoholicfattyliverdisease.J KoreanMedSci.2011;26:386---91.
5.FerreiraVS, PernambucoRB,Lopes EP, MoraisCN, Rodrigues MC,ArrudaMJ,etal.Frequencyandriskfactorsassociatedwith non-alcoholicfattyliverdiseaseinpatientswithtype2diabetes mellitus.ArqBrasEndocrinolMetab.2010;54:362---8.
6.ChenLY,ZhuWH, ChenZW,DaiHL, RenJJ,ChenJA, etal. Relationshipbetweenhyperuricemiaandmetabolicsyndrome. JZhejiangUnivSciB.2007;8:593---8.
7.Brasil, Ministério da Saúde. Sistema de Vigilância Ali-mentar e Nutricional (SISVAN). Classificac¸ão do estado nutricional. Jun 2009 [cited 11 Dec 2012]. Available from: 189.28.128.100/nutric¸ão/docs/geral/sisvannormatecnica criancas.pdf.
8.International DiabetesFederation(IDF). Worldwidedefinition of metabolic syndrome [cited 24Oct 2010].Available from:
www.idf.org/home/index.cfm?node=1429
9.Sociedade Brasileira de Cardiologia (SBC). V diretrizes
brasileirasdehipertensãoarterial.2006.
10.CerriGG,OliveiraIRSde.Ultra-sonografiaabdominal.2nded. Revinter:RiodeJaneiro;2008.
11.SaverymuttuSH,JosephAE,MaxwellJD.Ultrasoundscanning inthedetectionofhepaticfibrosisandsteatosis.BrMedJ(Clin ResEd).1986;292:13---5.
12.FeigDI,JonhsonRJ.Hyperuricemiainchildhoodprimary hyper-tension.Hypertension.2003;42:247---52.
13.Madeira IR, Carvalho CN, Gazzola FM, de Matos HJ, Borges MA,BordalloMA.PontodecortedoíndiceHomeostaticModel AssessmentforInsulinResistance(HOMA-IR)avaliadopelacurva receiver operating characteristic (ROC) na detecc¸ão de sín-drome metabólica em crianc¸as pré-púberes com excesso de peso.ArqBrasEndocrinoleMetab.2008;52:1466---73.
14.Third Report of the NationalCholesterol Education Program (NCEP).Expertpanelondetection,evaluation,andtreatment ofhighbloodcholesterolinadults(adulttreatmentpanelIII) finalreport.Circulation.2002;106:3143---421.
15.GiulianoIC,CaramelliB,PellandaL,DuncaB,MattosS,Fonseca FH,SociedadeBrasileiradeCardiologia.IDiretrizdePrevenc¸ão
DaAteroscleroseNaInfânciaENaAdolescência.ArqBras Car-diol.2005;85:1---36.
16.Burns CM, Wartmann RL. Disorders of purine and pyrimi-dinemetabolism.In: LongoDL, FauciAS, KasperDL,Hauser SL, Jameson JL,Loscalzo J, editors.Harrison’s principles of internalmedicine. 18th ed.New York:McGrawHill;2012. p. 3181---7.
17.DuarteMA,SilvaGA.Hepaticsteatosisinobesechildrenand adolescents.JPediatr(RioJ).2011;87:150---6.
18.FerreiraAP,OliveiraCER,Franc¸aNM.Metabolicsyndromeand riskfactorsfor cardiovascular diseaseinobese children:the relationshipwithinsulinresistance (HOMA-IR).JPediatr (Rio J).2007;83:21---6.
19.Franco GP, Scala LC, Alves CJ, Franc¸a GV, Cassanelli T, Jardim PC. Síndrome metabólica em hipertensos de Cuiabá - MT: prevalência e fatores associados. Arq Bras Cardiol. 2009;92:472---8.
20.FeigDL,KangDH,JohnsonRJ.Uricacidandcardiovascularrisk. NEnglJMed.2008;359:1811---21.
21.PacificoL, CantisanV,Anania C,BonaiutoE,Martino F, Pas-coneR,etal.Serumuricacidanditsassociationwithmetabolic syndromeandcarotidatherosclerosisinobesechildren.EurJ Endocrinol.2009;160:45---52.
22.Choi HK, Ford ES. Prevalence of metabolic syndrome in individuals with hyperuricemia. Am J Med. 2007;120: 442---7.
23.ZoccaliC,MaioR,MallamaciF,SestiG,PerticoneF.Uricacid andendothelialdysfunctioninessentialhypertension.JAmSoc Nephrol.2006;17:1466---71.
24.QuinonesGalvanA,NataliA,BaldiS,FrascerraS,SannaG, Cio-ciaroD,etal.Effectofinsulinonuricacidexcretioninhumans. AmJPhysiol.1995;268:E1---5.
25.Lee K. Relationship between uricacid and hepatic steatosis amongKoreans.DiabetesMetab.2009;35:447---51.
26.LeeYJ,LeeHR,LeeJH,ShinYH,ShimJY.Associationbetween serumuricacidandnon-alcoholicfattyliverdiseaseinKorean adults.ClinChemLabMéd.2010;48:175---80.
27.LiY,XuC,YuC,XuL,MiaoM.Associationofserumuricacidlevel withnon-alcoholicfattyliverdisease:across-sectionalstudy.J Hepatol.2009;50:1029---34.
28.Amin KA, Kamel HH, Abd EltawabMA. The relation of high fatdiet,metabolic disturbancesandbrainoxidative dysfunc-tion: modulation by hydroxy citric acid. Lipids Health Dis. 2011;10:74.