Pharmaceutical Sciences
http://dx.doi.org/10.1590/s2175-97902017000300163
A
r
ti
*Correspondence: F. R. Lourenço. Departamento de Farmácia, Faculdade de Ciências Farmacêuticas, Universidade de São Paulo. Av. Prof. Lineu Prestes, 580 – Bloco 13, CEP 05508-000 - São Paulo, SP, Brasil. Tel.: 55-11-3091-3649. E-mail: [email protected]
Measurement uncertainty of dissolution test of acetaminophen
immediate release tablets using Monte Carlo simulations
Daniel Cancelli Romero, Felipe Rebello Lourenço*
Department of Pharmacy, Faculty of Pharmaceutical Sciences, Univerity of São Paulo, São Paulo, Brazil
Analytical results are widely used to assess batch-by-batch conformity, pharmaceutical equivalence, as well as in the development of drug products. Despite this, few papers describing the measurement uncertainty estimation associated with these results were found in the literature. Here, we described a simple procedure used for estimating measurement uncertainty associated with the dissolution test of
acetaminophen tablets. A fractionate factorial design was used to deine a mathematical model that explains
the amount of acetaminophen dissolved (%) as a function of time of dissolution (from 20 to 40 minutes), volume of dissolution media (from 800 to 1000 mL), pH of dissolution media (from 2.0 to 6.8), and rotation speed (from 40 to 60 rpm). Using Monte Carlo simulations, we estimated measurement uncertainty for dissolution test of acetaminophen tablets (95.2 ± 1.0%), with a 95% conidence level. Rotation speed was the most important source of uncertainty, contributing about 96.2% of overall uncertainty. Finally,
it is important to note that the uncertainty calculated in this paper relects the expected uncertainty to
the dissolution test, and does not consider variations in the content of acetaminophen.
Keywords: Acetaminophen tablets/dissolution test/measurement uncertainty. Monte Carlo simulation.
INTRODUCTION
Analytical results (ARs) are the fundamental basis for the development of industry and science in modern society. In scientiic research, ARs are used to compare experimental and control groups, test hypotheses, express relationships between variables, among other uses, in such a way that constitute the foundation for the discussion and conclusion of a particular study. In pharmaceutical industry, ARs are used to estimate income, assign a certain quality to materials, products or systems and compare them against certain internal or legal speciications or, among other applications. Usually, method validation, internal quality control protocols, arrangements of proficiency tests, and accreditation based on ISO/IEC 17025 are adopted as a kind of quality assurance system that allows assessment of accuracy and assertiveness of ARs (Ellison, Williams, 2012).
Despite this, an AR will never be able to be an absolute and perfect representation of the parameter
being measured. There will always be some uncertainty associated with the assertiveness of AR, even if all sources of uncertainty have been evaluated and corrected. This is because even the corrections applied have, by themselves, an associated uncertainty, not removing absolute uncertainty. Still, such a method of correction of uncertainty does not distinguish the variations from random efects, inherent to any experimental determination (Williams, 1998). Measurement uncertainty (MU) relects a range of values that can be assigned to an AR using a specific methodology. It is not possible to correct the experimental results found for a true result and absolute through the MU (Ellison, Williams, 2012).
the guide was well received by the analytical community (Williams, 1998). Five years later, EURACHEM/CITAC published the second version of the guide, emphasizing new concepts such as the integration of measuring uncertainty and in-house quality assurance procedures.
Although these approaches are diferent from those usually used in analytical chemistry (Barwick, Ellison, 1998, Ellison, Barwick, 1998b), the methodologies proposed in the GUM and EURACHEM/CITAC guides were applied in diferent areas such as, toxicological analysis (Eller et al., 2014), physical-chemical analysis (Leito et al., 2002), and quantitative analysis of pharmaceuticals by microbiological (Ghisleni et al., 2014a; Lourenço et al., 2007; Lourenço, 2013), spectrophotometric (Saviano, Lourenço, 2013) and chromatographic methods (Ghisleni
et al., 2014b; Saviano et al., 2015; Okamoto, Traple, Lourenço, 2013). Traple et al. (2014) published a review of MU applied in pharmaceutical analysis (Traple et al., 2014) describing the main sources of uncertainty such as sampling; instrumental efects; calibration mass and volumetric apparatus; purity of reagents and certified chemical substances; matrix efects and sample stability; analyst skills and training efects; environmental efects; random efects inherent to experimental determinations (Ellison, Williams, 2012).
In the third edition of the EURACHEM/CITAC guide, published in 2012 (Ellison, Williams, 2012), proficiency tests and application of Monte Carlo simulations were added as methods for the estimation of measurement uncertainty. The Monte Carlo simulation can be deined as randomly generating numbers by means of algorithms using probability distribution functions to obtain speciic results on the process or object under study (Barat et al., 2006a; Barat et al., 2006), and it has been used in solving problems in several areas of science, including the chemical and pharmaceutical industry (Hammersley, Handscomb, 1964; Meimaroglou, Kiparissides, 2014). The main idea of the Monte Carlo simulation is that the extensive repetition of a random sampling process allows for obtaining a sufficiently large and random sample space for a statistical inference (Kroese et al., 2014). This random sampling is essential for simulating real mathematically modeled systems, and it also applies this statistical methodology to the concept of variability and measurement uncertainty, because it allows that the results generated in the output varies within a range determined by the algorithm as if they were random error luctuations. The algorithms used in the Monte Carlo methods are simple, and have the ability to reduce the complexity of mathematically modeled systems (Kroese et al., 2014). This makes them applicable to, for example, processes of
dissolution of controlled release pharmaceuticals (Barat
et al., 2006b).
In the context of measurement uncertainty, the Monte Carlo simulation appeared first in 2008, as a document that describes the technique of propagation of distributions (JCGM, 2008). It is important to note that there are cases where the value of the measurement uncertainty will be relatively the same regardless of the methodology used. There are reports in the literature on the use of Monte Carlo simulation to ensure that the estimated probability functions for the factors of variability were indeed assertive, as a proof of concept of the classical methodology (Francisco, Saviano, Lourenço, 2014; Ghisleni et al., 2014b; Saviano, Madruga, Lourenço, 2015; Diaconu et al., 2015). The differences between the methodologies are evident in scenarios with a lack of normality, lack of linearity or even when a mathematical expression relating the results and factors of variability is too complex to be calculated, taking the simpliications, which lead to deviations in measurement of uncertainty. In these cases, the Monte Carlo simulation seems to be the most appropriate methodology to be used (Ellison, Williams, 2012).
The dissolution test is a procedure officially established in the pharmacopoeias of various countries, which expresses the amount of dissolved substance as a function of time, using a dissolution media with speciied pH, temperature and volume (ANVISA, 2010a; United States Pharmacopeia, 2012). Pharmacopeia monographs specify the device (basket, paddles or other) and appropriate conditions of dissolution test for each compound. The interests of the pharmaceutical community in the dissolution test began in the 1950s after observing that the disintegration proile of pharmaceutical dosage form did not explain the bioavailability proiles. Edwards was the first to report that if gastrointestinal absorption of a drug is fast, then the dissolution of pharmaceutical dosage form controls the bioavailability of the drug (Dokoumetzidis, Macheras, 2006), a preview of what would be proposed later by Amidon as the biopharmaceutical classiication system (BCS) (Amidon
et al., 1995). From the 1960s to the 1980s, the efects of
We found a few papers in the literature that described measurement uncertainty estimation associated with the dissolution test; however none of them assessed the contributions of dissolution test conditions of immediate release tablet dosage forms in the overall uncertainty. Here, we described a simple procedure used for estimating measurement uncertainty associated with the dissolution test of acetaminophen tablets based on Monte Carlo simulations.
MATERIAL AND METHODS
Immediate-release tablets and reference standard
Acetaminophen immediate-release tablets of 1000 mg were purchased from Brazilian suppliers. An acetaminophen reference standard was provided by the United States Pharmacopeia.
Instrumentation
Dissolution tests were performed using a VanKel system (VanKel VK 7010) comprising a bath with six vessels and meeting the physical and mechanical specifications required by the USP chapter <711> (United States Pharmacopeia, 2012). The instrument was mechanically calibrated using paddles. An analytical balance (Shimadzu, AUY220), a pHmeter (Gehaka, PG1800), a UV-visible spectrophotometer (Thermo Fisher Scientiic, Evolution 201, Waltham, MA, USA) were also used. Dissolution media, sample and reference standard solutions were prepared using calibrated volumetric lasks and pipettes.
Dissolution test
Dissolution tests were performed as described in Brazilian Pharmacopeia (ANVISA, 2010b) with some modifications to study how dissolution conditions affect the amount of acetaminophen dissolved. A 24-1
IV
fractionate factorial design with a central point was adopted to evaluate how time of dissolution (A, from 20 to 40 minutes), volume of dissolution media (B, from 800 to 1000 mL), pH of dissolution media (C, from 2.0 to 6.8), and rotation speed (D, from 40 to 60 rpm), afects the amount of acetaminophen dissolved. All dissolution tests were performed in 3 vessels (replicas) using paddle apparatuses. The amounts of acetaminophen dissolved were determined by employing UV absorption at the wavelength of maximum absorbance at about 243 nm on iltered portions of the diluted sample solution compared
with a reference standard solution, using dissolution medium as blank, as described in Brazilian pharmacopeia (ANVISA, 2010b). The mean amounts of acetaminophen dissolved and their relative standard deviations (RSD) were calculated.
Monte Carlo simulations
A mathematical regression model was adjusted to explain the amount of acetaminophen dissolved as a function of time of dissolution (A), volume of dissolution media (B), pH of dissolution media (C), and rotation speed (D). A combination of linear, quadratic, and interaction terms were selected to provide higher predictive power. A Box-Cox transformation was used to improve homoscedasticity and normal distribution of residual values.
Monte Carlo simulations were performed with 20,000 random values of time of dissolution (5,000 random values, normal distribution, mean = 30 minutes and standard deviation = 1 minute), volume of dissolution media (5,000 random values, normal distribution, mean = 900 mL and standard deviation = 5 mL), pH of dissolution media (5,000 random values, normal distribution, mean = 5.80 and standard deviation = 0.05), and rotation speed (5,000 random values, normal distribution, mean = 50 rpm and standard deviation = 2 rpm).
RESULTS AND DISCUSSION
According to BCS, highly soluble and highly permeable drugs formulated into rapidly dissolving products do not need to be subjected to a proile comparison. Usually, a one-point test is required to conirm a release of 85% or more of the active pharmaceutical ingredient (API) within 15 min. The impact of formulation composition in the dissolution is well established. However, slight changes in dissolution test conditions may impact the amount of API dissolved. Thus, this work focused on studying the efect of dissolution test conditions (such as time of dissolution, volume of dissolution media, pH of dissolution media, and rotation speed) in the amount of API dissolved and their contribution to overall uncertainty.
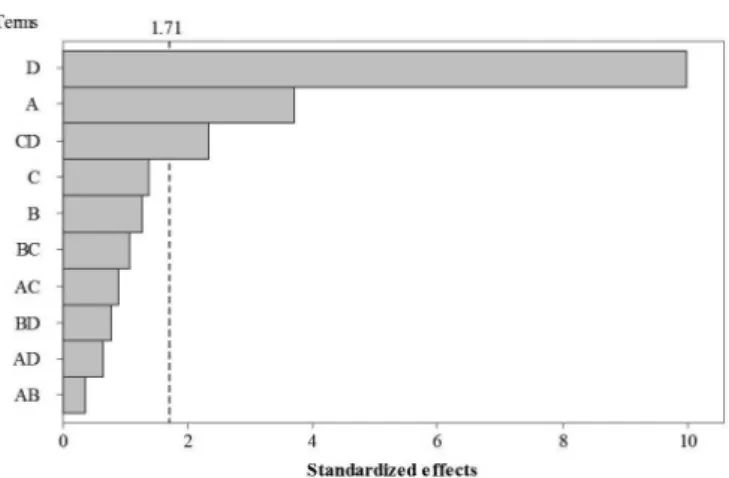
their interactions (AB, AC, AD, BC, BD, and CD) on the output. The statistical results are shown in a Pareto chart (Figure 1). The inputs above the critical value (1.71) showed statistically signiicant inluence on the dissolution. Thus, the rotation speed (D) was determined as the most significant factor, followed by the time of dissolution (A), and later by an interaction between pH and rotation speed (CD). The relative standard deviations (RSD) for all dissolution conditions were less than 3%.
The mathematical model obtained from the analysis of factorial experiment should be evaluated regarding its predictive power and its adjustment to the experimental results. The predictive coefficient of determination
(R2pred) is calculated to assess the predictive power of
the mathematical model. The R2pred is calculated from the
predicted residual error sum of squares (PRESS) statistic, and it provides a number that is directly proportional to the capacity of the mathematical model to predict the output with certainty. It is very important that the mathematical model has high predictive ability, since it will be used to calculate the Monte Carlo simulation outputs from the random inputs.
The adjustment of a mathematical model usually is evaluated based on two parameters: R2 and R2adj. R2 is
proportional to total variability explained by the model, and it will be close to 100% when the model is most adjusted to the experimental data. However, R2 may not
be the most reliable variable as it may increase due to an increased number of non-signiicant factors included in the model. Thus, R2adj is often used to compare mathematical
models, since it precisely adjusts to the number of factors included in the model.
The Pareto chart of the complete model includes the linear terms of time of dissolution (A), volume f dissolution media (B), pH of dissolution media (C), rotation speed (D), and their interactions (AB, AC, AD, BC, BD, and CD) are shown in Figure 1. Despite a high R2
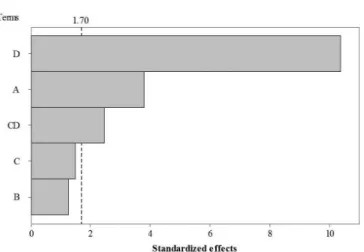
value (83.45%), the complete model was not well adjusted due to the inclusion of insignificant factors. A second model including the linear terms of time of dissolution (A), volume f dissolution media (B), pH of dissolution media (C), rotation speed (D), and the interaction between pH and rotation speed (CD) was adjusted. According to the Pareto chart (Figure 2) and ANOVA results (Table I), the most signiicant factors were rotation speed (D), time FIGURE 1 - Pareto chart for efects of time of dissolution (A),
volume f dissolution media (B), pH of dissolution media (C), rotation speed (D), and their interactions (AB, AC, AD, BC, BD, and CD) on the amount of acetaminophen dissolved.
TABLE I - Analysis of variance (ANOVA) results of the amount of acetaminophen dissolved (%) as a function of time of dissolution (A), volume of dissolution media (B), pH of dissolution media (C), and rotation speed (D)
Source d.f. SS MS F p-value
Model 5 0.026204 0.026204 26.55 0.000**
Linear 4 0.024847 0.024847 31.47 0.000**
A 1 0.002836 0.002836 14.37 0.001**
B 1 0.000311 0.000311 1.58 0.219
C 1 0.000432 0.000432 2.19 0.150
D 1 0.021268 0.021268 107.75 0.000**
Interactions 1 0.001180 0.001180 5.98 0.021*
CD 1 0.001180 0.001180 5.98 0.021*
Error 30 0.005921 0.000197
Total 35 0.032125
Legend: d.f.: degrees of freedom, SS: Sum of Squares, MS: Mean of Squares, F: calculated F statistics, and p-value: *signiicant
of dissolution (A), and the interaction between pH and rotation speed (CD), respectively. Regression equation and coeicients of determination (R2, R2adj, and R2pred) of
this model is shown in Table II. A Box-Cox transformation (λ = 17, and geometric mean g = 0.941974) was used to normalize the amount of acetaminophen dissolved (output). The main efect and interaction efect plots are shown in Figure 3.
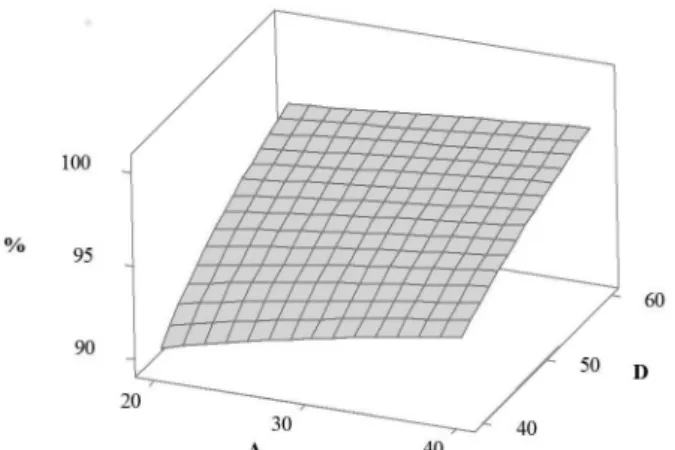
Response surface plot was obtained based on the mathematical model adjusted in order to show the efect of time of dissolution (A) and rotation speed (D) (Figure 4) in the amount of acetaminophen dissolved (%), using volume (B) and pH (C) of dissolution media fixed at 900 mL and 5.8, respectively. According to Figure 4, the amount of acetaminophen dissolved was more susceptible to time of dissolution (from 20 to 40 minutes) when a low rotation speed (40 rpm) is used. Moreover, at high rotation
FIGURE 2 - Pareto chart for efects of time of dissolution (A), volume f dissolution media (B), pH of dissolution media (C), rotation speed (D), and the interaction of pH and rotation speed (CD) on the amount of acetaminophen dissolved.
FIGURE 3 - Main efects and interactions plots for the efect of time of dissolution (A, from 20 to 40 minutes), volume f dissolution media (B, from 800 to 1000 mL), pH of dissolution media (C, from 2.o to 6.8), rotation speed (D, from 40 to 60 rpm), and their interactions (AB, AC, AD, BC, BD, and CD) on the amount of acetaminophen dissolved.
TABLE II - Regression equation and coeicients of determination (R2, R2adj, and R2pred) of the amount of acetaminophen dissolved
(%) as a function of time of dissolution (A), volume of dissolution media (B), pH of dissolution media (C), and rotation speed (D)
Regression equation R2 R2adj R2pred
(%λ
-1)/(λ×g(λ-1)) = – 0.2132 + 0.001087×A + 0.000029×B
– 0.01284×C + 0.001146×D + 0.000292×C×D 81.57% 78.50% 73.22%
speed (60 rpm), the amount of acetaminophen dissolved was almost not afected by time of dissolution (from 20 to 40 minutes). Similarly, Figure 5 shows the response surface plot of the amount of acetaminophen dissolved (%) as a function of time of dissolution (A) and pH of dissolution media (C), with volume of dissolution media (B) and rotation speed (D) ixed at 900 mL and 50 rpm, respectively. At low rotation speed (40 rpm), the amount of dissolved acetaminophen slightly decreased as the pH increased. On the other hand, the amount of dissolved acetaminophen slightly increased as the pH increase, at high rotation speed (60 rpm.).
It did not escape our notice that pH, the input factor with the widest range (C, from 2.0 to 6.8) did not afect the amount of acetaminophen dissolved. pH alters the ionization of organic molecules, which alters the solubility of active pharmaceutical ingredient (API) in dissolution media. The non-signiicant efect of pH in the amount of
acetaminophen dissolved may be explained due to its pKa (9.46), as well as the logS and logP curves as functions of pH. In other words, solubility of acetaminophen will be afected only in alkaline pH. Thus, solubility modiications in the pH range adopted in our study were not expected.
On the other hand, rotation speed significantly affects the amount of acetaminophen dissolved. This may be explained due to the efects of the hydrodynamic environment on the tablet dissolution rate (Kamba et al., 2003; Wu, Kildsig, Gahly, 2004). Rotation speed was even more signiicant than time of dissolution. We believe this may be explained because acetaminophen is a high solubility drug (BCS Class I) (Kalantzi et al., 2006). Thus, the amount of acetaminophen dissolved in the range of time adopted in our study was close to the plateau level. Considering the importance of the hydrodynamic properties on the dissolution, the absence of volume as a factor of influence on the amount of acetaminophen dissolved could be questioned. However, the volume of dissolution media (900 mL) was large enough for the variation proposed in our study (from 800 to 1000 mL) to be not signiicant, since acetaminophen is a high solubility drug (Granber, Rasmuson, 1999). Because of the high solubility of acetaminophen, even under drastic changes in the signiicant factors in the dissolution test, minimal dissolution reached around 90%, which is considerably above the minimum of 80% in 30 min (ANVISA, 2010b; United States Pharmacopeia, 2012). Therefore, the dissolution test for acetaminophen tablets resists variations in experimental conditions.
The Monte Carlo simulation applied in estimating measurement uncertainty requires that the output response has a mathematical relationship with the inputs or sources of uncertainty. In addition, the inputs must have a probability density function, which can be `obtained from existing information about the process or evaluated experimentally. Random values of the density of probability of each input will be sampled and conigured as mathematical expressions that will generate a simulated output result. This process is repeated a high number of times, generating a distribution of simulated results that will be used to determine uncertainty (Meyer, 2007; Ellison, Williams, 2012).
Monte Carlo simulations were performed with 5,000 random values of time of dissolution (5,000 random values, normal distribution, mean = 30 minutes and standard deviation = 1 minute), volume of dissolution media (5,000 random values, normal distribution, mean = 900 mL and standard deviation = 5 mL), pH of dissolution media (5,000 random values, normal distribution, mean = 5.80 and standard deviation = 0.05), and rotation speed (5,000 random values, normal distribution, mean = 50 rpm FIGURE 4 - Response surface plot of the effect of time of
dissolution (A) and rotation speed (D) on the amount of acetaminophen dissolved (%).
and standard deviation = 2 rpm). The pH of dissolution media used in the central point of fractionate factorial design was 4.4. Despite this, we performed Monte Carlo simulations using a dissolution media pH of 5.8, which is the pH used in the monograph of Brazilian pharmacopeia (ANVISA, 2010b).
The estimation of measurement uncertainty associated with the dissolution test would be much more difficult using the Eurachem/Citac Guidelines or spreadsheet methods. This is because the effects of dissolution conditions (such as time of dissolution, volume of dissolution media, pH of dissolution media, and rotation speed) on the amount of acetaminophen dissolved are not mathematically established. Measurement uncertainty estimation would be easier using other approaches such as method validation and repeatability/reproducibility studies. However, these approaches do not provide information of individual contributions of each source of uncertainty (Diaconu et al., 2015; Francisco, Saviano, Lourenço, 2016; Takano et al., 2017). Thus, we estimated the measurement uncertainty by Monte Carlo simulations performed using the regression equation of the amount of acetaminophen dissolved (%) as a function of time of dissolution (A), volume of dissolution media (B), pH of dissolution media (C), and rotation speed (D) (Table II).
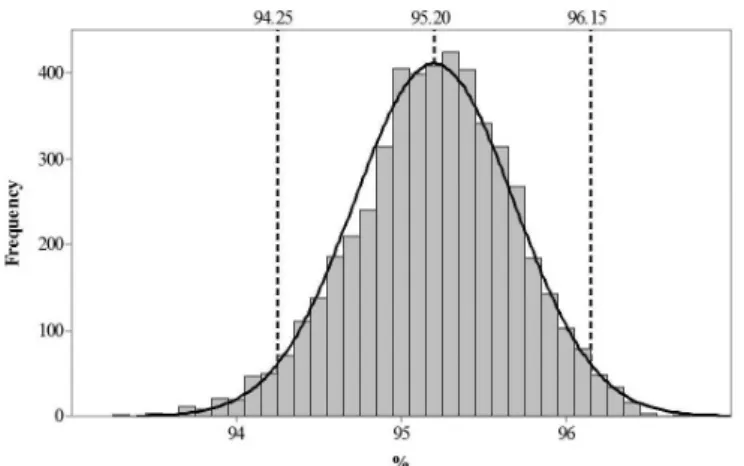
This approach is in accordance with the principle of determination of measurement uncertainty described in the EURACHEM Guide (Ellison, Williams, 2012). From the simulated results of dissolution (output), we obtained a histogram plot (Figure 6) with normal distribution, characterized by its mean (95.2%) and standard deviation (0.5%). Expanded uncertainty may be obtained by the multiplication of standard deviation (0.5%) by a coverage factor (k = 2), which correspond to a 95% confidence interval (from 94.2 to 96.2%).
The ANOVA (Table I) and Pareto’s Chart (Figure 2) indicate that time of dissolution (A), rotation speed (D), and the interaction between pH of dissolution media and rotation speed (CD) were signiicant terms of regression equation (Table II). However, considering the individual contribution of each source of uncertainty, the rotation speed was the most important source of uncertainty, contributing about 96.2% of overall uncertainty (Figure 7). The other factors contribute with virtually insigniicant uncertainties. It is important to note that the uncertainty calculated in this paper relects the expected uncertainty to the dissolution test, and does not consider variations in the content of acetaminophen. Pendrill raises some critical points on how to differentiate the uncertainty of measurement inherent in the manufacturing process. This question must be observed in the implementation of measurement uncertainty using EURACHEM and GUM methods (Pendrill, 2014).
CONCLUSION
The main factors of variability for the dissolution of acetaminophen were rotation speed, time of dissolution, and the interaction between pH and rotation speed. Using Monte Carlo simulations, we estimated measurement uncertainty for a dissolution test of acetaminophen tablets (95.2 ± 1.0%), with a 95% conidence level. Amounts of acetaminophen dissolved using the experimental range proposed in our study were found to be considerably above the minimum of 80% in 30 min. Finally, it is important to note that the uncertainty calculated in this paper relects the expected uncertainty to the dissolution test and does not consider variations in the content of acetaminophen.
FIGURE 6 - Histogram plot obtained from 5,000 Monte Carlo simulations of the amount of acetaminophen dissolved.
REFERENCES
Agência Nacional de Vigilância Sanitária. ANVISA. Teste de
Dissolução. In: Farmacopeia Brasileira. Cap.5.1.5. Brasília:
ANVISA; 2010a. v.1, p. 66-73.
Agência Nacional de Vigilância Sanitária. ANVISA. Paracetamol Comprimidos. In: Farmacopeia Brasileira. Brasília: ANVISA;
2010b. v.2, p. 1190-1192.
Amidon GL, Lennernäs H, Shah VP, Crison JR. A theoretical
basis for a biopharmaceutical drug classiication: the correlation
of in vitro drug product dissolution and in vivo bioavailability. Pharm Res. 1995;12(3):413-420.
Barat A, Ruskin HJ, Crane M. Probabilistic models for drug dissolution. Part 1. Review of Monte Carlo and stochastic cellular automata approaches. Simul Model Pract Theory. 2006a;14(7):843-856.
Barat A, Ruskin HJ, Crane M. Probabilistic models for drug dissolution. Part 2. Modelling a soluble binary drug delivery system dissolving in vitro. Simul Model Pract Theory. 2006b;14(7):857-873.
Barwick VJ, Ellison SLR. Estimating measurement uncertainty
using a cause and effect and reconciliation approach Part 2. Measurement uncertainty estimates compared with collaborative
trial expectation. Anal Comm. 1998:35(11):377-383.
Campagna FA, Cureton G, Mirigiam, RA, Nelson E. Inactive
prednisone tablets. J Pharmac Scien. 2006;52:605-606.
Diaconu I, Mirea CM, Ruse E, Balea AM. Uncertainty
estimation ir acetaminophen spectrophotometric determination
after the transport through bulk liquid membrane. UPB Sci Bull Series B. 2015:77(1):41-52.
Dokoumetzidis A, Macheras P. A century of dissolution research:
from noyes and whitney to the biopharmaceutics classiication
system. Inter J Pharmac. 2006;321(1-2): 1-11.
Eller SCWS, Flaiban LG, Paranhos BAPB, Da Costa JL,
Lourenço FR, Yonamine M. Analysis of 11-nor-9-carboxy-Λ9-tetrahydrocannabinol in urine samples by hollow fiber-liquid phase microextraction and gas chromatography-mass
spectrometry in consideration of measurement uncertainty.
Forensic Toxicol. 2014;32(2):282-291.
Ellison SLR, Barwick VJ. Estimating measurement uncertainty: reconciliation using a cause and efect approach. Accred Qual
Assur. 1998a;3(3):101-105.
Ellison SLR, Barwick VJ. Using validation data for ISO
measurement uncertainty estimation Part 1. Principles of an approach using cause and effect analysis. Analyst. 1998b;123(6):1387-1392.
Ellison SLR, Williams A. Eurachem/CITAC guide:quantifying uncertainty in analytical measurement. 3rd. ed. [London]: Eurachem; 2012. [citado 2016 Aug 13]. Disponível em: <www. eurachem.org>.
Eurachem Guide. Quantifying uncertainty in analytical measurement. Laboratory of the Government Chemist. London: BSI; 1995.
Francisco FL, Saviano AM, Lourenço FR. In vitro therapeutic
equivalence of ciprofloxacin ophtalmic drugs based on
measurement uncertainty and Monte Carlo simulations. Lat Am J Pharm.2014;32(2):237-244.
Francisco FL, Saviano AM, Lourenço FR. Measuring uncertainty using different approaches: a case study for acetaminophen
quantiication. J AOAC Int. 2016;99(3):612-617.
Granberg RA, Rasmuson AC. Solubility of paracetamol in pure solvents. J Chem Eng Data. 1999;44(6):1391-1395.
Ghisleni DDM, Okamoto RT, Amaral CMO, Lourenço FR, Pinto TJA. New microbiological assay for determination of caspofungin in the presence of its degradation products and its measurement uncertainty. J AOAC Int. 2014a;97(3):908-912.
Ghisleni DDM, Okamoto RT, Lourenço FR, Pinto TJA.
Validation and measurement uncertainty of an UPLC-PDA
stability indication method applied to degradation kinetics of caspofungin. Curr Pharmac Anal. 2014b;10(3):193-202.
Hammersley M, Handscomb DC. The general nature of Monte Carlo methods. In: Monte Carlo Methods. London: Methuen & Co; 1964. p. 1-9.
Joint Committee for Guides in Metrology. JCGM. Evaluation
of measurement data – Supplement 1 to the ‘’Guide to the Expression of Uncertainty in Measurement’’ – Propagation of
Kalantzi L, Reppas C, Dressman JB, Amidon GL, Junginger HE,
Midha KK, Shah VP, Stavchansky SA, Barends DM. Biowaiver
monographs for immediate release solid oral dosage forms: Acetaminophen (paracetamol). J Pharm Sci. 2006;95(1):1-4.
Kamba M, Seta Y, Takeda N, Hamaura T, Kusai A, Nakane H, Nishimura K. Measurement of agitation force in dissolution
test and mechanical destructive force in disintegration test. Int J Pharm. 2003;250(1):99-109.
Kroese DP, Brereton T, Taimre T, Botev ZI. Why the Monte Carlo method is so important today. WIREs Comput Stat. 2014;6(6):386-392.
Leito I, Strauss L, Koort E, Pihl V. Estimation of uncertainty in
routine pH measurement. Accred Qual Assur. 2002;7(6):242-249.
Lourenço FR. Uncertainty measurement of microbiological assay for apramycin soluble powder. Lat Am J Pharm. 2013;32(5):640-645.
Lourenço FR, Kaneko TM, Pinto TJA. Evaluating measurement uncertainty in the microbiological assay of vancomycin from methodology validation data. J AOAC Int. 2007;90(5):1383-1386.
Meimaroglou D, Kiparissides C. Review of Monte Carlo methods for the prediction of distributed molecular and morphological polymer properties. Ind Eng Chem Res. 2014;53(22):8963-8979.
Meyer MC, Straughn AB, Jarvi EJ, Wood GC, Pelsor FR, Shah
VP. The bioinequivalence of carbamazepine tablets with a
history of clinical failures. Pharm Res. 1992;9(12):1612-1616.
Meyer VR. Measurement uncertainty. J Chromat A.
2007;1158(1-2):15-24.
Okamoto RT, Traple MAL, Lourenço FR. Uncertainty in the
quantiication of metronidazole in injectable solution and its
application in the assessment of pharmaceutical equivalence. Curr Pharm Anal. 2013;9(4):355-362.
P e n d r i l l L R . U s i n g o f m e a s u r e m e n t u n c e r t a i n t y i n decision-making and conformity assessment. Metrologia. 2014;51:S206-S218.
S a v i a n o A M , L o u r e n ç o F R . U n c e r t a i n t y e v a l u a t i o n
for determining linezolid in injectable solution by UV
spectrophotometry. Measurement. 2013;46(10):3924-3928.
Saviano AM, Madruga ROG, Lourenço FR. Measurement uncertainty of a UPLC stability indicating method for determination of linezolid in dosage forms. Measurement. 2015;59:1-8.
Takano DEN, Reis PRS, Singh A, Lourenço FR. Estimation of
uncertainty for measuring desloratadine in tablets formulation
using UV spectrophotometry. Measurement. 2017 (in press).
Traple MAL, Saviano AM, Francisco FL, Lourenço FR. Measurement uncertainty in pharmaceutical analysis and its application. J Pharm Anal. 2014;4(1):1-5.
United States Pharmacopeia. <771> Dissolution. Rockville: United States Pharmacopeia, 2011.
Williams A. Introduction to measurement uncertainty in chemical analysis. Accred. Qual. Assur. 1998;3(3):92-94.
Wu Y, Kildsig DO, Gahly ES. Effect of hydrodynamic environment on tablet dissolution rate. Pharm Dev Tech. 2004;9(1):25-37.
Received for publication on 21st November 2016
![Performance monitoring and optimization of industrial processes [abstract]](data:image/gif;base64,R0lGODlhAQABAIAAAP///wAAACH5BAEAAAAALAAAAAABAAEAAAICRAEAOw==)