The consensus sequence of
FAMLF
alternative splice
variants is overexpressed in undifferentiated
hematopoietic cells
W.L. Chen
1, D.F. Luo
1, C. Gao
1, Y. Ding
1and S.Y. Wang
1,21
Union Clinical Medical College, Fujian Medical University, Fuzhou, China 2
Department of Hematology, Fujian Institute of Hematology, Fujian Provincial Key Laboratory on Hematology, Fujian Medical University Union Hospital, Fuzhou, China
Abstract
The familial acute myeloid leukemia related factor gene (FAMLF) was previously identified from a familial AML subtractive cDNA library and shown to undergo alternative splicing. This study used real-time quantitative PCR to investigate the expression of the
FAMLFalternative-splicing transcript consensus sequence (FAMLF-CS) in peripheral blood mononuclear cells (PBMCs) from 119 patients withde novoacute leukemia (AL) and 104 healthy controls, as well as in CD34+cells from 12 AL patients and 10
healthy donors. A 429-bp fragment from a novel splicing variant ofFAMLFwas obtained, and a 363-bp consensus sequence was targeted to quantify totalFAMLFexpression. Kruskal-Wallis, Nemenyi, Spearman’s correlation, and Mann-Whitney U-tests were used to analyze the data.FAMLF-CSexpression in PBMCs from AL patients and CD34+cells from AL patients and controls was significantly higher than in control PBMCs (Po0.0001). Moreover,FAMLF-CSexpression in PBMCs from the AML group was positively correlated with red blood cell count (rs=0.317, P=0.006), hemoglobin levels (rs=0.210, P=0.049), and
percentage of peripheral blood blasts (rs=0.256, P=0.027), but inversely correlated with hemoglobin levels in the control group
(rs=–0.391, Po0.0001). AML patients with high CD34+expression showed significantly higherFAMLF-CSexpression than
those with low CD34+expression (P=0.041). Our results showed thatFAMLFis highly expressed in both normal and malignant immature hematopoietic cells, but that expression is lower in normal mature PBMCs.
Key words:FAMLF; Gene expression; Leukemia; Real-time polymerase chain reaction; Alternative splicing
Introduction
Familial acute leukemia is an inherited malignancy whose genetic pool offers an effective research avenue to elucidate disease pathogenesis through the investigation of acute leukemia (AL) pedigrees with high incidence (1–5). We previously identified an acute myeloid leukemia (AML) pedigree in a village in Fujian Province, China (6,7), from which we constructed a subtracted cDNA library using super-switching mechanism at RNA termini polymerase chain reaction (SMART-PCR) and suppression subtractive hybridization (8). Subsequent sequence analysis revealed that 11 expressed sequence tags (ESTs) did not match any known sequences in the GenBank/EMBL database. Using SMART rapid amplification of cDNA ends, we obtained the complete cDNA sequence for one selected EST (GenBank accession no. CV973101.1) (9), and derived the full nucleotide sequence of a novel gene transcript (GenBank accession no. EF413001.1) consisting of two exons. This gene, namedHomo sapiensfamilial acute myeloid leuke-mia related factor (FAMLF), is localized to chromosome
1q32.1. Bioinformatics analysis predicted thatFAMLFmay participate in the transduction of cellular messages and be associated with cell proliferation or apoptosis (9).
Recent data from genome-wide studies have sug-gested that more than 90% of human genes undergo alternative splicing (10). Indeed, evidence has been found for the existence of alternative FAMLF splicing variants, with the retrieval of a FAMLF transcript from the NCBI database (GenBank accession no. NR_040073.1) con-taining the identical nucleotide sequence to EF413001.1 at position 1–365 bp. This transcript has three exons and was defined as a long non-coding RNA. Based on the position of the second exon of NR_040073.1, we speculated that 1–363 bp may be the consensus sequence ofFAMLFRNAs. We confirmed this by reverse transcription (RT)-PCR. We have also shown that CV973101.1 was highly expressed in the affected family member of the familial AML pedigree, but remained at a low level in the unaffected relative (8). The BLAST (Basic
Correspondence: Shaoyuan Wang:[email protected].
Local Alignment Search Tool) search identified that the CV973101.1 sequence is located at 25–279 bp of the alternative FAMLF splicing transcript (EF413001.1 or NR_040073.1). We propose that it is of interest to explore the 1–363 bp sequence, and to verify the expression of FAMLFsplicing variants consensus sequence in AL.
Previously, we examined the expression of EF413001.1 in peripheral blood mononuclear cells (PBMCs) from 23 patients withde novoAML, 23 controls, and another nine healthy individuals from the familial AML pedigree using semi-quantitative PCR. EF413001.1 was shown to be overexpressed in patient PBMCs compared with those from controls (9). However, EF413001.1 expression does not represent the complete FAMLF expression, because research has shown that many alternative splice variants from the same gene have different expression patterns (11,12). Hence, the total FAMLFexpression in AL patients and controls remains to be determined. Moreover, it will be worthwhile to detect the expression of theFAMLFalternative-splicing transcript consensus sequence (FAMLF-CS; 1–363 bp) to evaluate the possible functional involvement of the gene in AL. Thus, the present study used real-time quantitative (RQ)-PCR to examine the totalFAMLFRNA expression using primers targeting the consensus sequence in PBMCs and CD34+cells from AL patients and healthy controls. High expression of FAMLF was detected in both normal and malignant naive hematopoietic cells.
Material and Methods
Sample collection
A total of 233 subjects were enrolled in the present study, including 119 patients with de novo AL, 104 healthy individuals, and 10 healthy pregnant women. The patients were selected from the Department of Hematol-ogy, Fujian Medical University Union Hospital, Fuzhou, China, from September 2010 to April 2012. AL diagnosis and classification were based on morphologic, cyto-chemical, and immunophenotypic criteria proposed by the French-American-British Committee (13,14). Sam-ples collected from AL patients were analyzed at diagnosis. The healthy individuals in this study were from the Medical Center of Fujian Medical University Union Hospital. The pregnant women were from the Obstetrical Department, Fujian Provincial Maternal and Child Health Care Hospital. Subjects provided their written informed consent for the use of blood samples and access to clinical information. The procedures for our study were conducted in accordance with the guidelines of the Medical Ethics Committees of the Health Bureau of Fujian Province, China.
Peripheral blood (10 mL) from AL patients (n=119) or healthy individuals (n=104), and bone marrow (10 mL) aspirated from the posterior iliac crest of AL patients (n=12) were collected in sterile EDTA tubes. Umbilical
cord blood (UCB; n=10) was obtained after full-term normal vaginal deliveries from the healthy pregnant women and placed in a 50-mL sterile centrifuge tube containing 400 U of preservative-free heparin. PBMCs, bone marrow mononuclear cells (BMMCs), and umbilical cord blood mononuclear cells (UCBMCs) were isolated by Ficoll-Hypaque density gradient centrifugation (400g, 20 min), and washed twice with phosphate-buffered saline.
CD34+ cells from healthy donors were separated from UCBMCs, and those of AL patients separated from BMMCs using fluorescence-activated cell sorting. UCBMCs and BMMCs were labeled with phycoerythrin (PE)-conjugated mouse anti-human CD34+ monoclonal antibody (eBioscience, USA) according to the manufac-turer’s recommendations. Cell sorting was performed using a FACStarPLUS cell sorter (Becton Dickinson, USA) and the threshold for selection of CD34+ cells was based on the comparison with a PE-conjugated isotype control antibody (IgG1, eBioscience). Purity of the
separated CD34+ cells was assessed by analysis of an aliquot of sorted cells and was routinely greater than 99%. PBMC and CD34+cell samples were stored at
–70°C and used for RNA extraction.
RNA extraction and reverse transcription
Total RNA was extracted from PBMCs and CD34+ cells using Trizol reagent (Invitrogen, USA) according to the manufacturer’s instructions. The integrity of the RNA samples was determined by electrophoresis through a denaturing agarose gel and staining with ethidium bromide. The 18S and 28S RNA bands were visualized in ultraviolet light. Spectro-photometric readings at wavelengths of 260 and 280 nm were obtained to evaluate the quantity and purity of the isolated RNA.
The RNA template was then prepared and transcribed into first-strand cDNA using a RevertAidTM First Strand cDNA Synthesis Kit (Fermentas, Canada). Briefly, 2mg of total RNA was incubated at 25°C for 5 min, at 42°C for 60 min, then at 70°C for 5 min with 0.2mg random hexamer primer, 200 U RevertAidTM M-MuLV reverse transcriptase, 20 U RiboLockTM RNase inhibitor, 2mL 10 mM dNTPs, and 4mL 5 reaction buffer (250 mM Tris-HCl, 250 mM KCl, 20 mM MgCl2, and 50 mM DTT, pH
8.3) in a total volume of 20mL. The cDNA was stored at–20°C.
PCR
To detect alternativeFAMLFsplicing transcripts, PCR was conducted in a 25mL solution containing 2mL cDNA template, 12.5mL 2 DreamTaqTMGreen PCR Master Mix (Fermentas), 1mL 10mmol/LFAMLFprimer pairs (forward primer: 5’-CAGGAGCAAGGGATGTCTG-3’, reverse primer: 5’-CCACCAAAACTGATGAAATAGC-3’), and 9.5mL H2O.
30 cycles of 94°C for 30 s, 57°C for 30 s, and 72°C for 2 min, followed by afinal extension at 72°C for 10 min. PCR products were analyzed by electrophoresis on a 1% agarose gel containing ethidium bromide and sent to Shanghai Invitrogen Biotechnology Co., Ltd. (China) for DNA sequence analysis.
Real-time quantitative PCR (RQ-PCR)
The following FAMLF-CS-specific primers were used to amplify a 147-bp product by RQ-PCR: forward primer: 50-ACCGTTTTGAAATTAGATCC-30 (exons 1/2, nt posi-tion: 191–210, GenBank accession no. EF413001.1/ NR_040073.1), reverse primer: 50 -CCACCAACCAAGC-TACTCAC-30 (exon 2, nt position: 337
–318, GenBank accession no. EF413001.1/NR_040073.1).
The endogenous control gene b-actin was used to check the quality of the RNA samples and to normalize the variations from different samples. b-actin-specific primers for the amplification of a 220-bp product were as follows: forward primer: 50-AGTGTGACGTGGACATC CGCAAAG-30 (exon 5, nt position: 935–958, GenBank accession no. NM_001101.3), and reverse primer: 50 -ATCCACATCTGCTGGAAGGTGGAC-30(exon 6, nt posi-tion: 1154–1131, GenBank accession no. NM_001101.3). Shanghai Invitrogen Biotechnology Co., Ltd. synthesized all primers.
Expression levels of the target (FAMLF-CS) and reference genes (b-actin) were determined by SYBR Green I RQ-PCR assays of 96-well plates. All samples were run in triplicate on an ABI 7500 Real-Time PCR System (Applied Biosystems, USA). PCR was performed in a total volume of 25mL containing 1mL cDNA template, 12.5mL 2 FastStart Universal SYBR Green Master Mix (Roche, USA), 0.6mL 10mmol/LFAMLF-CS orb-actinprimer pairs, and 10.9mL H2O.FAMLF-CSand
b-actin were amplified in separate wells. The reaction protocol involved initial heating at 50°C for 2 min and 95° C for 10 min, followed by 40 cycles of 95°C for 15 s and 55°C for 1 min. In each RQ-PCR set-up, two control samples were used to monitor the variation between plates, which was controlled to be less than 5% in this study. Three template-free samples were included as negative controls. All replicates within 0.5 CT of each
other were acceptable. Additionally, PCR product
speci-ficity was confirmed by melting curve analysis and agarose electrophoresis. PCR products were sent to Shanghai Invitrogen Biotechnology Co., Ltd. for DNA sequence analysis.
Data were analyzed using the comparative CTmethod
using the 7500 Fast System SDS software (Applied Biosystems) (15). The relative quantitation of FAMLF-CS expression was calculated as 2-DCt
, whereDCT=(CTFAMLF-CS– CTb-actin). Before theDCTcalculation was performed,
FAMLF-CS andb-actinvalues were averaged separately. Medians and interquartile ranges were calculated for each group as individual data points using 2-DC.
Statistical analyses
Data analysis was performed using SPSS version 15 (SPSS Inc., USA). Quantitative variables are reported as medians and (interquartile) ranges, and qualitative vari-ables are reported as numbers and percentages. The Kruskal-Wallis test was used to determine if the difference inFAMLF-CSexpression among the four groups (PBMCs from AL patients, PBMCs from healthy individuals, CD34+ cells from AL patients, and CD34+ cells from healthy donors) was statistically significant. If so, the Nemenyi test was used to analyze the difference between the two groups. These statistical analyses were also used to analyze differences in FAMLF-CS expression among the AML, acute lymphocytic leukemia (ALL), and control groups. Spearman’s correlation test analyzed the correla-tion between FAMLF-CS expression and hematological parameters. Finally, the Mann-Whitney U-test was used to analyze the differential expression of FAMLF-CS in PBMCs from AL patients with high and low CD34+ expression. A P value o0.05 was considered to be statistically significant.
Results
FAMLFhas a novel splicing variant and 1–363 bp is
the consensus sequence ofFAMLFRNAs
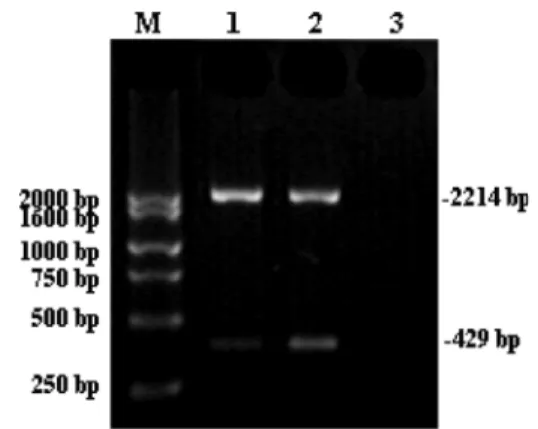
RT-PCR was performed to confirm our speculation about the FAMLF consensus sequence. Two peripheral blood samples from AL patients were amplified by RT-PCR and a specific band of expected size (2214 bp) was obtained, as well as an unexpected 429-bp band (Figure 1). Sequencing revealed that the unexpected fragment shared 338-bp of its sequence with that of the two known FAMLFsplicing variants (nt position: 26–363 bp) (Figure 2). This represented a partial sequence of a novel FAMLF alternative splicing transcript, and confirmed the 1–363 bp
sequence as the consensus sequence of FAMLF alter-native splicing variants. We therefore designed primers to target the consensus sequence for quantitative FAMLF total RNA expression.
FAMLF-CSis overexpressed in the PBMCs of
AL patients and CD34+cells of AL patients and healthy donors
FAMLF-CSexpression was investigated by RQ-PCR in PBMCs from 119 newly diagnosed patients with AL and 104 healthy donors, as well as in CD34+cells from 12 AL patient bone marrow samples and 10 UCB samples from healthy donors. The general characteristics of AL patients and normal individuals are shown in Table 1.FAMLF-CS expression was observed in the PBMCs of all normal individuals, with a median relative value of 0.0044 (interquartile range, 0.0022–0.0070; Figure 3).
Of the 119 patients tested, 108 (90.8%) demonstrated PBMC FAMLF-CS expression levels that exceeded the median of normal individuals. The median FAMLF-CS expression in AL patient PBMCs was 0.0403 (interquartile range, 0.0177–0.0845; Figure 3A), representing an increase in expression of more than 9-fold compared with controls (Po0.0001; Figure 3A). No significant difference
was observed between the AML group (n=88) and ALL group (n=31) (P=0.694; Figure 3B).
High expression of FAMLF-CS was also found in CD34+cells from healthy donors, with a median level of 0.0400 (interquartile range, 0.0245–0.0834), and CD34+ cells from AL patients, with a median level of 0.0608 (interquartile range: 0.0255–0.1410). A significant differ-ence was detected in FAMLF-CS expression between PBMCs from normal individuals and CD34+ cells from healthy donors or AL patients (Po0.0001; Figure 3A). CD34+cells from AL patients showed the highest median FAMLF-CSexpression level, followed by PBMCs from AL patients, then CD34+cells from healthy donors. However, no significant difference was observed between any two of these three groups (P40.05, Figure 3A).
FAMLF-CSexpression is correlated with
hematological parameters of AL patients and healthy controls
No correlation was observed between FAMLF-CS expression and white blood cell (WBC) count, red blood cell (RBC) count, or platelet count in the PBMCs from the healthy control group. However, an inverse correlation was observed between FAMLF-CS expression and hemoglobin levels (rs=–0.391, Po0.0001; Table 2) in this group. By contrast, significant and positive correlations were observed betweenFAMLF-CSexpression and RBC count (rs=0.225, P=0.025), and the percentage of
periph-eral blood blasts (rs=0.235, P=0.020) in AL PBMCs.
However, FAMLF-CS expression did not significantly correlate with WBC count, hemoglobin levels, platelet count, or percentage of bone marrow-derived CD34+ cells (P40.05; Table 2). Similarly,FAMLF-CSexpression levels in the AML group were significantly correlated with RBC count (rs=0.317, P=0.006), hemoglobin levels
Figure 2. Sequence acquisitions of 429-bp fragments showing inclusion of the consensus sequence. Black, red, and blue type indicate individual exons. Black and red represent part of the consensus sequence (338 bp).
Table 1.Characteristics of normal healthy individuals and patients with acute leukemia.
Controls (n=104) AL (n=119) AML (n=88) ALL (n=31)
Age (years) 32 (18-71) 38 (12-81) 45 (12-81) 27 (13-80)
Gender (n, %)
Male 63 (60.6%) 70 (58.8%) 50 (56.8%) 20 (64.5%)
Female 41 (39.4%) 49 (41.2%) 38 (43.2%) 11 (35.5%)
WBC count (109/L) 6.65 (4.07-9.43) 37.18 (0.93-517.60) 34.61 (0.93-408.70) 54.90 (2.47-517.60) RBC count (1012/L) 4.66 (3.07-6.34) 2.39 (1.51-4.59) 2.32 (1.51-4.59) 3.11 (1.63-4.58) Hemoglobin (g/dL) 14.0 (9.0-16.9) 7.4 (3.9-14.4) 7.3 (3.9-14.0) 9.0 (4.8-14.4) Platelet count (109/L) 216 (127-389) 38 (5-463) 34 (5-463) 50 (11-356)
Peripheral blood blasts (%) 74 (4-99) 76 (4-99) 71 (12-95)
CD34+cells (%) 0.8 (0.3-1.4)a 36 (0-98) 36 (0-98) 37 (0-98)
Patients with dominated immature blood cells (%)b
70.4 67.6 79.1
(rs=0.210, P=0.049), and percentage of peripheral blood
blasts (rs=0.256, P=0.027), but not with WBC count,
platelet count, or percentage of CD34+ cells (P40.05; Table 2). Additionally, no significant relationships were observed in the ALL group betweenFAMLF-CS expres-sion and WBC count, RBC count, hemoglobin levels, platelet count, percentage of peripheral blood blasts, or percentage of CD34+cells (P40.05; Table 2).
To further analyze the correlation betweenFAMLF-CS expression and the percentage of CD34+ cells, patients were divided into low and high expression groups using the median levels of percentage of CD34+cells as cut-off points. AL patients with a high expression of CD34+cells showed a trend toward a higher FAMLF-CSexpression than those in the low expression group, although this difference was not significant (P=0.078, Table 3). AML patients with a higher percentage of CD34+ cells had a
Figure 3.RQ-PCR analysis ofFAMLF-CSexpression in CD34+cells and peripheral blood mononuclear cells (PBMCs) from acute
leukemia (AL) patients and normal healthy controls (N).A, Expression ofFAMLF-CSin CD34+cells and PBMCs from AL patients and
normal healthy controls.B, Expression ofFAMLF-CSin PBMCs from patients with acute myeloid leukemia (AML), acute lymphocytic leukemia (ALL), and normal healthy controls (N). Data of the relative quantitation ofFAMLF-CS expression are reported as 2-DC. Horizontal bars represent the medianFAMLF-CSexpression for each group. *Po0.05 between groups (Nemenyi test). AL-CD34+: CD34+cells from AL patients; N-CD34+: CD34+cells from normal healthy controls; AL-PBMCs: PBMCs from AL patients; N-PBMCs:
PBMCs from normal healthy controls; AML-PBMCs: PBMCs from AML patients; ALL-PBMCs: PBMCs from ALL patients; NS: not significant.
Table 2.Spearman correlations ofFAMLF-CSwith hematological parameters.
Controls (n=104) AL (n=119) AML (n=88) ALL (n=31)
Spearman P Spearman P Spearman P Spearman P
WBC count (109/L)
–0.042 0.726 0.152 0.099 0.091 0.401 0.340 0.062
RBC count (1012/L) –0.156 0.195 0.225 0.025 0.317 0.006 0.084 0.684
Hemoglobin (g/dL) –0.391 o0.0001 0.130 0.140 0.210 0.049 –0.005 0.978
Platelet count (109/L) 0.141 0.241 –0.158 0.086 –0.138 0.201 –0.135 0.468
Peripheral blood blasts (%) 0.235 0.020 0.256 0.027 0.360 0.195
CD34+cells (%) 0.139 0.160 0.121 0.296 0.129 0.522
AL: acute leukemia; AML: acute myeloid leukemia; ALL: acute lymphocytic leukemia; WBC: white blood cell; RBC: red blood cell. Significant correlations, either positive or negative, are indicated in bold type (Po0.05).
Table 3. Correlations between FAMLF-CS expression and percentage of CD34+cells in AL patients.
CD34+cells (%) FAMLF-CSexpression P
AL (n=119) 0.078
p36 0.0349 (0.0173-0.0828)
436 0.0559 (0.0260-0.1144)
AML (n=88) 0.041*
p36 0.0343 (0.0174-0.0718)
436 0.0584 (0.0257-0.1174)
ALL (n=31) 0.905
p37 0.0459 (0.0094-0.1607)
437 0.0381 (0.0261-0.1006)
similarly, and significantly, higher FAMLF-CSexpression compared with those patients with lower CD34+ expres-sion (P=0.041, Table 3), but this significant difference was not found in the ALL group (P=0.905, Table 3).
Discussion
In this study, we obtained a 429-bp fragment from a novel splicing variant of FAMLF, and confirmed that the 1–363 bp sequence was the consensus sequence of knownFAMLFsplicing variants by comparing it with other FAMLF transcripts (EF413001.1 and NR_040073.1). To verify previous results, measure the total expression of different FAMLF splicing variants, and gain insight into FAMLF potential function in AL, we first examined FAMLF-CS expression in the PBMCs and CD34+ cells from AL patients and healthy controls by RQ-PCR using primers targeting the consensus sequence.
Our findings demonstrated that FAMLF-CS expres-sion was significantly higher in CD34+ cells from AL patients and healthy donors as well as in the PBMCs from AL patients compared with PBMCs from healthy individuals. CD34+ cells, including hematopoietic stem cells and early committed progenitors (16–18), were normal or malignant immature hematopoietic cells in this study. This compares with PBMCs from normal indivi-duals, which are mature cells, while immature blood cells dominated the peripheral blood cells from 70.4% of AL patients. Therefore, our results indicated thatFAMLF-CS is highly expressed in both normal and malignant immature hematopoietic cells, but is expressed at a low level in normal mature PBMCs.
We also found that AML patients with a higher expression of CD34+cells demonstrated higherFAMLF-CSexpression than those with lower CD34+expression, whileFAMLF-CS was positively correlated with the percentage of peripheral blood blasts in AL patient PBMCs. Hence, the expression of FAMLF-CS appears to be associated with the differ-entiation status of hematopoietic cells involved in the study. Previous research revealed a substantial connec-tion between hematopoietic cell differentiation and leukemogenesis or AL development (19–21), indicating that FAMLF-CS may participate in the development of leukemia through its role in hematopoietic cell differentiation.
Our study also revealed that the observed higher median expression level ofFAMLF-CSin CD34+ cells from AL patients compared with those from healthy donors was not significantly greater, implying that FAMLFmay not be defective in hematopoietic stem or progenitor cells. Thus, it is more likely thatFAMLF-CSis associated with hematopoietic cell differentiation rather than leukemogenesis.
Our findings therefore provided evidence for an association betweenFAMLF-CSexpression and hemato-poietic cell differentiation, suggesting that the consensus
sequence (1–363 bp) located at the 5’untranslated region (UTR) of EF413001.1 plays a pivotal role in the regulation of hematopoietic cell differentiation. Bernstein et al. (22) reported that the 5’-UTR of the platelet-derived growth factor B gene (PDGF2/c-sis) shows translational modulat-ing activity durmodulat-ing the megakaryocytic differentiation of K562 cells. Likewise, Fiaschi et al. (23) demonstrated that a relief of the inhibitory role of the 5’-UTR in the differentiated lineage process is responsible for the observed increase in acylphosphatase levels. Moreover, the 5’-UTRs of some genes are required for angiogenesis, hematopoiesis, and leukemogenesis (24,25). Because the 1–363 bp consensus sequence apparently plays a critical role inFAMLFcontrol, it may be possible for future studies to use small interfering RNA to target this region with the aim of studying the function ofFAMLF.
We additionally observed a positive correlation between FAMLF-CS expression and RBC count in the PBMCs from AML patients, but not in those from normal individuals. Moreover, FAMLF-CS expression was posi-tively correlated with hemoglobin levels in the PBMCs from AML patients, but inversely correlated in the PBMCs from normal individuals. These results indicate that FAMLF may have various functions in leukemia and normal cells.
In summary, our study showed that FAMLF-CSwas highly expressed in immature hematopoietic cells, and that the higher expression of FAMLF-CS in the PBMCs from AML patients was significantly associated with higher RBC count, hemoglobin levels, and percentage of periph-eral blood blasts. AML patients with higher CD34+ cell expression also showed higher FAMLF-CS expression. Our results therefore provide evidence for an association between FAMLF-CS expression and hematopoietic cell differentiation, suggesting that FAMLF-CS may be involved in the development of leukemia. However, further investigations are necessary to corroborate this relationship and to clarify the underlying mechanisms responsible for the role ofFAMLF-CSin hematopoietic cell differentiation.
Acknowledgments
References
1. Song WJ, Sullivan MG, Legare RD, Hutchings S, Tan X, Kufrin D, et al. Haploinsufficiency of CBFA2 causes familial thrombocytopenia with propensity to develop acute myelo-genous leukaemia.Nat Genet1999; 23: 166-175.
2. Preudhomme C, Renneville A, Bourdon V, Philippe N, Roche-Lestienne C, Boissel N, et al. High frequency of RUNX1 biallelic alteration in acute myeloid leukemia secondary to familial platelet disorder. Blood 2009; 113: 5583-5587, doi: 10.1182/blood-2008-07-168260.
3. Pabst T, Eyholzer M, Haefliger S, Schardt J, Mueller BU. Somatic CEBPA mutations are a frequent second event in families with germline CEBPA mutations and familial acute myeloid leukemia.J Clin Oncol2008; 26: 5088-5093, doi: 10.1200/jco.2008.16.5563.
4. Owen C, Barnett M, Fitzgibbon J. Familial myelodysplasia and acute myeloid leukaemia - a review. Br J Haematol 2008; 140: 123-132, doi: 10.1111/j.1365-2141.2007.06909.x. 5. Pradhan A, Mijovic A, Mills K, Cumber P, Westwood N, Mufti GJ, et al. Differentially expressed genes in adult familial myelodysplastic syndromes. Leukemia2004; 18: 449-459, doi: 10.1038/sj.leu.2403265.
6. Feng B, Lei J, Lin Z, Hao J, Chen W. Genetic studies on a family with acute myelogenous leukemia. Cancer Genet
Cytogenet1999; 112: 134-137, doi: 10.1016/s0165-4608(98)
00166-6.
7. He LZ, Lu LH, Chen ZZ. Genetic mechanism of leukemia predisposition in a family with 7 cases of acute myeloid leukemia. Cancer Genet Cytogenet 1994; 76: 65-69, doi: 10.1016/0165-4608(94)90074-4.
8. Zhang YW, Wang SY, Lin X, Wang CY. [Identification of differentially expressed genes in familial acute myelogenous leukemia by suppression subtractive hybridization].
Zhon-ghua Yi Xue Za Zhi2007; 87: 533-537.
9. Li JG, Wang SY, Huang YM, Wang CY. [Full-length cDNA cloning and biological function analysis of a novel gene FAMLF related to familial acute myelogenous leukemia].
Zhonghua Yi Xue Za Zhi2008; 88: 2667-2671.
10. Wang ET, Sandberg R, Luo S, Khrebtukova I, Zhang L, Mayr C, et al. Alternative isoform regulation in human tissue transcriptomes.Nature 2008; 456: 470-476, doi: 10.1038/ nature07509.
11. Malinin NL, Plow EF, Byzova TV. Kindlins in FERM adhe-sion.Blood2010; 115: 4011-4017, doi: 10.1182/blood-2009-10-239269.
12. Yagi T, Hibi S, Takanashi M, Kano G, Tabata Y, Imamura T, et al. High frequency of Ikaros isoform 6 expression in acute myelomonocytic and monocytic leukemias: implications for up-regulation of the antiapoptotic protein Bcl-XL in leuke-mogenesis. Blood 2002; 99: 1350-1355, doi: 10.1080/ 10428190801993462.
13. Bennett JM, Catovsky D, Daniel MT, Flandrin G, Galton DA, Gralnick HR, et al. Proposals for the classification of the
acute leukaemias. French-American-British (FAB) co-operative group.Br J Haematol1976; 33: 451-458, doi: 10.1111/j.1365-2141.1976.tb03563.x.
14. Lo Coco F, Foa R. Diagnostic and prognostic advances in the immunophenotypic and genetic characterization of acute leukaemia. Eur J Haematol 1995; 55: 1-9, doi: 10.1111/ j.1600-0609.1995.tb00225.x.
15. Schmittgen TD, Livak KJ. Analyzing real-time PCR data by the comparative C(T) method. Nat Protoc 2008; 3: 1101-1108, doi: 10.1038/nprot.2008.73.
16. Krause DS, Fackler MJ, Civin CI, May WS. CD34: structure, biology, and clinical utility.Blood1996; 87: 1-13.
17. Civin CI, Strauss LC, Brovall C, Fackler MJ, Schwartz JF, Shaper JH. Antigenic analysis of hematopoiesis. III. A hematopoietic progenitor cell surface antigen defined by a monoclonal antibody raised against KG-1a cells.J Immunol 1984; 133: 157-165.
18. Andrews RG, Singer JW, Bernstein ID. Precursors of colony-forming cells in humans can be distinguished from colony-forming cells by expression of the CD33 and CD34 antigens and light scatter properties.J Exp Med1989; 169: 1721-1731, doi: 10.1084/jem.169.5.1721.
19. Kelly LM, Gilliland DG. Genetics of myeloid leukemias.Annu
Rev Genomics Hum Genet2002; 3: 179-198, doi: 10.1146/
annurev.genom.3.032802.115046.
20. Vellenga E, Griffin JD. The biology of acute myeloblastic leukemia.Semin Oncol1987; 14: 365-371.
21. Wang XS, Gong JN, Yu J, Wang F, Zhang XH, Yin XL, et al. MicroRNA-29a and microRNA-142-3p are regulators of myeloid differentiation and acute myeloid leukemia. Blood 2012; 119: 4992-5004, doi: 10.1182/blood-2011-10-385716. 22. Bernstein J, Shefler I, Elroy-Stein O. The translational repression mediated by the platelet-derived growth factor 2/c-sis mRNA leader is relieved during megakaryocytic differentiation.J Biol Chem 1995; 270: 10559-10565, doi: 10.1074/jbc.270.18.10559.
23. Fiaschi T, Chiarugi P, Veggi D, Raugei G, Ramponi G. The inhibitory effect of the 5’ untranslated region of muscle acylphosphatase mRNA on protein expression is relieved during cell differentiation.FEBS Lett2000; 473: 42-46, doi: 10.1016/s0014-5793(00)01496-4.
24. Nagamachi A, Htun PW, Ma F, Miyazaki K, Yamasaki N, Kanno M, et al. A 5’untranslated region containing the IRES element in the Runx1 gene is required for angiogenesis, hematopoiesis and leukemogenesis in a knock-in mouse model. Dev Biol 2010; 345: 226-236, doi: 10.1016/j. ydbio.2010.07.015.
25. Hensold JO, Stratton CA, Barth D. The conserved 5’-untranslated leader of Spi-1 (PU.1) mRNA is highly structured and potently inhibits translation in vitro but not
in vivo. Nucleic Acids Res 1997; 25: 2869-2876, doi: