Original Article ISSN 1678-4375 (Online)
Nitrogen and phosphorus flux from the production of Nile tilapia
through the application of environmental indicators
J. A. S. Osti
a*, M. A. B. Moraes
b, C. F. Carmo
band C. T. J. Mercante
baDepartamento de Ecologia, Universidade Estadual Paulista – UNESP, CEP 13506-900, Rio Claro, SP, Brazil
bCentro de Pesquisa e Desenvolvimento Especializado em Recursos Hídricos, Instituto de Pesca – IP,
Avenida Francisco Matarazzo, 455, Parque da Água Branca, CP 61070, CEP 05001-900, São Paulo, SP, Brazil *e-mail: [email protected]
Received: February 22, 2016 – Accepted: August 1, 2016 – Distributed: February 28, 2018 (With 2 figures)
Abstract
We aimed in this study utilize environmental indicators as a quantitative method to evaluate and discuss the nitrogen (TN) and phosphorus (TP) flux by a production stage grow-out (termination) of Nile tilapia (Oreochromis niloticus) in fishpond. The TN and TP load, the mass balance, the input of TN and TP via feed and the converted nutrients in fish biomass are the environmental indicators applied in this study. During the production cycle (128 days), the system exported 15,931 g TN and 4,189 g TP that were related to the amount of feed supplied (r Pearson = 0.8825 and r = 0.8523, respectively), corroborated by the feed conversion ratio (1.61:1). The indicators showed that 26% TN and 45% TP were reversed into fish biomass, 62% TN and 40% TP were retained in the fishpond, and 12% TN and 15% TP were exported via effluent. The largest contribution of nutrients generated by the system and exported via effluent was observed in phase III and IV. This result is supported by the feed conversion ratio 2.14 and 2.21:1 obtained at this phase, a fact explained by the amount of feed offered and the fish metabolism. Application of environmental indicators showed to be an efficient tool to quantify flux of TN and TP produced during the grow-out period of Nile tilapia and therefore, guide management practices more sustainable. Concerning the environmental sustainability of the activity the implementation of best management practices such as the better control of the feed amount offered would lead to a smaller loss of TN and TP to the water. Furthermore, the use of better quality feeds would allow greater nutrient assimilation efficiency.
Keywords: environmentally sustainable management, nutrients load, mass balance, fish-farming, Oreochromis niloticus.
Fluxo de nitrogênio e fósforo na produção de tilápia-do-nilo
(
Oreochromis niloticus
) a partir da aplicação de indicadores ambientais
Resumo
Nós objetivamos neste estudo, utilizar indicadores ambientais como método quantitativo para avaliar e discutir sobre o fluxo de nitrogênio (TN) e fósforo (TP) na etapa final de crescimento (terminação) de tilápia-do-nilo (Oreochromis niloticus) em viveiro escavado. A carga de TN e TP, o balanço de massa, a entrada de nutrientes via ração e o TN e TP convertido em biomassa de peixe foram os indicadores ambientais utilizados neste estudo. Durante o ciclo produtivo (128 dias), o sistema exportou 15.931 g NT e 4.189 g PT os quais foram relacionadas às quantidades de alimento fornecido (r Pearson = 0,8825 e r = 0,8523, respectivamente), corroborada pela conversão alimentar (1,61:1). Os indicadores evidenciaram que 26% NT e 45% PT foram revertidos em biomassa de peixe, 62% NT e 40% PT ficaram retidos no viveiro e 12% NT e 15% PT foram exportados via efluente. O maior aporte de nutrientes gerado pelo sistema e exportado via efluente foi verificado nas fases III e IV. Este resultado é corroborado pelas taxas de conversão alimentar de 2,14 e 2,21:1 obtida nestas fases, fato explicado pela quantidade de ração ofertada e pelo metabolismo dos peixes. A aplicação dos indicadores ambientais mostrou ser uma ferramenta eficiente para quantificar o fluxo de TN e TP produzidos durante a etapa final de crescimento de tilápia-do-nilo e com isso orientar práticas de manejo mais sustentáveis. Com vistas à sustentabilidade ambiental da atividade, a implantação de boas práticas de manejo tais como o melhor controle da quantidade de alimento ofertado levaria a menor perda de NT e PT para a água. Além disso, o uso de rações de melhor qualidade permitiria maior eficiência de assimilação desses nutrientes.
1. Introduction
Aquaculture is a growing economic sector, responsible by producing healthy food and nutritionally rich in protein. However, as in any other activity directed to agricultural production, if not well managed, it can cause environmental damage (Gorlach-Lira et al., 2013; FAO, 2014). In search of sustainable aquaculture, it is necessary to consider the production, social development and environment al protection (Valenti, 2000).
The Nile tilapia (Oreochromis niloticus Linnaeus, 1758) is one of the main species reared in Brazil due to its ease of reproduction and obtaining fingerlings. Possibility of hormonal sex manipulation to obtain male populations, good acceptance of several types of food, great ability to harness natural foods in ponds, feed conversion ratio between 1.0:1 to 1.8:1 and the good growth in intensive cultivation, support intensive handling and low levels of dissolved oxygen in production and its high resistance to disease, besides its white flesh, firm texture, without thorns, slightly sharp taste and good acceptance (Souza, 2002; Souza et al., 2004; Simões et al., 2007).
In natural ecosystems, the magnitude of the aquaculture impacts depends on the produced species, the production method, the hydrography of the region, the type of feed provided and management practices (Macedo and Sipaúba-Tavares, 2005; Cao et al., 2007). Management practices such as fertilization of ponds, increases of the water flow to prevent algal blooms and the quality and quantity of feed promote the increase of the nutrients in the water. Thus, a small part of these nutrients entering via the feed is effectively reversed into fish biomass; the remainder is retained in the sediment or exported via effluent.
In 2008, the global aquaculture production of fish and crustaceans resulted in an environmental load of 1.7 million tons of nitrogen (TN) and 0.46 million tons of phosphorus (TP) (Verdegem, 2013). In 2010, the annual global export of nutrients to the environment arised from freshwater aquaculture was 5 million tons of TN and 0.9 million tons of TP (Bouwman et al., 2013). The control of generation of this environmental load is a needed strategy to maintain the sustainable growth of aquaculture (Amirkolaie, 2011; Pornpinatepong et al., 2016). Procedures to reduce nitrogen and phosphorus levels in the water of the production will act on the control of eutrophication, minimizing the impact on the environment (Pereira et al., 2012; Alexander et al., 2016).
Quantify the impacts generated by aquaculture activity through environmental indicators is a useful tool with regard to environmental sustainability (Boyd and Queiroz, 2001; Boyd et al., 2007). In Brazil, although scarce studies performed in trout farming (Caramel et al., 2014; Moraes et al., 2015, 2016), in bullfrog farming (Borges et al., 2012; Mercante et al., 2014) and in polyculture system (tilapia and shrimps) (Araújo-Silva et al., 2014), showed that environmental indicators can be a useful tool for characterizing the impact, since it allows the comparison of different systems, methods of creation, evaluation of
the effectiveness of management practices used in the production system, descriptions of general standards and as reference values (Boyd et al., 2007; Kimpara et al., 2010).
Thus, the aim of this study was utilized environmental indicators as a quantitative method to evaluate and discuss the nitrogen and phosphorus flux by a production stage grow-out (termination) of Nile tilapia (Oreochromis niloticus) in fishpond. The nutrient load, the mass balance, the input of nutrients via feed and the converted nutrients in fish biomass are the environmental indicators applied in this study.
2. Material and Methods
2.1. Study areaThe present study was performed in Nile tilapia production system in excavated fishpond, located in Pindamonhangaba city, São Paulo State (SP), Brazil (22°56’27”S and 45°26’32.2”W).
2.2. Description of production system and feed management
The adopted production system was the semi-intensive, in production stage grow-out with monosex male of Nile tilapia (Oreochromis niloticus), with initial average weight of 191.00 g, stocked at a density of 2.5 fish m–2. The dimensions
of the fishpond presented an area of 1,500 m2, average
depth of 1.08 m and volume of 1,620 m3. The water flow
values were determined by the volume meter method based on the time spent by a determined water flow to fill a recipient of a known volume. The estimated residence time of the water was seven days (average water flow of 2.7 L s–1). The water renewal of the fishpond was constant
and without mechanical aeration. The effluents generated by the production system was released on the water receiving body (Ribeirão do Borba), that is a tributary of Ribeirão do Curtume, which in turn, integrates one of the sub-basins of the Rio Paraíba do Sul, São Paulo State, Brazil.
During the fattening period, it was used a commercially formulated fish feed of the brand ADIMAX, extrused
containing 28% of crude protein, 12% of humidity, 5% of ethereal extract, 6% of crude fiber, 12% of mineral matter, 3% of calcium, 0.80 mg g–1 of feed of folic acid and at
least of 0.8% of TP, offered twice daily, ranging from 1.5 to 2.5% of the estimated total biomass, considering the population developmental stage (size/age) and the estimate of the biomass produced. To estimate the total biomass, fishes were measured periodically, considering the analysis of a batch containing 10% of the total population of the fishpond. Tilapia growth data were used to compare the nitrogen and phosphorus loads between growth phases; it was conditioned the term “phase” for the period between the achievements of biometrics. Thus, grow-out period (128 days) was divided into four phases: phase I (191-335 g), phase II (335-474 g), phase III (474-569 g) and phase IV (569-663 g) (see Table 1). The weight gain (g), specific growth rate (SGR) (% day), biomass gain (g), feed conversion ratio (FCR), final biomass (g m–2) and
2.3. Sampling and limnological variables
The analyses were performed during grow-out period of 128 days from October/2006 to February/2007. In the first 14 weeks, the water samplings were monthly and from the 14th week until the end of the grow-out period,
the samplings have become weekly, to monitor the effects of increased feed amounts offered in this phase. The water samplings were performed in affluent and effluent of the fishpond at 10:00 h.
Water samples were collected in the subsurface water column and then, were frozen. In the laboratory, total phosphorus (μg L–1) and total nitrogen (μg L–1) were
determined according to Valderrama (1981).
2.4. Environmental indicators
Nutrient loads were determined by the product of the water flow values (L s–1) and the total phosphorus - TP
and total nitrogen - TN concentrations (μg L–1) in affluent
(LA) and in effluent (LE) of Nile tilapia production system in fishpond, through the following Equation 1:
[ ]
= × F
L W (1)
where L = loads of TP and TN (g. dia–1), [ ] = nutrient
concentrations (µg.L–1), W
F = water flow (L s –1).
Subsequently, to quantify the amount of waste generated by the fish farming activity, mass balance was calculated (g d-1) of TP and TN through the nutrient load that leaves
via effluent and subtracted from the water supply system, according to the Equation 2:
= −
L E A
MB L L (2)
where MBL = mass balance among loads of TP and TN (g d-1), L
E = the considered variable load in the effluent
of the system (g d-1), L
A = the considered variable load in
the affluent of the system (g d-1).
The nutrient load of production system via feeding was estimated by the amount of phosphorus and nitrogen contained in the total feed offered (Equation 3), of the levels of these nutrients that were converted into fish biomass (Equation 4) and of the lost via effluent (Equation 2) (Boyd and Queiroz, 2001; Boyd et al., 2007). It was assumed that the Nile tilapia presents 25% (0.25 kg) of dry matter,
whereas the dry matter containing 3.0% (0.030 kg) of phosphorus and 8.5% (0.085 kg) of nitrogen (Boyd and Queiroz, 2001; Boyd et al., 2007). The commercial feeds used in Nile tilapia production system contained 0.9% (0.009 kg) of phosphorus and 4.8% (0.048 kg) of nitrogen per kg of feed. The production of fish and feed offered were applied in the present study using the following equations:
= ×
F O F
I F N (3)
where IF = input of nutrient via feed (kg of TP or TN),
FO = amount of feed offered (kg), NF = amount of nutrient (kg) by kilogram of feed.
= × ×
B DM
N P DM N (4)
where NB = converted nutrient in fish biomass (kg of TP
or TN), P = fish production (kg), DM = amount of dry matter by kilogram of fish (kg), NDM = amount of nutrient
(TP or TN) by kilogram of dry matter of fish (kg).
2.5. Statistical analysis
A descriptive analysis was applied to the production results (amount of feed offered), and mass balance of the loads of TN and TP using the statistical program Statistica
version 7.1. Then data normality was checked by the Shapiro-Wilk test. For normal data (p > 0.05), the Pearson correlation was computed between the amount of feed offered along the production and the mass balance results. Data were transformed to log (x+1), when necessary. When (r) presented p < 0.05, the scatter plot was constructed showing the relationship between the variables (Zar, 2010).
3. Results
Nile tilapia production after 128 days was of 11,013 kg ha-1
of fish biomass and was used a total of 18 t ha-1 of feed, and
the FCR of the production was 1.63:1. The best values of FCR and SGR were observed in the first phase of growth. After the second half of production was observed decrease in nutrients assimilation efficiency from feed, as showed the FCR and SGR values (see Table 1).
The largest loads of TN and TP were observed in effluent of the fishpond, when compared to the affluent (see Figure 1). The mass balance calculation showed that
Table 1. Zootechnical performance data of the Nile tilapia in grow-out period in semi-intensive production system and excavated fishpond.
Parameters Phase I Phase II Phase III Phase IV
Initial average weight (g) 191 335 474 569
Final average weight (g) 335 474 569 663
Weight gain (g) 145 139 95 93
Ultimate survival (%) - - - 93
Production time (days) 44 73 102 128
Feed (kg ha d–1) 112 156 199 239
FCR 1.20:1 1.30:1 2.14:1 2.21:1
SGR 1.3 1.2 0.62 0.62
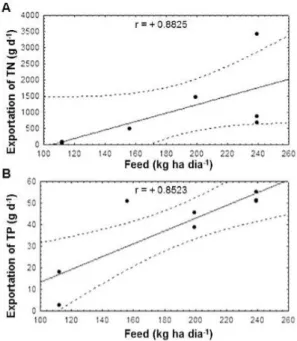
tilapia production in grow-out period (128 days), exported a total of 15,931 g TN and 4,189 g TP. The amount of feed offered and the export of nutrients showed a positive and significant correlation (r = 0.8825 for TN and r = 0.8523 for TP (see Figure 2A, B).
Based on the proposed indicators by Boyd and Queiroz (2001) and Boyd et al. (2007) for nitrogen and phosphorus, during the final phase of growth, 133 kg TN (100%) entered the system via feed (during fish feeding) and from these, 35 kg TN (26%) were reversed into fish biomass, 82 kg TN (62%) were retained in the fishpond and 16 kg TN (12%) were exported via effluent. For TP, 28 kg (100%) had as the source the feeding and from these, 13 kg TP (45%) were reversed into fish biomass, 11 kg TP (40%) were retained in the fishpond and 4 kg TP (15%) were exported via effluent (see Table 2).
Figure 1. Total nitrogen (A) and phosphorus (B) loads
in affluent (black) and in effluent (gray) of Nile tilapia production system during grow-out period.
Figure 2. Linear correlation between feed offered and the
exportation of total nitrogen (TN) (A) and total phosphorus (TP); (B) in Nile tilapia production system during grow-out period. (Dashed line = significance level of 95%).
Table 2. Total nitrogen (TN) and phosphorus (TP) inputs in the Nile tilapia production system via feed and its main exit routes.
Total introduced in the
fishpond via feed (kg) Total reversed in fish biomass (kg) Total exported via effluent (kg) fishpond and/or lost (kg)Total retained in
(TN) (TP) (TN) (TP) (TN) (TP) (TN) (TP)
Phase I 30.67 6.39 10.77 3.80 0.20 0.47 19.70 2.12
Phase II 28.18 5.87 10.35 3.65 1.68 1.01 16.14 1.21
Phase III 35.86 7.47 7.08 2.50 4.64 1.32 24.14 3.65
Phase IV 37.87 7.89 6.95 2.45 8.88 1.30 22.05 4.14
Total 133.00 28.00 35.00 13.00 16.00 4.00 82.00 11.00
4. Discussion
The better utilization of nutrients from feed by tilapia occurred at the beginning of the grow-out period (phases I and II), period when smaller quantities of feed were offered (112 kg ha d–1) and recorded the smaller nutrient
loads (TN and TP) exported via effluent. The amount of feed offered has achieved 239 kg ha d-1 with the increase
The percentages of nutrients in the feed and converted into fish biomass observed in the present study of 26% TN and 46% TP are similar to the data registered by Boyd et al. (2007), whom estimated that 23% of TN and 40% TP introduced in the fishponds as feed were converted in tilapia biomass. In the salmon farming industry in Norway, Wang et al. (2012), have found that 38% TN and 30% TP which entered the system in the form of feed were reversed into fish biomass and the remaining, 62% TN and 70% TP, were released to the environment. In this case, the lowest use of TP can be related to the fact that carnivorous fish (like salmon) require larger amounts of this element in the diet.
Consider the total of nutrients released to the environment by the production system is fundamental. In the present study, 16% TN and 11% TP which entered the system in the form of feed were exported by effluent, percentages similar to those observed by Boyd and Queiroz (2001). These values, even with low contribution within the total generated, represented great amount when considering the total production.
Mean percentages of 62% TN and 39% TP were retained or were lost in the fishpond, either by the assimilation of the plankton community, sedimentation of nitrogen and phosphorus or by the volatilization and/or denitrification of inorganic nitrogen compounds (Boyd and Queiroz, 2001; Rodrigues et al., 2010) and, can represent serious environmental problems. During the withdrawal of fish period, large volumes of water are dropped to the environment and, in many cases without prior treatment, can lead to situations where the pollutant concentrations are high enough to generate localized impacts (Boyd et al., 2007; Santos and Camargo, 2014).
The waste production arising aquaculture can be reduced based on nutritional strategies, as in the formulation of nutrients and the development of efficient feeding systems based on energy requirements of the species (Bouwman et al., 2013). However, it is common to use feeds using alternative and conventional foods of vegetal origin, as cottonseed meal, sunflower meal, peanut meal in replacement of soybean meal and fishmeal, to reduce production costs (Abimorad et al., 2012). These foods, which present about 70% or more of phosphorus, cannot be fully absorbed by monogastric animals, as they are in the form of phytate, non-hydrolysable substance in fish intestine (Storebakken et al., 1998; Bock et al., 2007). An alternative would be to reduce the percentage of phosphorus in the diet, fact would decrease the final costs of production without compromising feed quality. Reduction of 0.4% of phosphorus in the diet, from 1.2% to 0.8%, can lead to diminution of this element in the effluent of fishpond up to 55%, without harming the growth performance of animals (Bueno et al., 2012).
There is a direct relation between the pollution potential of feed and feed conversion rates. Better feed conversion was related to lower supply of nutrients to the environment (phases I and II). This relation would minimize the negative impacts on farming systems and
aquatic ecosystems, where improvement in the FCR from 2.1:1 to 1.7:1 can lead to reduction of 20% in aquaculture waste (Mungkung et al., 2013). Some authors (i.e. Souza, 2002; Souza et al., 2004; Boyd et al., 2007; Simões et al., 2007) has considered the FCR 1.8:1 as an acceptable rate in tilapia production. Thus, some estimates can be elaborated from applied indicators, for example, considering 1.8:1 as a reference value, during phase III and IV, where FCR was 2.14:1 and 2.21:1, respectively, had being left to supply 1.649 kg ha–1 of feed, which result in a reduction of 16%
N and 15% P would enter the fishpond via feed, and of these about 9.53 kg ha–1 of N and 2.23 kg ha–1 of P would
have being left to be released directly to the effluent. These indicators can also be applied in the design of wastewater treatment systems, for example, in a excavated fishpond of 10,000 m2, Nile tilapia in grow-out period, with average
weight of 600.00 g, stocked at a density of 2.5 fish m-2
and feed rate of 1.5% total biomass, considering that approximately 12% N and 15% P that enter in a fishpond via feed are discarded directly in the effluent, the treatments system have to be designed to remove about 130 g of N and 30 g of P per day.
In Brazil, indicators proposed by Boyd and Queiroz (2001) and Boyd et al. (2007) were evaluated by Moraes et al. (2016), in a trout farming system (Oncorhynchus mykiss) and was observed that from the total N and P offered feed, 25% of N and 38% of P were converted into fish biomass and 75 of N and 62% of P were exported via effluent. These authors attributed the values to the management practices, such as excessive amount and low quality of feed offered. Thus, based on the results reported, the use of the indicators showed to be an efficient tool to quantify TN and TP flux produced by different grow-out techniques. These indicators also provide ways to assess the potential of aquaculture wastewater to pollute waterbody receiver, and can be employed as discriminant of the environmental viability during the phase of installation and deployment of fish farms.
The estimate of the load through environmental indicators is efficient and promising for the future of the activity, where the use of water management practices can be a strategy for reducing nutrient loads of aquaculture productions (Flora and Kröger, 2014). Is evident the need of implementation of best management practices in aquaculture. According to Wang and Lu (2015), systems using tilapia in polyculture increase feed efficiency, improving the water quality, the total yield of production and profits. Besides, it is necessary to use wastewater treatment systems using constructed wetlands (Henry-Silva and Camargo, 2006), allowing the reuse of water by the system and/or the water release in appropriate conditions to the current legislation.
simplify the comparison between the different species and production systems. We conclude that the management should be better oriented to seeking a better use of feed and order to prevent waste production. As mitigating measures adaptations must be suggested in the management with regard to the best control of the amount of feed offered avoiding loss of nutrients to the water, and the use of feed with better quality allowing greater efficiency of nutrients assimilation.
Acknowledgements
We thank to CAPES (Coordination of Higher Education Personnel Training) by the Masters scholarship to the first author and to FAPESP (Research Support Foundation in São Paulo) by financial support (2005/05180-0 and 2005/03011-7).
References
ABIMORAD, E.G., GONÇALVES, G.S. and CASTELLANI, D., 2012. A crise dos alimentos e os reflexos na aquicultura brasileira. Pesquisa e Tecnologia, vol. 9, no. 2, pp. 1-4.
ALEXANDER, K.A., ANGEL, D., FREEMAN, S., ISRAEL, D., JOHANSEN, J., KLETOU, D., MELAND, M., PECORINO, D., REBOURS, C., ROUSOU, M., SHORTEN, M. and POTTS, T., 2016. Improving sustainability of aquaculture in Europe: stakeholder dialogues on integrated multi-trophic aquaculture (IMTA). Environmental Science & Policy, vol. 55, no. 1, pp. 96-106. http://dx.doi.org/10.1016/j.envsci.2015.09.006.
AMIRKOLAIE, K.A., 2011. Reduction in the environmental impact of waste discharged by fish farms through feed and feeding. Reviews in Aquaculture., vol. 3, no. 1, pp. 19-26. http://dx.doi. org/10.1111/j.1753-5131.2010.01040.x.
ARAÚJO-SILVA, S.L., MORAES, M.A.B., CARMO, C.F., OSTI, J.A.S., VAZ-DOS-SANTOS, A.M. and MERCANTE, C.T.J., 2014. Effluent of a polyculture system (tilapias and shrimps): assessment by mass balance of nitrogen and phosphorus. Journal of Environmental Protection, vol. 5, no. 10, pp. 799-804. http:// dx.doi.org/10.4236/jep.2014.510081.
BOCK, C.L., PEZZATO, L.E., CANTELMO, O.A. and BARROS, M.M., 2007. Fitase em rações para tilápia-do-nilo. Revista Brasileira de Zootecnia, vol. 36, no. 5, pp. 1455-1461. http:// dx.doi.org/10.1590/S1516-35982007000700001.
BORGES, F.F., AMARAL, L.A. and DE STEFANI, M.V., 2012. Characterization of effluents from bullfrog (Lithobates catesbeianus, Shaw, 1802) grow-out ponds. Acta Limnologica Brasiliensia, vol. 24, no. 2, pp. 160-166. http://dx.doi.org/10.1590/ S2179-975X2012005000035.
BOUWMAN, A.F., BEUSEN, A.H.W., OVERBEEK, C.C., BUREAU, D.P., PAWLOWSKI, M. and GLIBERT, P.M., 2013. Hindcasts and future projections of global inland and coastal nitrogen and phosphorus loads due to finfish aquaculture. Reviews in Fisheries Science, vol. 21, no. 2, pp. 112-156. http://dx.doi.or g/10.1080/10641262.2013.790340.
BOYD, C.E. and QUEIROZ, J.F., 2001. Nitrogen, phosphorus loads vary by system, USEPA should consider system variables in setting new effluent rules. Global Aquaculture Advocate, vol. 4, no. 6, pp. 84-86.
BOYD, C.E., TUCKER, C., MCNEVIN, A., BOSTICK, A. and CLAY, J., 2007. Indicators of resource use efficiency and environmental performance in fish and crustacean aquaculture. Reviews in Fisheries Science, vol. 15, no. 4, pp. 327-360. http:// dx.doi.org/10.1080/10641260701624177.
BUENO, G.W., FEIDEN, A., NEU, D.H., LUI, T.A., WÄCHTER, N. and BOSCOLO, W.R., 2012. Digestibilidade do fósforo em dietas como estratégia nutricional para redução de efluentes da tilapicultura. Arquivo Brasileiro de Medicina Veterinária e Zootecnia, vol. 64, no. 1, pp. 183-191. http://dx.doi.org/10.1590/ S0102-09352012000100026.
CAO, L., WANG, W., YANG, Y., YANG, C., YUAN, Z., XIONG, S. and DIANA, J., 2007. Environmental impact of aquaculture and countermeasures to aquaculture pollution in China. Environmental Science and Pollution Research International, vol. 14, no. 7, pp. 452-462. PMid:18062476. http://dx.doi.org/10.1065/espr2007.05.426.
CARAMEL, B.P., MORAES, M.A.B., CARMO, C.F., VAZ-DOS-SANTOS, A.M., TABATA, Y.A., OSTI, J.A.S., ISHIKAWA, C.M., CERQUEIRA, M.A.S. and MERCANTE, C.T.J., 2014. Water quality assessment of a trout farming effluent, Bocaina, Brazil. Journal of Water Resource and Protection, vol. 6, no. 10, pp. 909-915. http://dx.doi.org/10.4236/jwarp.2014.610086.
FOOD AND AGRICULTURE ORGANIZATION OF THE UNITED NATIONS – FAO, 2014 [viewed 22 February 2016]. The state of world fisheries and aquaculture. Rome: FAO. 243 p. Available from: http://www.fao.org/3/a-i3720e.pdf.
FLORA, C. and KRÖGER, R., 2014. Use of vegetated drainage ditches and low-grade weirs for aquaculture effluent mitigation: I. Nutrients. Aquacultural Engineering, vol. 60, pp. 56-62. http:// dx.doi.org/10.1016/j.aquaeng.2014.04.006.
GORLACH-LIRA, K., PACHECO, C., CARVALHO, L.C.T., MELO JÚNIOR, H.N. and CRISPIM, M.C., 2013. The influence of fish culture in floating net cages on microbial indicators of water quality. Brazilian Journal of Biology = Revista Brasileira de Biologia, vol. 73, no. 3, pp. 457-463. PMid:24212684. http:// dx.doi.org/10.1590/S1519-69842013000300001.
HENRY-SILVA, G.G. and CAMARGO, A.F.M., 2006. Efficiency of aquatic macrophytes to treat Nile Tilapia pond effluents. Scientia Agricola, vol. 63, no. 5, pp. 433-438. http://dx.doi.org/10.1590/ S0103-90162006000500003.
KIMPARA, J.M., ZADJBAND, A.D. and VALENTI, W.C., 2010. Medindo a sustentabilidade na aquicultura. Boletim Ablimno, vol. 38, no. 2, pp. 1-13.
MACEDO, C.F. and SIPAÚBA-TAVARES, L.H., 2005. Variações de nutrientes e do estado trófico em viveiros sequenciais de criação de peixes. Acta Scientiarum: Animal Sciences, vol. 27, no. 3, pp. 405-411.
MERCANTE, C.T.J., VAZ-DOS-SANTOS, A.M., MORAES, M.A.B., PEREIRA, J.S. and LOMBARDI, J.V., 2014. Bullfrog (Lithobates catesbeianus) farming system: water quality and environmental changes. Acta Limnologica Brasiliensia, vol. 26, no. 1, pp. 9-17. http://dx.doi.org/10.1590/S2179-975X2014000100003.
MORAES, M.A.B., CARMO, C.F., ISHIKAWA, C.M., TABATA, Y.A. and MERCANTE, C.T.J., 2015. Daily mass balance of phosphorus and nitrogen in effluents of production sectors of trout farming system. Acta Limnologica Brasiliensia, vol. 27, no. 3, pp. 330-340. http://dx.doi.org/10.1590/S2179-975X1415.
indicators in effluent assessment of rainbow trout (Oncorhynchus mykiss) reared in raceway system through phosphorus and nitrogen. Brazilian Journal of Biology = Revista Brasileira de Biologia. http://dx.doi.org/10.1590/1519-6984.07315.
MUNGKUNG, R., AUBIN, J., PRIHADI, T.H., SLEMBROUCK, J., VAN DER WERF, H.M. and LEGENDRE, M., 2013. Life cycle assessment for environmentally sustainable aquaculture management: a case study of combined aquaculture systems for carp and tilapia. Journal of Cleaner Production, vol. 57, pp. 249-256. http://dx.doi.org/10.1016/j.jclepro.2013.05.029.
PEREIRA, J.S., MERCANTE, C.T.J., LOMBARDI, J.V., VAZ-DOS-SANTOS, A.M., CARMO, C.F. and OSTI, J.A.S., 2012. Eutrophization process in a system used for rearing the Nile tilapia (Oreochromis niloticus), São Paulo State, Brazil. Acta Limnologica Brasiliensia, vol. 24, no. 4, pp. 387-396. http:// dx.doi.org/10.1590/S2179-975X2013005000006.
PORNPINATEPONG, K., KIRIPAT, S., TREEWANCHAI, S., CHONGWILAIKASAEM, S., PORNSAWANG, C., CHANTARASAP, P. and CHANDEE, C., 2016. Pollution control and sustainable fishery management in Southern Songkhla Lake, Thailand. In: N. OLEWILER, H.A. FRANCISCO and A.J.G. FERRER, eds. Marine and Coastal Ecosystem valuation, institutions, and policy in Southeast Asia: part II. Singapore: Springer. p. 155-183. http:// dx.doi.org/10.1007/978-981-10-0141-3_8
RODRIGUES, C.J., MERCANTE, C.T.J., CARMO, C.F., OSTI, J.A.S. and DI GENARO, A., 2010. Diurnal dynamic of nitrite and ammonia gas in a Nile tilapia fish pond in subtropical region. Limnetica, vol. 5, pp. 1-9.
SANTOS, A.A.O. and CAMARGO, A.F.M., 2014. Constructed wetlands for treatment of harvest effluents from grow-out ponds of the Amazon river prawn. Aquaculture Research, vol. 46, no. 11, pp. 1-9. http://dx.doi.org/10.1111/are.12423.
SIMÕES, M.R., RIBEIRO, C.F.A., RIBEIRO, S.C.A., PARK, K.J. and MURR, F.E., 2007. Composição físico-química, microbiológica e rendimento do filé de tilápia tailandesa (Oreochromis niloticus). Ciência e Tecnologia de Alimentos, vol. 27, no. 3, pp. 608-613. http://dx.doi.org/10.1590/S0101-20612007000300028.
SOUZA, M.L.R., 2002. Comparação de seis métodos de filetagem, em relação ao rendimento de filé e de subprodutos do processamento da Tilápia-do-Nilo (Oreochromis niloticus). Revista Brasileira de Zootecnia, vol. 31, no. 3, pp. 1076-1084. http://dx.doi.org/10.1590/S1516-35982002000500003.
SOUZA, L.M.R., BACCARIN, A.E., VIEGAS, E.M.M. and KRONKA, S.N., 2004. Defumação da Tilápia do Nilo (Oreochromis niloticus) inteira eviscerada e filé: aspectos referentes às características organolépticas, composição centesimal e perdas ocorridas no processamento. Revista Brasileira de Zootecnia, vol. 33, no. 1, pp. 27-36. http://dx.doi.org/10.1590/S1516-35982004000100005.
STOREBAKKEN, K.D., SHEARER, K.D. and ROEM, A.J., 1998. Availability of protein, phosphorus and other elements in fish meal, soy protein concentrate and phytase treated soy protein based diets to Atlantic salmon, Salmo salar. Aquaculture
(Amsterdam, Netherlands), vol. 161, no. 1-4, pp. 365-379. http:// dx.doi.org/10.1016/S0044-8486(97)00284-6.
VALDERRAMA, J.C., 1981. The simultaneous analysis of total nitrogen and phosphorus in natural water. Marine Chemistry, vol. 10, no. 2, pp. 109-122. http://dx.doi.org/10.1016/0304-4203(81)90027-X.
VALENTI, W.C., 2000. Aquaculture for sustainable development. In: W.C. VALENTI, C.R. POLI, J.A. PEREIRA and J.R. BORGHETTI. Aquicultura no Brasil: bases para um desenvolvimento sustentável. Brasília: CNPq/Ministério da Ciência e Tecnologia. p. 25-32. VERDEGEM, M.C.J., 2013. Nutrient discharge from aquaculture operations in function of system design and production environment. Reviews in Aquaculture, vol. 5, no. 3, pp. 158-171. http://dx.doi. org/10.1111/raq.12011.
WANG, M. and LU, M., 2015. Tilapia polyculture: a global review. Aquaculture Research. http://dx.doi.org/10.1111/are.12708.
WANG, X., OLSEN, L.M., REITAN, K.I. and OLSEN, Y., 2012. Discharge of nutrient wastes from salmon farms: environmental effects, and potential for integrated multi-trophic aquaculture. Aquaculture Environment Interactions, vol. 2, no. 3, pp. 267-283. http://dx.doi.org/10.3354/aei00044.