http://dx.doi.org/10.1590/bjb.2014.0086 Original Article
Preferential prey selection by
Desmodus rotundus
(E. Geoffroy,
1810, Chiroptera, Phyllostomidae) feeding on domestic
herbivores in the municipality of São Pedro – SP
Mialhe, PJ.
a*
a Laboratório de Análise e Planejamento Ambiental – LAPA, Universidade Federal de São Carlos – UFSCar, Campus São Carlos, Rodovia Washington Luis, Km 235, CP 676, CEP 13565-905, São Carlos, SP, Brazil
*e-mail: [email protected]
Received: August 27, 2012 – Accepted: April 19, 2013 – Distributed: August 31, 2014
Abstract
In order to verify possible preferential prey selection by Desmodus rotundus feeding on domestic herbivores in the Municipality of São Pedro (São Paulo, Brazil), vampire bat attacks were surveyed at rural properties where domestic herbivores were being raised and attack frequencies of D. rotundus on the total herd and on different species were calculated. The analysis found that the most frequently attacked herbivores were cattle and horses. The chi-square test
(χ2), with a significance level of 5% corroborated the comparative analysis of attack frequency in properties that had these two species. Of the two, horses were attacked more frequently, which could be a sign that D. rotundus exhibits preferential prey selection when attacking domestic herbivores. This evidence is also supported by the Optimal Foraging Theory, in which the net rate of energy consumed is higher for horses than it is for cattle. Additionally, we propose that the thinner integument of horses (relative to that of cattle) may facilitate bites by D. rotundus and thus contribute to the observed prey preference.
Keywords: cattle, horse, optimal foraging, vampire bat.
Seleção de presas preferenciais por
Desmodus rotundus
(E. Geoffroy,
1810, Chiroptera, Phyllostomidae) alimentando-se de herbívoros
domésticos no município de São Pedro - SP.
Resumo
A fim de verificar possível seleção de presa preferencial por Desmodus rotundus alimentando-se em herbívoros domésticos
no Município de São Pedro (São Paulo, Brasil), foram pesquisados ataques de morcegos hematófagos em propriedades rurais nas quais os herbívoros domésticos estavam sendo criados e foram calculadas as frequências de ataques por
D. rotundus no rebanho total e nas diferentes espécies. A análise mostrou que os herbívoros mais frequentemente
atacados eram os bovinos e equinos. O teste do qui-quadrado (χ2) com um nível de significância de 5% corroborou
a análise comparativa da frequência de ataque em propriedades que possuíam estas duas espécies. Destas duas, os cavalos foram atacados com maior frequência, o que poderia ser um sinal de que D. rotundus apresenta seleção de
presas preferenciais ao atacar herbívoros domésticos. Esta evidência também é apoiada pela Teoria do Forrageamento Ótimo, em que a taxa de energia líquida consumida é maior para cavalos do que para o gado. Além disso, propomos que o tegumento mais fino de cavalos (em relação à de bovinos) pode facilitar a mordidas por D. rotundus e, assim,
contribuir para a preferência da presa observada.
Palavras-chave: bovinos, equinos, forrageamento ótimo, morcego hematófago.
1. Introduction
The vampire bats belong to the order Chiroptera, family Phyllostomidae, subfamily Desmodontinae. The family Phyllostomidae is an endemic clade to the New World, widely distributed from the Southwest of the United States of America (Hall, 1981; Patten, 2004) to the North of Argentina (Barquez et. al., 1999; Reis et al., 2007).
The bats belonging to the subfamily Desmodontinae are distinguished from other species of Neotropical bats by the rudimentary nature of the nose-leaf, the lack of
a tail, and a reduced uropatagium. Additionally, the limbs are sturdy and well developed and the thumbs are elongated. These adaptations are related to the quadrupedal locomotor ability of Desmodus during walking, jumping and climbing. (Altenbach, 1979; Greenhall et al., 1983; Riskin et al., 2006).
youngii and Diphylla ecaudata. D. rotundus feeds on a wide range of prey, because this species is far more generalist than the other two vampire species (Gardner, 1977; Costa and Esbérard, 2011)
Desmodus rotundus is a strictly hematophagous species (Gardner, 1977; Brass, 1994; Mayen, 2003), being considered a predator and also a classical obligate parasite (Turner, 1975). Survival and reproduction of all animals are only possible when there is availability of usable energy. For predators to capture the largest number of prey, they
have developed specific strategies. The set of strategies used by an individual to find, capture, subdue, swallow
and counteract the defense mechanisms developed by the prey is named “foraging” (Pough et al. 2003).
In foraging activity, when potential prey are identified,
predators need to make decisions. These decisions can be
analysed by humans in terms of costs and benefits, and it
takes into account physiological aspects (hunger, satiation and energy cost) and environmental aspects (presence or absence of potential predators and habitat quality, which is ascertained according to the available quantity of prey) (Chaves and Alves, 2010).
For the appropriate measure of “efficiency” on foraging
behaviour, the net rate of consumed energy is generally employed – i.e., the amount of energy obtained per time unit, after having considered the energy used by the predator in the foraging activity. The expression optimal foraging is used for behavioural patterns that have been particularly favoured by natural selection, and it is admitted that they have been favoured due to yielding the highest net rate on energy gain (Townsend et al., 2006).
The diet amplitude is one of the categories of analysis of Optimal Foraging Theory, once it considers the variation range of food types consumed by a predator. To obtain food,
any predator must have time and energy costs: firstly in
the search for prey, and, afterwards, in prey manipulation (that is, chasing, subjugation and ingestion). During the
search, a predator is likely to find a wide variety of food
items. Diet amplitude, therefore, depends on the predator response, once they have found their prey. The generalists, those with broad diet, chase a large proportion of types
of prey they find. Specialists, those with a strict diet, continue the search until they find their preferential prey
(Townsend et al., 2006).
MacArthur and Pianka (1966) were concerned with the breadth of diet that natural selection could favour if the animal were optimally fed. Their basic approach for optimum use of time and energy relates to a higher net energy gain on foraging activity. Certain food types have lower capture and consumption costs than others, regarding gained food energy. Thus, such food items can be ranked from most to least fruitful, according to the net energy return they provide. The optimal foraging theory proposes the possibility of a forager to learn (by trial and error) which
type of food is more difficult to be found and handled. It
is considered that during the search for food, prey species are discovered in the proportion as they occur. Valuable items are always included in the animal’s diet when found,
as the least valuable items will be included or excluded from the diet, according to the variation of valuable prey availability (Turner, 1975; Townsend et al., 2006).
Variables of the optimal foraging theory, related to the predator investment in searching and handling the prey, can be represented by the following symbols: s1, search time for the most valuable prey; h1, handling time for the most valuable prey; and E1, energy content of the most valuable prey. Handling time for the least fruitful prey is h2, and its energy content is E2. The most valuable prey (E1), once found, will always be included in the predator’s diet. However, the least valuable prey will only be included in the animal’s diet if the most valuable prey is scarce, and the search time is too long. This can be
represented by the equation E2/h2 ≥ E1/(s1 + h1) (Krebs, 1996; Townsend et al., 2006).
MacArthur and Pianka (1966) and Emlen (1966) predicted that animals will be more selective in their diets when food is common and less selective when food is rare. The behaviour of D. rotundus seems to support this prediction. D. rotundus does not only select domestic hosts over wild hosts. It also prefers particular types of cattle breeds, particular age and sex class, and individuals in a particular reproductive status (Turner, 1975; Voigt and Kelm, 2006; Bobrowiec, 2008).
In this sense, are the bats actually selecting or preferring one type of prey over another, or are they merely feeding of available animals only (the ones that are exposed)? A number of observations point to a process of preference or selection. Greenhall (1972) observed that when a variety of hosts is present, the vampire bat is selective; although, when only the least preferred host is available, vampire bats may attack them severely (Turner, 1975; Voigt and Kelm, 2006).
Based on these premises, the present study aims to provide information on the foraging behaviour of Desmodus rotundus.
2. Material and Methods
2.1 Study area
This study was conducted during 2002 in the rural zone of the Municipality of São Pedro, state of São Paulo, located at a longitude of 47° 45’00” West and latitude 22° 42’ 00” South, in an area of approximately 62,000 ha, with altitudes ranging between 450 and 900 metres. The hydrography of this municipality is composed of the Piracicaba river, which forms the southern border with the Municipality of Piracicaba, in addition to the Pinheiros and Espraiado streams, and the small Samambaia river.
2.2 Data collection and analysis
and species of animals present at the properties and the number of attacked animals.
After data collection, the attack frequency of D. rotundus was calculated, considering the total herd and the different domestic herbivore species. Based on the frequency data, it was possible to verify which species were attacked more often. After that, we compared the attack frequencies in properties where there were two of the most often attacked
species, in order to confirm that there was some attack
preference of D. rotundus for these species. For this analysis to be carried out, the chi-square test was performed, which
is a measure of discrepancy between observed and expected
frequencies, with a significance level of 5%.
3. Results
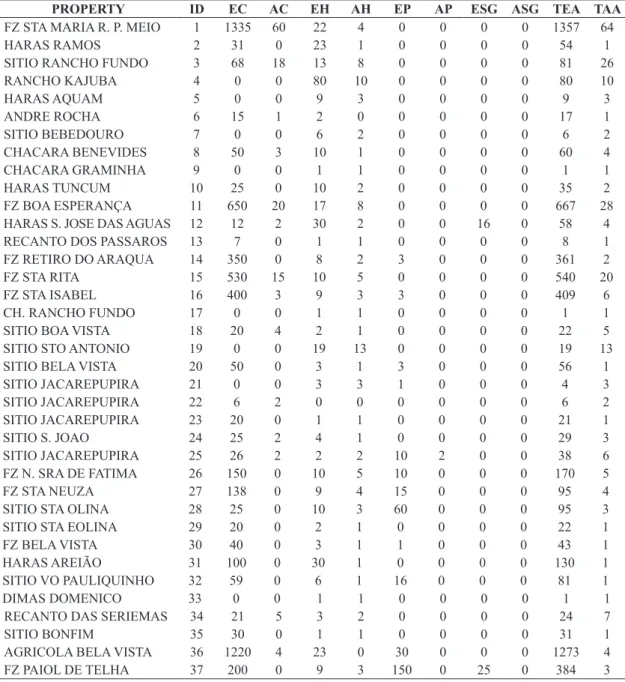
Registration of properties, composition of the exposed herd and number of attacked animals are evidenced in Table 1.
The total herd of the municipality was 12,685 animals:
89.98% were cattle (11,414 animals), 4.78% were horses (607), 4.35% were pigs (552), and 0.88% were small
ruminants (111 sheep and one goat).
Table 1. Registration of properties, composition of the exposed herd and number of attacked animals. ID = property
identification, EC = existing cattle, AC = attacked cattle, EH = existing horses, AH= attacked horses, EP = existing pigs, AP
= attacked pigs, ESG = existing sheep and goats, ASG = attacked sheep and goats, TEA = total exposed animals, TAA = total attacked animals.
PROPERTY ID EC AC EH AH EP AP ESG ASG TEA TAA
FZ STA MARIA R. P. MEIO 1 1335 60 22 4 0 0 0 0 1357 64
HARAS RAMOS 2 31 0 23 1 0 0 0 0 54 1
SITIO RANCHO FUNDO 3 68 18 13 8 0 0 0 0 81 26
RANCHO KAJUBA 4 0 0 80 10 0 0 0 0 80 10
HARAS AQUAM 5 0 0 9 3 0 0 0 0 9 3
ANDRE ROCHA 6 15 1 2 0 0 0 0 0 17 1
SITIO BEBEDOURO 7 0 0 6 2 0 0 0 0 6 2
CHACARA BENEVIDES 8 50 3 10 1 0 0 0 0 60 4
CHACARA GRAMINHA 9 0 0 1 1 0 0 0 0 1 1
HARAS TUNCUM 10 25 0 10 2 0 0 0 0 35 2
FZ BOA ESPERANÇA 11 650 20 17 8 0 0 0 0 667 28
HARAS S. JOSE DAS AGUAS 12 12 2 30 2 0 0 16 0 58 4
RECANTO DOS PASSAROS 13 7 0 1 1 0 0 0 0 8 1
FZ RETIRO DO ARAQUA 14 350 0 8 2 3 0 0 0 361 2
FZ STA RITA 15 530 15 10 5 0 0 0 0 540 20
FZ STA ISABEL 16 400 3 9 3 3 0 0 0 409 6
CH. RANCHO FUNDO 17 0 0 1 1 0 0 0 0 1 1
SITIO BOA VISTA 18 20 4 2 1 0 0 0 0 22 5
SITIO STO ANTONIO 19 0 0 19 13 0 0 0 0 19 13
SITIO BELA VISTA 20 50 0 3 1 3 0 0 0 56 1
SITIO JACAREPUPIRA 21 0 0 3 3 1 0 0 0 4 3
SITIO JACAREPUPIRA 22 6 2 0 0 0 0 0 0 6 2
SITIO JACAREPUPIRA 23 20 0 1 1 0 0 0 0 21 1
SITIO S. JOAO 24 25 2 4 1 0 0 0 0 29 3
SITIO JACAREPUPIRA 25 26 2 2 2 10 2 0 0 38 6
FZ N. SRA DE FATIMA 26 150 0 10 5 10 0 0 0 170 5
FZ STA NEUZA 27 138 0 9 4 15 0 0 0 95 4
SITIO STA OLINA 28 25 0 10 3 60 0 0 0 95 3
SITIO STA EOLINA 29 20 0 2 1 0 0 0 0 22 1
FZ BELA VISTA 30 40 0 3 1 1 0 0 0 43 1
HARAS AREIÃO 31 100 0 30 1 0 0 0 0 130 1
SITIO VO PAULIQUINHO 32 59 0 6 1 16 0 0 0 81 1
DIMAS DOMENICO 33 0 0 1 1 0 0 0 0 1 1
RECANTO DAS SERIEMAS 34 21 5 3 2 0 0 0 0 24 7
SITIO BONFIM 35 30 0 1 1 0 0 0 0 31 1
AGRICOLA BELA VISTA 36 1220 4 23 0 30 0 0 0 1273 4
PROPERTY ID EC AC EH AH EP AP ESG ASG TEA TAA
SITIO BEBEDOURO 38 42 2 0 0 0 0 0 0 42 2
SITIO PAIOL DE TELHA 39 10 0 4 1 1 0 0 0 15 1
FZ PALMEIRAS 40 130 0 7 3 0 0 0 0 137 3
CH. N. SRA. DAS GRAÇAS 41 4 1 2 2 0 0 0 0 6 3
ENGENHO S. PEDRO 42 1226 2 23 1 40 0 0 0 1289 3
SITIO BICUDO 43 73 3 6 4 14 0 0 0 93 7
FZ STA BARBARA 44 140 15 3 0 20 0 0 0 163 15
SITIO GRAMINHA 45 20 1 2 0 9 0 0 0 31 1
HARAS PARAISO 46 10 0 19 1 0 0 0 0 29 1
FZ S. JOSE 47 8 0 5 2 0 0 0 0 13 2
SITIO STO ANTONIO 48 26 4 0 0 0 0 0 0 26 4
SITIO NASCENTE DA SERRA 49 10 1 2 1 0 0 14 0 181 2
SI, STO ANTONIO DE PADUA 50 25 0 2 1 0 0 0 0 27 1
SITIO N. SRA. APARECIDA 51 55 0 4 1 30 0 2 0 91 1
SITIO S. BENTO 52 42 4 1 0 9 3 0 0 52 7
RANCHO S. PEDRO 53 2 1 0 0 0 0 0 0 2 1
FZ DA BARRA 54 260 120 10 5 7 3 0 0 277 128
FZ STA ISABEL 55 36 2 0 0 0 0 0 0 26 2
SITIO ANA ADRIANA 56 55 0 7 3 4 2 1 0 67 5
SITO STA LUZIA 57 0 0 2 2 8 0 0 0 10 2
CH. S. JOAO 58 2 0 9 8 11 0 0 0 22 8
RUA 6 59 0 0 7 1 0 0 0 0 7 1
RUA 4 60 0 0 2 2 0 0 0 0 2 2
FZ MONTE LIBANO 61 450 0 4 1 0 0 20 0 474 1
FZ STA HELENA 62 900 4 12 4 0 0 9 0 921 8
FZ BELO HORIZONTE 63 230 0 12 2 4 0 25 0 271 2
SITIO STA ISABEL 64 80 2 1 1 8 3 0 0 89 6
SITIO S. SEBASTIÃO 65 120 1 1 1 15 0 0 0 135 2
CH. BOA VISTA 66 0 0 3 2 24 0 0 0 27 2
FZ AURORA 67 176 5 5 5 0 0 0 0 181 10
FZ MONJOLINHO 68 180 3 3 0 0 0 0 0 183 3
SITIO TORRÃO DE OURO 69 40 1 2 0 3 0 0 0 45 1
FAZENDINHA 70 80 5 5 2 0 0 0 0 85 7
SITIO JACAREPUPIRA 71 20 3 2 2 12 0 0 0 34 5
CHACARA 3 IRMÃOS 72 1 1 2 2 20 0 0 0 23 3
SITIO AGUA BRANCA 73 35 3 2 0 1 0 0 0 38 3
FZ FLORESTAL 74 0 0 2 2 0 0 0 0 2 2
FZ S. SEBASTIÃO 75 200 6 6 1 0 0 0 0 206 7
PEDRO BRAGANHOLO 76 34 0 3 3 10 0 0 0 47 3
FZ ARAQUA 77 1000 10 25 5 0 0 0 0 1025 15
SITIO PIO XII 78 40 2 1 1 0 0 0 0 41 3
ESTANCIA VALE VERDE 79 0 0 2 1 0 0 0 0 2 1
FZ NOVA PRAINHA 80 29 0 4 2 0 0 0 0 33 2
TOTAL --- 11414 343 607 174 552 13 112 0 12685 530
Table 1. Continued...
During our study, we verified that 530 animals were attacked , or 4.18% of the entire herd. There was no record
of attacks on small ruminants. The cattle species showed the highest number of attacked animals (343), followed by horses (174) and pigs (13), representing, respectively,
64.47%, 32.83% and 2.44% of the total logged attacks.
By calculating the attack percentage of Desmodus rotundus on each individual herd (cattle, horse, pig and small ruminants), we determined that horses suffered the
Data from Table 2 showed that the population of D. rotundus in the Municipality of São Pedro - SP presented a preference of foraging for horses, because there was
significant discrepancy between the expected and the
observed attack frequency on equine and bovine herds, which was proven by applying the chi-square test (p < 0.05).
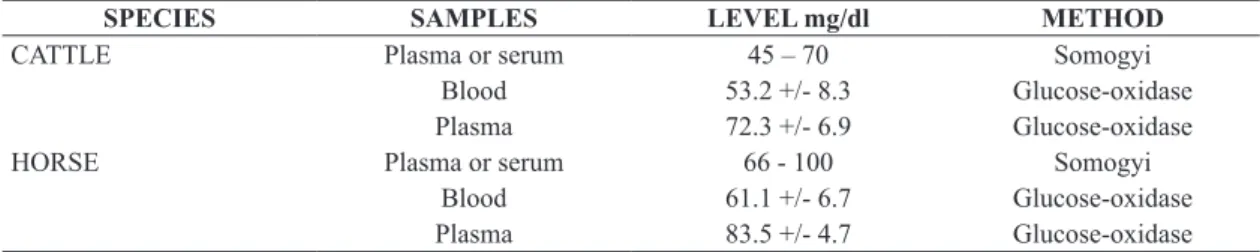
In order to verify whether this preference could be explained through the Optimal Foraging Theory, we have compared the energy values (E) and handling time (h) for the two most often attacked species. In order to compare the energy values of prey, we have used the normal levels of glucose on blood of cattle and horse, as described in Table 3 and 4. In order to compare the handling time
of prey (h), we have verified the thickness of cattle and
horses integument, because a thinner integument would facilitate the incision of Desmodus rotundus, thus reducing the prey handling time.
The thickness of the horse integument varies between 1 and 5 mm on different body areas, being thicker upon the insertion of the mane and the dorsal surface of the tail. The thickness of bovine integument is higher than of any other domestic animals; it generally has between 3 and 4 mm, reaching 5mm at the base of the tail and the tip of the hock, and between 6 and 7 mm at chest height (Getty, 2008).
4. Discussion
The low rate of attacks on pigs and the absence of attacks
on sheep and goats is not an unexpected finding. Turner (1975), in his studies in Costa Rica, reports that, although
sheeps and pigs are occasionally attacked by vampire
bats, the frequency is sufficiently low for excluding these
domestic animals from his examinations. The vampire bats in Costa Rica have primarily attacked cattle and horses, as it was found in our study.
It has been frequently supposed that vampire bats have nowadays a richer supply of blood from domestic animals than autochthonous wild life would have provided them (Dalquest, 1955; Greenhall, 1968; Costa and Esbérard, 2011). The theoretical model here discussed predicts that the higher the absolute abundance of food, the narrower the range of diet items. In other words, the greater the availability of food, the greater the predator selectivity. Therefore, if D. rotundus can be seen as highly selective with various types of domestic animal herds, predictions of the foraging model can be maintained (Turner, 1975). This author reports that, in his research in Costa Rica, horses were the most attacked species; however, a total population
of 30 to 35 horses was insufficient for serving as focus for
his 15-month study. This way, he chose the large cattle population in order to evaluate prey preferences of the vampire bat and the potential bases for these preferences, such as age, sex, reproductive status and location of the prey in the herd.
In the Municipality of São Pedro, 12 out of the 80
researched properties had only horses, and five had only
cattle; the remaining 63 had both. This implies that at these 63 properties, both herds represented the same search time (s1) for D. rotundus, because they are within the same distance from the bat shelter. By analysing the attack frequency on cattle and horse, it is possible to verify a higher attack percentage on horses in 54 out of the 63
properties – that represents 85.71% of the properties in
which cattle and horses are raised; the number of logged attacks on horses was proportionally higher.
Using MacArthur and Pianka’s (1966) Optimal Foraging Theory, and comparing energy values (E) and handling
Table 2. Percentage of attacked animals for each species’ herd. NAH = Number of animals of the herd; NAA = Number of attacked animals; PAASH = Percentage of attacked animals in its species’ herd.
SPECIES NAH NAA PAASH
Cattle 11,414 343 3
Horse 607 174 28.66
Pig 552 13 2.35
Small ruminants 112 0 0
Total 12685 530
---Table 3. Normal levels of glucose in blood, plasma or serum, of cattle and horse (Coles, 1984).
SPECIES SAMPLES LEVEL mg/dl METHOD
CATTLE Plasma or serum 45 – 70 Somogyi
Blood 53.2 +/- 8.3 Glucose-oxidase
Plasma 72.3 +/- 6.9 Glucose-oxidase
HORSE Plasma or serum 66 - 100 Somogyi
Blood 61.1 +/- 6.7 Glucose-oxidase
Plasma 83.5 +/- 4.7 Glucose-oxidase
Table 4. Normal levels of glucose in blood of cattle and horse. Method Enzimatic Automated (Kaneko et al., 2008).
SPECIES SAMPLES LEVEL mg/ dl
CATTLE Blood 45-75
time (h) for each species, it is possible to notice that the energy value of horse blood is higher than it is for cattle blood, because it presents higher blood glucose (Tables 3 and 4). For D. rotundus, the handling of equines appears to be simpler, due to the lower thickness of the horse integument, in comparison to cattle integument, which may facilitate the incision of the bat. Dalquest (1955) and Linhart, Crespo and Mitchell (1972) have also discovered that vampire bats in Mexico prefer calves to adult cattle;
skin thickness may influence this preference (Turner, 1975). Handling of beef cattle, hampers the detection of wounds caused by D. rotundus (for being performed in an extensive form), because the cattle stays most of the time in the pasture, away from direct contact with handlers or the owner. By the fact that the herd of the Municipality of São
Pedro is composed of 90% cattle, and due to the extensive
breeding system, detected attacks of D. rotundus on beef cattle may have been underestimated by handlers; the total
attacks percentage on the cattle herd could exceed 3%.
However, even if this possibility is considered, the attack
frequency is much lower than the 28.66% reported for the
equine herd. Further studies are suggested, under controlled conditions, in order to obtain a better understanding of the foraging behaviour of D. rotundus, including evidence of the bat’s preferential prey among domestic herbivores.
References
ALTENBACH, JS., 1979. Locomotor morphology of the vampire bat Desmodusrotundus. New Mexico: American Society of Mammalogists. p. 1-137. Special Publications, vol. 6.. http:// dx.doi.org/10.5962/bhl.title.39538.
BARQUEZ, RM., MARES, MA. and BRAUN, JK., 1999. The bats of Argentina. Lubbock: Museum Texas Tech University. p. 1-275. Special Publications, vol. 42.
BRASS, DA., 1994. Rabies in bats: natural history and public health implications. Ridgefield: Livia Press. 352 p.
BOBROWIEC, PED., 2008. Caracterização molecular da dieta do morcego hematófago Desmodusrotundus (Mammalia :Chiroptera) na Amazônia brasileira. Manaus: INPA/UFAM.
Tese de Doutorado em Genética.
CHAVES, FG. and ALVES, MAS., 2010. Teoria do Forrageamento Ótimo: premissas e criticas em estudos com aves. Oecologia Australis, vol. 14, no. 2, p. 369-380. http://dx.doi.org/10.4257/ oeco.2010.1402.03.
COLES, EH., 1984. Patologia clínica veterinária. 3. ed. São Paulo: Manole.
COSTA, LM. and ESBéRARD, CEL., 2011. Desmodus rotundus (Mammalia: Chiroptera) on the southern coast of Rio de Janeiro state, Brazil. Brazilian Journal of Biology, vol. 71, no. 3, p. 739-746. http://dx.doi.org/10.1590/S1519-69842011000400020. PMid:21881799
DALQUEST, WW., 1955. Natural history of the vampire bats of eastern Mexico. American Midland Naturalist, vol. 53, no. 1, p. 79-87. http://dx.doi.org/10.2307/2422300.
EMLEN, JM., 1966. The role of time and energy in food preference. American Naturalist, vol. 100, no. 916, p. 611-617. Available from: http://www.jstor.org/discover/10.2307/2459299?uid=2& uid=4&sid=21104391205307. http://dx.doi.org/10.1086/282455.
GARDNER, AL., 1977. Feeding habits. In BAKER, RJ., JONES JUNIOR, JK. and CARTER, DC. Biology of the bats of the New World family Phyllostomatidae. Lubbock: Museum Texas Tech University. 364 p. Special Publications, vol. 3.
GETTy, R., 2008. Anatomia dos animais domésticos. 5. ed. Rio de Janeiro: Guanabara.
GREENHALL, AM., 1968. Problems and ecological implications in the control of vampire bats. International Union for the Conservation of Nature Publications. New Series (Morges), vol. 13, p. 94-102. GREENHALL, AM., 1972. The biting and feeding habits of the vampire bat, Desmodusrotundus. Journal of Zoology, vol. 168, no. 4, p. 451-461.
GREENHALL, AM., JOERMANN, G., SCHMIDT, U. and SEIDEL, MR., 1983. Desmodusrotundus. Mammalian Species, vol. 202, no. 202, p. 1-6. http://dx.doi.org/10.2307/3503895.
HALL, ER., 1981. The mammals of North America. 2nd ed. New york: John Wiley & Sons. 690 p.
KANEKO, JJ., HARVEy, JW. and BRUSS, ML., 2008. Clinical biochemistry of domestic animals. 6th ed. San Diego: Elsevier. KREBS, JR., 1996. Introdução a ecologia comportamental. 3. ed. São Paulo: Atheneu.
LINHART, SB., CRESPO, RF. and MITCHELL, GC., 1972. Control of vampire bats by topical applicaton of an anticoagulant, chlorophacinone. Boletin de la Oficina Sanitaria Panamericana, vol. 6, no. 2, p. 31-38.
MACARTHUR, RH. and PIANKA, ER., 1966. On optimal use of a patchy environment. American Naturalist, vol. 100, no. 916, p. 603-609. http://dx.doi.org/10.1086/282454.
MAyEN, F., 2003. Haematophagous bats in Brazil, their role in rabies transmission, impact on public health, livestock industry and alternatives to an indiscriminate reduction of bat population. Journal of Veterinary Medicine, Series B, vol. 50, no. 10, p. 469-472. http://dx.doi.org/10.1046/j.1439-0450.2003.00713.x. PMid:14720182
PATTEN, MA., 2004. Correlates of species richness in North America bat families. Journal of Biogeography, vol. 31, no. 6, p. 975-985. http://dx.doi.org/10.1111/j.1365-2699.2004.01087.x.
POUGH, FH., HEISER, JB. and MCFARLAND,WN., 2003. A vida dos vertebrados. 3. ed. São Paulo: Atheneu.
REIS, NR., PERACCHI, AL., PEDRO, WA. and LIMA, IP., 2007. Morcegos do Brasil. Londrina. p. 39-43.
RISKIN, DK., PARSONS, S., SCHUTT, WA Jr., CARTER, GG. and HERMANSON, JW., 2006. Terrestrial locomotion of the New Zealand short-tailed bat Mystacina tuberculata and the common vampire bat Desmodus rotundus. The Journal of Experimental Biology, vol. 209, no. Pt 9, p. 1725-1736. http://dx.doi.org/10.1242/ jeb.02186. PMid:16621953