bioregion in Southeast Brazil
Baptista, DF.
a*, Henriques-Oliveira AL.
a,b, Oliveira, RBS.
a, Mugnai, R.
a,
Nessimian, JL.
band Buss, DF.
aa
Laboratório de Avaliação e Promoção da Saúde Ambiental - LAPSA, IOC/FIOCRUZ. Av. Brasil 4365, CEP 21045-900 Manguinhos, RJ, Brazil
b
Laboratório de Entomologia, Departamento de Zoologia, Instituto de Biologia, CCS, UFRJ, Ilha do Fundão, CP 68044, CEP 21970-944 Rio de Janeiro, RJ, Brazil
*e-mail: [email protected]
Received June 19, 2012 – Accepted July 30, 2012 – Distributed August 31, 2013 (With 4 figures)
Abstract
Brazil faces a challenge to develop biomonitoring tools to be used in water quality assessment programs, but few multimetric indices were developed so far. This study is part of an effort to test and implement programs using benthic macroinvertebrates as bioindicators in Rio de Janeiro State. Our aim was first to test the Multimetric Index for Serra dos Órgãos (SOMI) for a different area - Serra da Bocaina (SB) - in the same ecoregion. We sampled 27 streams of dif-ferent sizes and altitudes in the SB region. Despite the environmental similarities, results indicated biological differ-ences between reference sites of the two regions. Considering these differdiffer-ences, we decided to develop an index specific for the SB region, the Serra da Bocaina Multimetric Index (MISB). We tested twenty-two metrics for sensitiv-ity to impairment and redundancy, and six metrics were considered valid to integrate the MISB: Family Richness, Trichoptera Richness, % Coleoptera, % Diptera, IBE-IOC index, EPT / Chironomidae ratio. A test of the MISB in eleven sites indicated it was more related to land-use and water physico-chemical parameters than with altitude or stream width, being a useful tool for the monitoring and assessment of streams in the bioregion.
Keywords:biomonitoring, macroinvertebrates, freshwater ecoregions, watershed management, stream ecology.
Desenvolvimento de um índice multimétrico bentônico para a bioregião da Serra da
Bocaina no Sudeste do Brasil
Resumo
O Brasil enfrenta o desafio de desenvolver ferramentas de biomonitoramento para serem utilizadas em programas de avaliação da qualidade de águas, porém poucos índices multimétricos foram construídos para esta finalidade. Este estudo faz parte de um esforço para testar e implementar programas de biomonitoramento utilizando macro-invertebrados bentônicos como bioindicadores no Estado do Rio de Janeiro. Nosso objetivo foi primeiro testar se as métricas que compõem o Índice Multimétrico da Serra dos Órgãos (SOMI) eram válidas para serem aplicadas em um área diferente - Serra da Bocaina (SB) - pertencente à mesma ecoregião. Nós amostramos 27 riachos de diferentes tamanhos e altitudes na região da Serra da Bocaina. Apesar das similaridades ambientais, os resultados indicaram haver diferenças entre locais de referencia nas duas regiões. Considerando tais diferenças, nós desenvolvemos um índice específico para região da SB, denominado de Índice Multimétrico da Serra da Bocaina (IMSB). Testamos vinte e duas métricas quanto à sensibilidade e redundância. Seis métricas foram consideradas válidas para integrar o IMSB: Riqueza de Famílias, Riqueza de Trichoptera, % Coleoptera, % Diptera, índice IBE-IOC e Taxa EPT / Chironomidae. O teste do IMSB indicou que o índice estava mais relacionado aos parâmetros físicos e químicos da água e ao uso da terra do que com a altitude ou largura dos rios. Assim, consideramos uma ferramenta útil para monitorar e avaliar riachos na bioregião estudada.
1. Introduction
The integrity of aquatic ecosystems can not be ana-lyzed solely based on physical and chemical parameters of the water; it must consider the physical habitat struc-ture, flow and channel modifications, biological alter-ations, and land-use in the watershed (Karr and Dudley, 1981). Among many tools to assess environmental im-pairments, biological indicators may provide useful in-formation on the effects of impacts on the ecosystems. Many organisms may be used as bioindicators, and ben-thic macroinvertebrates are the most commonly used in bioassessment protocols. Macroinvertebrate assembla-ges may be used to indicate the quality of the environ-ment, being particularly efficient for continuously registering environmental conditions (Johnson et al., 1993; King and Richardson, 2003; Gabriels et al., 2010).
Several programs of biological monitoring of aquatic ecosystems were developed from Kolkwitz and Mars-son’s (1909) saprobic system - based on the presence of indicative species and their tolerance to pollution - in-cluding the Biotic Condition Index (Winget and Mangun, 1979); Biological Monitoring Working Party Score Sys-tem - BMWP (Armitage, et al., 1983), Indice Biotico Esteso - IBE (Ghetti, 1997), FBI index (Hilsenhoff, 1987, 1988), among others (Metcalfe, 1989). In the 1980s, the multimetric system (Karr et al., 1986; Karr 1991) became popular, especially in the United States (Plafkin et al., 1989; Barbour et al., 1996; Barbour et al., 1999; Gibson et al., 1996; Blocksom, 2003). This bioassessment frame-work is based on the establishment of reference areas which are compared to impaired sites. Recently, coun-tries of the European Union, following the propositions defined by the European Community Water Framework Directive (EC 2000), adopted multimetric indices based on macroinvertebrates (Böhmer et al., 2004; Buffagni et al., 2004; Hering et al., 2004; Pinto et al., 2004; Vlek et al., 2004) as a primary tool to assess the ecological qual-ity of waters.
In Brazil, research institutes traditionally adapted monometric biotic indices using macroinvertebrates for streams and rivers, specially the BMWP index (Jun-queira and Campos, 1998). Recently, there is a great ef-fort to develop and test bioassessment protocols in Brazil using benthic macroinvertebrates (CETESB 2002; Bap-tista et al., 2007; Mugnai et al., 2008; Buss and Borges, 2008; Moreno et al., 2009, Buss and Vitorino, 2010, Oliveira et al., 2011; Baptista et al., 2011; Ferreira et al., 2011, Couceiro et al., 2012). In Rio de Janeiro State, one multimetric index (Serra dos Órgãos Multimetric Index -SOMI; Baptista et al., 2007) was developed to Serra do Mar area. In this study, we developed and tested a Multi-metric Index for Serra da Bocaina region (MISB), a dif-ferent area in the same ecoregion.
2. Methods
2.1. Study area
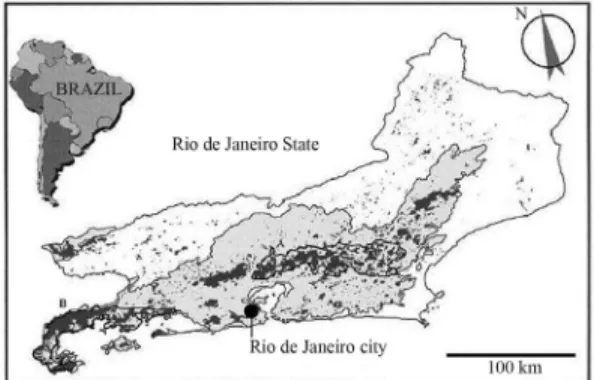
Originally, the Atlantic Rainforest biome covered 1,360,000 km2. Today, this is the most populated area in Brazil - 70% of the population lives in this region - and less than 8% of the biome preserve its original biotic characteristics (MMA/SBF, 2000). This study included two sections of the Serra do Mar mountain chain in Rio de Janeiro State: Serra dos Órgãos (SO) and Serra da Bocaina (SB) (Figure 1). The SO region covers an area of approximately 12,904 km2, with 200 km2protected by the Serra dos Órgãos National Park (located between 22°26’58.43” S and 42°59’08.21” W). The Park protects forests mainly in high slope areas between 200 and 2,263 m.a.s.l. The climate is tropical super humid, with an annual average temperature of 18 °C and annual pre-cipitation between 1,250 and 1,500 mm. The SB region is partially preserved by the Serra da Bocaina National Park, the largest preserved forest fragment in the State (around 1,000 km2, located between and 22°40’-23°20’ S and 44°24’-44°54’ W), with 60% of native vegetation and the remainder consisting of a 30-y regenerated (sec-ondary) forest. The climate is classified as temperate super humid with annual precipitation of 1,800 mm. Av-erage temperature is around 16 °C but with a high varia-tion between lowland areas (36-38 °C, around 200 m.a.s.l.) to upper areas (0-4 °C, with a maximum alti-tude of 2,132 m.a.s.l.) (Guimarães et al., 2000).
2.2. Sample collection and analysis
Benthic samples were collected in 10 sites at SO re-gion (all reference) and 27 sites at SB rere-gion (10 refer-ence, 6 impaired and 11 test sites) during the dry season (June-August 2002 to 2004) using a Surber sampler (900 cm2area, 185
mm mesh). Twelve samples were col-lected at each site, three of each microhabitat (sediment, stone, pool litter and riffle litter), and pooled as one sam-ple per site. Samsam-ples were preserved in the field with
574 Braz. J. Biol., 2013, vol. 73, no. 3, p. 573-583
Baptista, DF. et al.
80% ethanol and were fully examined with stereo-microscope in the laboratory. Identification to the lowest possible taxonomic level were performed using the avail-able taxonomic keys (Odonata - Belle, 1992; Carvalho, 1989; Carvalho and Calil, 2000, Carvalho, et al., 2002, Ephemeroptera - Da Silva et al., 2003; Salles et al., 2004; Plecoptera - Olifiers et al., 2004; Hemiptera - Nieser and De Mello, 1997; Trichoptera - Angrisano, 1995, Wig-gins, 1996; Coleoptera - Passos et al., 2007; other groups - Merritt and Cummins, 1996). All orders were identified to genus level, except for Diptera, Hemiptera and Lepidoptera, which were identified to family level. For Functional Feeding Groups determination, we used data available from Merritt and Cummins (1996) and Baptista et al. (2006) for Ephemeroptera.
In each sampling site, the Riparian Channel Environ-ment Index (Petersen, 1992) and estimates of mean width of riparian cover were performed visually. The RCE in-dex is calculated based on sixteen environmental param-eters such as land-use patterns, stream channel morphol-ogy and riparian vegetation. For each parameter a score is given, summed, and the final score is compared to a table to determine one of the five classes of environmental in-tegrity. Also, altitude (using a Garmin GPS76), river mean depth, width, water discharge (flotation method), pH (LabConte mPA-210p), and water tempera-ture were measured. Water was sampled for further physical and chemical analysis in the laboratory (Con-ductivity, Total-P, Total-N, NH3-N, Cl- using a spectro-photometer Hach DR2500 and Total Alkalinity using titulometric method - FEEMA, 1979). Stream orders were determined using the Strahler system with 1:50,000 scale maps. The %Urban and %Forested areas were de-termined using satellite images (CBERS-2 High Resolu-tion CCD Camera - at 20 m spatial resoluResolu-tion, 5 bands) in 200 m wide buffer zones upstream each sampled sites us-ing the software ArcView 9.1. Range of coordinates of extreme sampled sites was: Serra dos Órgãos -22°27’14” S to 22°15’24” S; 42°56’59” W to 42°08’55” W; Serra da Bocaina 23°17’26” S to 22°50’55” S; 44°43’54” W to 43°59’47” W. Sampling sites varied in altitude (10 to 1,575 m.a.s.l.) and stream order (1stto 5th), but were similar regarding substrate composition, being mainly dominated by stones (boulders, cobble and peb-ble) (Table 1). Sampling through this altitudinal gradient and stream sizes was performed to include these natural variations within the index, allowing a widespread appli-cation in the region.
For both river basins, a site was considered as “refer-ence” by meeting all the following criteria: water pH 6-8; Dissolved Oxygen³4 mg/L; land use with maximum of 20% of the basin area urbanized and³75% of the up-stream basin area forested; width of the riparian range ³ 15 m; no visible channelization, and a Excellent or Very Good classification according to the RCE index (Petersen, 1992). For the “impaired” condition, any of the following a priori conditions should be met:
defores-tation of ³ 75% of the upstream area, and Poor classification according to the RCE index.
2.3. Development of the multimetric index for Serra da Bocaina (MISB)
Based on the procedures described in Klemm et al. (2003), Baptista et al. (2007) and Baptista et al. (2011) we followed four steps to develop the Multimetric Index for Serra da Bocaina (MISB). First we tested if metrics defined in the SOMI (Family Richness, Ephemeroptera + Plecoptera + Trichoptera (EPT) Richness, % Coleoptera, % Diptera, BMWP-CETEC, % Shredders) could be used for SB region. We tested if the composition and structure of the benthic assemblage in 10 reference sites at SO and 10 at SB region were similar and could be treated as the same bioregion (UPGMA Cluster Analysis using Bray-Curtis dissimilarity index for quantitative data and Jaccardsimilarity coefficient for qualitative data; PAST software - Hammer, et al., 2001). Then we calculated each of the 6 metrics used in the SOMI and verified if their values in SB reference sites were within the pre-dicted range for reference conditions. We hypothesized that if the two regions had similar faunal structure and composition, and if the SOMI metric scores were appli-cable for the SB reference sites, this index could be used or adapted for the SB region. However, since differences were found between the two regions, the second step was to test the sensitivity of 22 metrics to detect differences between 10 reference and 6 impaired sites in the SB re-gion, using Mann-Whitney U tests. Tested metrics were: 6 Richness Metrics - Total taxa, Family taxa, roptera taxa, Plecoptera taxa, Trichoptera taxa, Epheme-roptera + Plecoptera + Trichoptera (EPT) taxa; 7 Compo-sition Metrics - % Coleoptera, % Ephemeroptera, % Plecoptera, % Trichoptera, % Odonata, % Diptera and % EPT; 4 Tolerance Metrics-IBE-IOC, BMWP-CETEC, Baetidae / Ephemeroptera, EPT / Chironomidae; and 5 Trophic Metrics-% Shredders, % Collectors, % Preda-tors, % Filterers, % Scrapers. The IBE-IOC (Mugnai et al., 2008) and the BMWP-CETEC (Junqueira and Cam-pos 1998) are biotic indices adapted to Brazil. Metrics that failed to discriminate reference from impaired sites were eliminated. The remaining metrics were evaluated for redundancy using Pearson correlation coefficients. Metrics with a correlation coefficient r³0.8 were consid-ered redundant. In this case, only one metric was in-cluded in the final index, often the easier and less time-consuming to calculate.
576
Braz.
J.
Biol.,
2013,
vol.
73,
no.
3,
p.
573-583
Baptista,
DF.
et
al.
Table 1- Environmental and physical-chemical parameters measured at sites in Serra dos Órgãos and Serra da Bocaina regions, in Rio de Janeiro State, Brazil.
Reference sites used for comparison among areas and for MISB development (SB)
Impaired sites used for MISB development
Test sites for application of the MISB
Parameter Serra dos Órgãos
(n = 10)
Serra da Bocaina (n = 10)
Serra da Bocaina (n = 6)
Reference sites (n = 6)
Intermediate sites (n = 4)
Impaired site (n = 1)
Altitude (m.a.s.l.) 160-1.200 87-1 200 35-506 442-1 575 10-241 10
Stream order 1-5 1-4 1-4 1-3 1-3 3
Mean width (m) 3-15 1.4-4.5 2.3-9 1.3-2.7 2.5-14 3
Mean depth (m) 0.1-0.5 0.03-0.2 0.1-0.3 0.07-0.1 0.1-0.2 0.4
Mean water velocity (m/s) 0.2-0.5 0.2-0.46 0.3-0.4 0.1-0.3 - 0.2
Mean water discharge (m3/s) 0.2-0.7 0.01-0.4 0.2-0.5 0.1-0.4 - 0.3
Water temperature °C 14-18.9 14.5-19 20.4-22.3 19.2-20.6 17.5-20.6 20.6
pH 6.8-7.4 5.1-7.9 6-7.5 7.1-8.1 6.3-7.4 6.5
Dissolved Oxygen (mg/L) 7.5-9.6 6.8-8.8 5.9-7.1 8.12-8.73 6.5-8.2 4.7
Conductivity (mS/cm) 17-34 5-36 20-39 10-32 23-27 67
Total-P (mg/L) 0.01-0.02 0.02-0.05 0.53-1.18 0.02-0.04 0.03-0.04 0.94
Total-N (mg/L) 0.01-0.17 0.00-0.08 2.32-4.46 0.00-0.03 0.79-1.97 36.87
NH3-N (mg/L) 0.00-0.25 0.01-0.06 0.74-3.79 0.06-0.08 0.29-0.35 20.88
Chlorides (mg/L) 1.6-8.7 11.7-19.5 6.84-10.76 11-22 6.84-8.8 13.69
Total Alkalinity (mg/L) 10.0-12.7 30.8-49.3 17.6-19.2 34.9-36.9 17.6 35.2
% Upstream area Urbanized 0-3 0-1 4-30 0-1 5-30 90
% Upstream area Forested 85-100 95-100 5-40 95-100 30-60 0
Riparian width (m) ³50 ³50 2-4 ³50 20-30 0
each set of reference or impaired rivers. The scoring pro-cedure is completed using these distribution metrics and two formulae (see below), to determine whether metric values increase or decrease when degradation increases. The procedure used to apply the index in 11 sites test was achieved in five steps: (1) computing all six core metrics; (2) scoring the metrics using the formula (a) (see below) for metrics that decrease with increasing impair-ment and formula (b) (see below) for metrics that in-crease with increasing impairment; (3) applying a simple
interpolation to adjust values to a range between 0-10 (negative values must be considered zero and the highest value must be considered 10); (4) multiplying the values of each one of the metrics times 1.6 (individual weights) in order to obtain values ranging from 0 to 100; (5) in this last step the values of each metric are summed to obtain a final score for the MISB. This final MISB value that re-sults from the application of the index in each test site falls into one of five quality categories, indicating the ecological integrity of the assessed location.
Formule (a)
Standard metric= Metric result - 25th percentile of impaired sites
75th percentile of reference sites 2- 5th percentile of impaired sites´10
Formule (b)
Standard metric= Metric result - 75th percentile of impaired sites
25h percentile of reference sites 75- th percentile of impaired sites´10
A validation test of the MISB sensitivity was con-ducted in 11 sites located in the altitudinal gradient, judged to be representative of the degradation gradient. These sites were not used to build the index. The test was performed using a Principal Component Analysis (PCA) of environmental variables. The data matrix was stan-dardized by applying (xi-x)/s, wherexiis the observed value,xis the mean andsis the standard deviation. The assessment of the index was done using a Pearson corre-lation between the scores of sites in PCA axis 1 and the MISB scores. Analyses were done using BioEstat 2.0 (Ayres et al., 2000).
3. Results
Cluster Analyses using Bray-Curtis Dissimilarity and Jaccard index were used to verify the similarity of
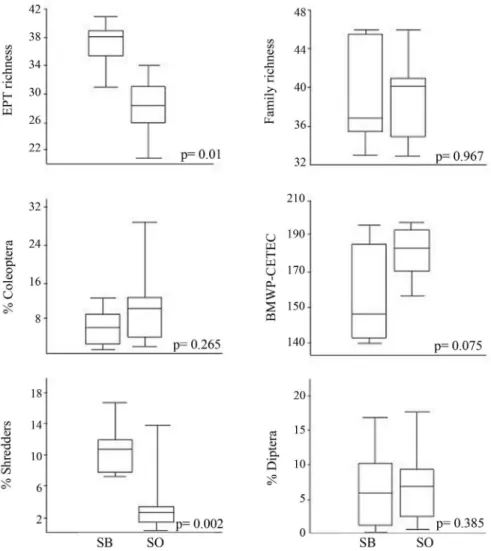
structure and composition of benthic assemblages of 10 reference sites in Serra dos Órgãos (SO) and 10 in Serra da Bocaina (SB). Results showed sites of the two regions distinct biologically (Figure 2). This pattern may be a re-sult of the higher richness of almost all macroinvertebrate orders found in SB reference sites, totaling a mean of 74 taxa per site (range of 64-90 taxa), while SO sites had a mean of 45 taxa per reference site (39-57 taxa). If we only consider total richness of EPT genera found in the two bioregions (65; with 33 Trichoptera, 25 Ephemeroptera and 7 Plecoptera), SB had 64 genera occurring in this re-gion, while only 42 genera were found in SO sampling sites. Other major difference concerned the shredder functional feeding group: despite the small number of shredder taxa at both regions (8 in SB, 6 in SO), their rel-ative abundance was higher in SB (around 10% of the to-tal, while less than 1% of the total was usually found in SO sites).
To check if SOMI metric scores for SB sites were compatible with the predicted range for SO reference sites we applied each of the six metrics used in the SOMI for the SB reference sites. Results showed that values of all metrics calculated for SB reference sites were compat-ible with those expected for reference sites in the SO re-gion, but %Shredders and EPT richness metric values were much higher than the upper threshold expected for reference sites in SB region, indicating that thresholds should be re-dimensioned if these metrics should be used in the region (Figure 3).
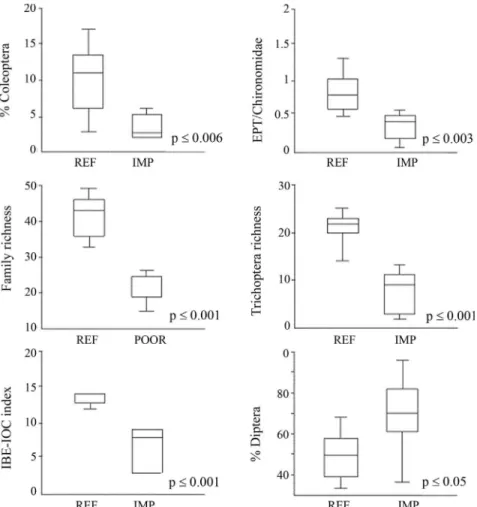
Considering the biological differences between the two regions, we decided to test metrics and to develop an index for the SB region, the Serra da Bocaina Multi-metric Index (MISB). So, we tested the sensitiveness of 22 metrics to detect differences between 10 reference and 6 impaired sites in the SB region. Fifteen metrics were able to discriminate these conditions according to the Mann-Whitney U test (p < 0.05): Total Richness, Family Richness, Ephemeroptera Richness, Plecoptera Rich-ness, Trichoptera RichRich-ness, EPT RichRich-ness, Ratio EPT/Chironomidae, BMWP-CETEC, IBE-IOC, %
Plecoptera, % Diptera, % Coleoptera, % Collector, % Scraper and % Predator. From the six metrics of the SOMI, only % Shredder was eliminated in this step. Then, we performed redundancy tests, using Pearson cor-relation coefficients for metrics from the same category. As expected, Richness metrics (Total, Family, EPT, Plecoptera and Trichoptera Richness) were highly corre-lated. From these five metrics, we chose two metrics to integrate the MISB: the fastest/easiest to calculate, Fam-ily Richness, and one which represented the regional biodiversity (Trichoptera, at genus-level). The BMWP and the IBE-IOC indices were also correlated, and we chose the latter because it was specifically developed for the Rio de Janeiro State. The other chosen metrics (EPT / Chironomidae, % Diptera, % Coleoptera) had low corre-lations with the other three metrics and between them. In summary, after following these steps, six metrics were selected for the MISB: Family Richness, Trichoptera Richness, EPT/Chironomidae, IBE-IOC Index, % Diptera and % Coleoptera (Figure 4). The upper and
lower thresholds were calculated for each metric, based on the distribution of values among reference or impaired sites (Table 2). The sum of scores obtained for each met-ric resulted in the MISB final score, which was divided in five quality classes: Severely Impaired, Impaired, Regu-lar, Good and Excellent (Table 3).
For the test of the MISB was performed a Principal Components Analysis (PCA) on environmental variables (altitude, mean width, water temperature, pH, Conduc-tivity, Total-P, Total-N, NH3-N, Cl-, Total Alkalinity, % Urban upstream area, %Forested upstream area, mean width of riparian cover, and RCE index). The first PCA axis explained 52.8% of the variance (eigenvalue = 7.92) and indicated the gradient of impairment. Highest posi-tive loadings were related to good integrity land-use (% Forested area, Riparian width and RCE index), while highest negative loadings indicated urbanization (%Ur-ban area, Total-Nitrogen and Total-Phosphorus) (Ta-ble 4). The pattern on the second axis (eigenvalue = 4.13, 27.5% variance explained) was unclear. The first PCA
578 Braz. J. Biol., 2013, vol. 73, no. 3, p. 573-583
Baptista, DF. et al.
axis was highly correlated with MISB scores (r = 0.856, p < 0.001).
4. Discussion
Both studied regions were in the same mountain chain, same ecoregion, same vegetation dominium, at similar latitudinal and altitudinal range, and less than 300 km distant from each other. Based on this, we hypothe-sized that they would have similar faunal structure and composition at reference sites, allowing the application
Table 3- The MISB classification system, divided in five classes of environmental stream quality.
Class Scores
Excellent 80-100
Good 60-79
Regular 40-59
Impaired 20-39
Severely impaired 0-19
Table 2- Expected responses with increased impairment and metric value thresholds for the six metrics selected to in-tegrate the Multimetric Index for Serra da Bocaina region (MISB).
MISB metrics Expected response
with impairment
Metric values thresholds
Family richness Decrease Upper = 46 Lower = 19 Trichoptera
richness
Decrease Upper = 23
Lower = 4 EPT/Chironomidae
ratio
Decrease Upper = 1.1
Lower = 0.2
IBE-IOC Decrease Upper = 14
Lower = 2
% Coleoptera Decrease Upper = 13
Lower = 2
% Diptera Increase Upper = 84
Lower = 48
of the SO Multimetric Index, developed for one of those regions (Baptista et al., 2007). However, our results indi-cated that biologically they could be treated as two bio-regions. The SB region often exhibited higher richness numbers, for all macroinvertebrate groups, but notably for Trichoptera (33 genera in SB region, 20 in SO region) and Ephemeroptera (24 genera in SB region, 16 in SO re-gion). Although sites sampled at both regions were con-sidered as “reference”, the SB region was better pre-served than SO region. Historically, the SO region was modified - logging in the last 40-y, with widespread de-forestation - and then occupied by secondary vegetation, which nowadays represent reference conditions. Accord-ing to HardAccord-ing, et al. (1998) past land-use activity, partic-ularly agriculture, may result in long-term modifications to and reductions in aquatic diversity, regardless of refor-estation of riparian zones.
In the last two decades, many studies emphasized the need to evaluate the faunal responses to stress at different spatial scales. Some studies found stronger relationships between macroinvertebrate fauna and environmental conditions at ecoregional level (Barbour et al., 1996, Reynoldson et al., 1997, Karr and Chu. 1997). Other studies, like our own, found macroinvertebrate fauna more associated with local aquatic habitat or to land-use adjacent to the stream than with strict ecoregional classi-fication (Waite et al., 2000, Mykrä et al., 2004, Frimpong et al., 2005, Munn et al., 2009). It is logical to suppose that these differences, if they exist, they would result in biological indices as well. Therefore, it is advisable to test, and if necessary, develop new biological indices to
indicate these local/regional conditions, even if areas are in the same ecoregion. Studies in Canada and USA indi-cate the need to adapt or create new biological indices for bioregions within an ecoregion (Fore et al., 1994, Maxted et al., 2000, McCormick et al., 2001, Sylvestre et al., 2005).
In this study, three (of six) metrics used in the SOMI Index were chosen to integrate the MISB - Family Rich-ness, % Coleoptera and % Diptera. The BMWP-CETEC index was sensitive, but was substituted by the IBE-IOC because the latter was developed for the Rio de Janeiro State. The two other metrics which integrated the MISB were EPT / Chironomidae ratio and Trichoptera Richness because they had low redundancy with other metrics and represented a relevant portion of the SB fauna. The index composition with these six metrics (Family Richness, % Coleoptera, % Diptera, IBE-IOC index, EPT/Chirono-midae ratio and Trichoptera Richness), was the most ade-quate for the SB region.
A common difficulty is to establish a biological in-dex which discerns different levels of impairment in an altitudinal gradient. Frequently, historical and current land uses differ from upland to lowland areas, and there are scarce reference sites in areas where access is easier to human populations, usually at lowlands (Klemm et al., 2003). This problem is expected to be greater when the area where the index is applied includes more than one river basin or ecoregion. In the mountainous Serra do Mar region located along the coast of 30% of Brazil -most human activities are located in lowland areas, there-fore making altitude often negatively correlated with hu-man impairment. In this study, to assure the sensitivity of the index to the measured impairment, we sampled refer-ence and impaired sites along the altitudinal gradient and at streams with different sizes. Our results showed that the MISB was more related to land-use and water physi-cal and chemiphysi-cal parameters than with altitude or stream width (Table 4). The fact that most MISB metrics are cal-culated using higher taxonomic levels also reduces the influence of altitude, since distribution of taxa at those levels usually occurs at broader areas and/or along the altitudinal gradient. Most metrics in the MISB require identification mostly to family-level (except for Trichoptera in genus-level). This is important for a bio-logical index in Brazil, where identification of benthic macroinvertebrates at the species level is not yet possible due to inadequate taxonomic knowledge and lack of comprehensive taxonomic keys. It is important to notice that even in this higher level of taxonomic identification, the MISB responded well to a generalized measure of disturbance (Table 4) representing a wide variety of com-bined stressors, being an adequate and efficient tool for detecting environmental impacts. Our study indicated the importance of testing biological indices before using in new areas, even within the same ecoregion, and calls the attention that historical land-use should be considered as an important variable influencing indices based on macroinvertebrate assemblages.
580 Braz. J. Biol., 2013, vol. 73, no. 3, p. 573-583
Baptista, DF. et al.
Table 4- Factor loadings (PCA axes 1 and 2) of environ-mental parameters of 11 test-sites in the Serra da Bocaina re-gion.
Variable PCA Axis 1 PCA Axis 2
% forested area 0.342 0.024
Riparian width 0.319 0.165
RCE index 0.316 -0.163
Altitude 0.253 0.253
Dissolved oxygen 0.169 -0.329
Total alkalinity 0.157 0.376
pH 0.118 0.153
Cl- 0.106 0.416
Stream width -0.156 -0.393
Water temperature -0.257 -0.105
Conductivity -0.278 -0.188
NH3-N -0.291 0.271
Total-P -0.292 0.273
Total-N -0.297 0.259
Acknowledgments
The authors would like to thank the financial support of CNPq (Edital CNPq/PROEP 400107/2011-2 and CT-Hidro/PDJ) and the colleagues (Valdinei Valin and Denise Borges Assunção) of the LAPSA/IOC/FIOCRUZ for the water analysis of this study.
References
ANGRISANO, EB., 1995. Insecta Trichoptera. In LOPRETTO, EC. and TELL, G. (Ed.).Ecosistemas de Aguas Contin-entales: Metodologia para su Estudio. La Plata: Edi-ciones Sur. Vol. 3, p. 1199-1224.
AYRES, M., AYRES, MJR., AYRES, DL. and SANTOS, AS. , 2000.BioEstat2.0: aplicações estatísticas nas áreas das ciências biológicas e médicas. Belém: Sociedade civil Mamirauá. p. 272.
ARMITAGE, PD., MOSS, D., WRIGHT, JF. and FURSE, MT., 1983. The performance of a new biological water quality score based on macroinvertebrates over a wide range of unpolluted running-water sites.Water Research, vol. 17, p. 333-347.
BAPTISTA, DF., BUSS, DF., DIAS, LG., NESSIMIAN, JL., DA SILVA, ER., MORAES NETO, AHA., CARVA-LHO, SN., OLIVEIRA, MA. and ANDRADE, LR., 2006. Functional feeding groups of Brazilian Ephemeroptera nymphs : ultrastructure of mouthparts. Annels Limno-logie, vol. 42, no 2, p. 87-96.
BAPTISTA, DF., BUSS, DF., EGLER, M., GIOVANELLI, A., SILVEIRA, MP. and NESSIMIAN, JL., 2007. A multi-metric index based on benthic macroinvertebrates for eva-luation of Atlantic Forest sites at Rio de Janeiro State, Brazil.Hydrobiologia, vol. 575, no. 1, p. 83-94. BAPTISTA, DF., SOUZA, RSG., VIEIRA, CA., MUGNAI, R.,
SOUZA, AS. and OLIVEIRA, RBS, 2011. Multimetric index for assessing ecological condition of running waters in the upper reaches of the Piabanha-Paquequer-Preto Ba-sin (RJ, Brazil).Zoologia, vol. 28, no.5, p. 619-628. BARBOUR, MT., GERRITSEN, J., SNYDER, BD. and
STRI-BLING, J B., 1999.Rapid Bioassessment Protocols for Use in Streams and Wadeable Rivers: Periphyton, Ben-thic Macroinvertebrates and Fish. 2nd Edition. Washing-ton, DC.: Environmental Protection Agency, Office of Water.
BARBOUR, MT., GERRITSEN, J., GRIFFITH, GE., FRYDENBORG, R., MCCARRON, E., WHITE, JS. and BASTIAN, ML., 1996. A framework for biological crite-ria for Florida sites using benthic macroinvertebrates.
Journal of the North American Benthological Society, vol.15, no2.p. 185-211.
BELLE, J., 1992. Studies on ultimate instar larvae of Neotropi-cal Gomphidae, with the description ofTibiagomphus
gen. nov. (Anisoptera). Odonatologica, vol. 21, no.3, p. 1-24.
BLOCKSOM, KA., 2003. A performance comparison of metric scoring methods for a multimetric index for Mid-Atlantic highland streams.Environmental Management, vol. 31, no.5, p. 670-682.
BÖHMER, JC., RAWER, J. and ZENKER, A., 2004. Multi-metric assessment of data provided by water managers from Germany: assessment of several different types of stressors with macrozoobenthos communities. Hydrobio-logia, vol. 516, no.1, p. 215-228.
BUFFAGNI, A., ERBA, S., CAZZOLA, M. and KEMP, LL., 2004. The AQEM multimetric system for the southern
Italian Alpennines: assessing the impact of water quality and habitat degradation on pool macroinvertebrates in Mediterranean rivers.Hydrobiologia, vol. 516, no.1, p.
313-329.
BUSS, DF. and BORGES, EL., 2008. Application of Rapid Bioassessment Protocols (RBP) for Benthic Macroinver-tebrates in Brazil: Comparison between Sampling Tech-niques and Mesh Sizes.Neotropical Entomology, vol. 37, no.3, p. 288-295.
BUSS, DF. and VITORINO, AS., 2010. Rapid Bioassessment Protocols using benthic macroinvertebrates in Brazil: eva-luation of taxonomic sufficiency.Journal of the North American Benthological Society, vol.29, no.2, p. 562-571. CARVALHO, AL., 1989. Description of the larvae of
Neuraeschna Costalis(Burmeister), with notes on its
bi-ology, and a key to the genera of Brazilian Aeshnidae Larvae (Anisoptera). Odonatologica, vol. 18, no. 4, p. 325-332.
CARVALHO, AL. and CALIL, ER., 2000. Chaves de identifi-cação para as famílias de Odonata (Insecta) ocorrentes no Brasil, adultos e larvas. Papéis Avulsos de Zoologia, vol. 41, no. 15, p. 223-241.
CARVALHO, AL., WERNECK-DE-CARVALHO, P. and CA-LIL, ER., 2002. Description of the larvae of two species of
Dasythemis Karsch, with a key to the genera of Libellulidae occurring in the states of Rio de Janeiro and São Paulo, Brazil (Anisoptera).Odonatologica, vol. 31, no. 1, p. 23-33.
COUCEIRO, SRM., HAMADA, N., FORSBERG, BR., PI-MENTEL, TP., and LUZ DA, SLB., 2012. Macroinver-tebrate multimetric index to evaluate the biological condi-tion of streams in the Central Amazon region of Brazil.
Ecological Indicators, vol. 18, no. 1, p. 118-125. CETESB, 2002. Relatório de qualidade das águas interiores do
Estado de São Paulo. p. 274 (Série Relatórios). Available from: http://www.cetesb.sp.gov.br/publicacoes/ publicacoes. asp.
DA SILVA, ER., SALLES, FF., NESSIMIAN, JL. and COE-LHO, LBN., 2003. A identificação das famílias de Ephemeroptera (Insecta) ocorrentes no Estado do Rio de Janeiro: Chave pictórica para as ninfas.Boletim do Museu Nacional de Zoologia, vol. 508, no.1, p. 1-6.
EC - EUROPEAN COMMISSION, 2000. Directive 2000/60/EC of the European Parliament and Council, es-tablishing a framework for Community action in the field of water policy Official,Journal of the Europea Commu-nity, vol. 327, no.1, p. 1-72.
FERREIRA, WR., PAIVA, LT. and CALLISTO, M., 2011. De-velopment of a benthic multimetric index for bio-monitoring of a Neotropical watershed.Brazilian Journal of Biology, vol. 71, no.1, p.15-25.
FREY, G., 1977. The integrity of water. Washington, DC.: USEPA, BALLENTINE and GUARRIA. p. 127-140. FRIMPONG, EA., SUTTON, TM., ENGEL, BA. and SIMON,
TP., 2005. Spatial-Scale effects on Relative Importance of Physical Habitat predictors of Stream Health. Environ-mental Management, vol. 36, no. 6, p. 899-917. FEEMA, 1979. Fundação Estadual de Engenharia do Meio
Am-biente.Métodos de análise físico-química da água.Rio de Janeiro, DICOMT. vol. 3.
FORE, LS., KARR, JR. and CONQUEST, LL., 1994. Statistical properties of an index of biotic integrity used to evaluate water resources.Canadian Journal of the Fisheries and Aquatic Sciences,vol.51, p. 1077-1087.
the rivers Khan and Kshipra (Madhya Pradesh), India.
Freshwater Biology, vol. 40, no.1, p. 367-383.
GABRIELS, W., LOCK, K., De PAUW, N. and GOETHALS, PLM., 2010. Multimetric Macroinvertebrate Index Flan-ders (MMIF) for biological assessment of rivers and lakes in Flanders (Belgium). Limnologica, vol. 40, no. 3, p. 199-207.
GHETTI, PF., 1997.Indice Biotico Esteso (IBE). I Macro-invertebrati nel Controllo della Qualita degli Ambienti di Acque Correnti. Trento: Agenzia provinciale per la prote-zione dell’ambiente. 222 p.
GIBSON, GR., BARBOUR, MT., STRIBLING, JB., GER-RITSEN, J. and KARR, JR., 1996.Biological Criteria. Technical Guidance for Sites and Small Rivers. Washing-ton, DC.: Environmental Protection Agency, Office of Science and Technology.
GUIMARÃES, AE., GENTILE, C., LOPES, CM., SANT’AN-NA, A. and JOVITA, AM., 2000. Ecologia de mosquitos (Diptera: Culicidae) em áreas do Parque Nacional da Serra da Bocaina, Brasil. I - Distribuição por hábitat.
Revista de Saúde Pública, vol. 34, no. 3, p. 243-250. HAMMER, Ø., HARPER, DAT. and RYAN, PD., 2001.PAST:
Paleontological Statistics Software Package for Educa-tion and Data Analysis. Palaeontologia Electronica. Available from: http://palaeo-electronica.org/2001_1/ past/issue1_01.htm .
HARDING, JS., BENFIELD, EF., BOLSTAD, PV., HELF-MAN, GS. and JONES, EBD., 1998. Stream biodiversity: The ghost of land use past.Proceedigings of the National Academy of Science, vol. 95, p. 14843-14847.
HERING, D., VERDONSCHOT, PFM., MOOG, O. and SANDIN, L., 2004. Overview and application of the AQEM assessment system: Integrated Assessment of Running Waters in Europe.Hydrobiologia, vol. 516, no.1, p. 1-20.
HILSENHOFF, WL., 1987. An improved biotic index of or-ganic stream pollution.Great Lakes Entomology, vol. 20, no.1, p. 31-39.
HILSENHOFF, W. L., 1988. Rapid field assessment of organic pollution with a family-level biotic index.Journal of the North American Benthological Society, vol.7, no. 1, p. 65-68.
HUGHES, RM., KAUFMANN, PR., HERLIHY, AT., KINCAID, TM., REYNOLDS, L. and LARSEN. DP., 1998. A process for developing and evaluating indices of fish assemblages integrity.Canadian Journal of the Fish-eries and Aquatic Sciences,vol.55, p. 1618-1631. JOHNSON, RK., WIEDERHOLM, T. and ROSENBERG,
DM., 1993. Freshwater biomonitoring using individual organisms. Populations and species assemblages of ben-thic Macroinvertebrates. In ROSENBERG, DM. and RESH, VH., (Eds.)Freshwater biomonitoring and ben-thic macroinvertebrates. New York: Chapman & Hall. 488 p.
JUNQUEIRA, VM. and CAMPOS, SCM., 1998. Adaptation of the “BMWP” Method for Water Evaluation to Rio das Velhas Watershed (Minas Gerais, Brazil). Acta Limnológica Brasiliensia, vol. 10, no.2, p. 125-135.
KARR, JR., 1991. Biological integrity: a long-neglected aspect of water resource management.Ecological Application,
vol. 1, p. 66-84.
KARR, JR. and CHU, EW., 1997.Biological monitoring and assessment: Using multimetric index effectively. Seattle:
University of Washington.
KARR, JR. and DUDLEY, DR., 1981. Ecological perspective on water quality goals. Environmental Management, vol. 5, no.1, p. 55-68.
KARR, JR., FAUSCH, KD., ANGERMEIER, PL., YANT, PR. and SCHLOSSER, IJ., 1986.Assessment of biological in-tegrity in running water: a method and its rationale. Illi-nois: Illinois Natural History Survey. 28 p. Special Publi-cation, no. 5.
KING, RS. and RICHARDSON, CJ., 2003. Integrating Bio-assessment and Ecological Risk Bio-assessment: An Ap-proach to Developing Numerical Water-Quality Criteria.
Environmental Management, vol. 31, no. 6, p. 795-809. KLEMM, DJ., BLOCKSOM, KA., FULK, FA., HERLIHY,
AT., HUGHES, RM., KAUFMANN, PR., PECK, DV., STODDARDS, JL., THOENY, WT., GRIFFITH, MB. and DAVIS, WS., 2003. Development and evaluation of a macroinvertebrates biotic integrity (MBII) for regionally assessing Mid-Atlantic Highlands Streams. Environmen-tal Management, vol. 31, no. 5, p. 656-669.
KOLKWITZ, R., and MARSSON, M., 1909. Ökologie der tierischen Saprobien. Beiträge zur Lehre von des bio-logischen Gewasserbeurteilung.Internationale Revue der gesamten Hydrobiologie und Hydrographie, vol. 2, no. 1, p. 126-152.
MAXTED, JD., BARBOUR, M.T., GERRITSEN, J., PORET-TI, V., PRIMROSE, N., SILVIA, A., PENROSE, D. and RENFRON, R., 2000. Assessment framework for mid-Atlantic coastal plain sites using benthic macroinver-tebrates.Journal of the North American Benthological Society, vol. 19, no.1, p. 128-144.
MORENO, P., FRANÇA, JF., FERREIRA, WR., PAZ, AD., MONTEIRO, MI. and CALLISTO, M., 2009. Use of the BEST model for biomonitoring water quality in Neotropi-cal basin.Hydrobiologia, vol. 630, no. 1, p. 231-242. MCCORMICK, FH., HUGHES, RM., KAUFMANN, PR.,
PECK, DV., STODDARD, JL. and HERLIHY, AT., 2001. Development of an index of biotic integrity for the mid-Atlantic highlands region.Transactions of the Ameri-can Fisheries Society, vol. 130, p. 857-877.
MERRITT, RW. and CUMMINS, KW., 1996.An introduction to the Aquatic Insects of North America. 3rd Edition. Dubuque, Iowa : Kendall/Hunt. 862 p.
METCALFE, JL., 1989. Biological Water Quality Assessment of Running Waters Based on Macroinvertebrate Commu-nities: History and Present Status in Europe. Environmen-tal Pollution, vol. 60, no.1, p. 101-139.
MINNS, CK., CAIRNS, VW., RANDALL, RG. and MOORE, JE., 1994. An Index of Biotic Integrity (IBI) for fish as-semblages in littoral zone of Great Lakes areas of concern.
Canadian Journal of Fisheries and Aquatic Sciences, vol. 51, p. 1804-1822.
MMA/SBF. 2000.Avaliação e ações prioritárias para a conser-vação da biodiversidade da Mata Atlântica e Campos Sulinos. Brasília: Conservation International do Brasil, Fundação SOS Mata Atlântica, Fundação Biodiversitas, Instituto de Pesquisas Ecológicas, Secretaria do Meio Ambiente do Estado de São Paulo, SEMAD/Instituto Estadual de Florestas-MG. 40 p.
MUGNAI, R., OLIVEIRA, RB., CARVALHO, LC. and BAP-TISTA, DF., 2008. Adaptation of the Indice Biotico Esteso (IBE) for water quality.Tropical Zoology, vol. 21, no. 1, p. 57-74.
MUNN, MD., WAITE, RI., LARSEN, DP. and HERLIHY, AT., 2009. The relative influence of geographic location and reach-scale habitat on benthic invertebrate
assem-582 Braz. J. Biol., 2013, vol. 73, no. 3, p. 573-583
blages in six ecoregions. Environmental Monitoring Assessement, vol. 154, no. 1, p. 1-14.
MYKRÄ, H., HEINO J, and MUOTKA, T., 2004. Variability of Lotic Macroinvertebrate Assemblages and Stream Habi-tat Characteristics Across Hierarchical Landscape Classi-fications. Environmental Management, vol. 34, no.3.
p. 341-352.
NIESER, N., and de MELO, AL., 1997.Os heterópteros aquá-ticos de Minas Gerais, guia introdutório com chave de identificação para as espécies de Nepomorpha e Gerro-morpha. Belo Horizonte: Editora UFMG. 180 p. OLIVEIRA, RBS., BAPTISTA, DF., MUGNAI, R., CASTRO,
CM., HUGHES, RM. 2011. Towards rapid bioassessment of wadeable streams in Brazil: Development of the Gua-piacu-Macacu Multimetric Index (GMMI) based on ben-thic macroinvertebrates.Ecological Indicators, vol. 11. p. 1584-1593.
OLIFIERS, MH., DORVILLÉ, LFM., NESSIMIAN, JL., and HAMADA, N., 2004. A key to Brazilian genera of Plecoptera (Insecta) based on nymphs.Zootaxa, vol. 651.
no.1, p. 1-15.
PASSOS, MIS., NESSIMIAN, JL. and FERREIRA-JR, N., 2007. Chaves para identificação dos gêneros de Elmidae (Coleoptera) ocorrentes no Estado do Rio de Janeiro, Brasil.Revista Brasileira de Entomologia, vol. 51, no. 1, p. 42-53.
PETERSEN, RC., 1992. The RCE: a Riparian, channel and en-vironmental inventory for small sites in the agricultural landscape.Freshwater Biology, vol. 27, no. 1, p. 295-306. PINTO, P., ROSADO, J., MORAIS, M. and ANTUNES, I., 2004. Assessment methodology for southern siliceous basins in Portugal.Hydrobiologia, vol. 516, no.1, p. 193-216.
PLAFKIN, JL., BARBOUR, MT., PORTER, KD., GROSS, SK. and HUGHES, RM., 1989. Rapid bioassessment proto-cols for use in sites and rivers: Benthic macroivertebrates
and fish.Washington, DC: US Environmental Protection Agency.
REYNOLDSON, TB., NORRIS, RH., RESH, VH., DAY, KE. and ROSEMBERG, DM., 1997. The reference condition: a comparison of multimetric and multivariate approaches to assess water-quality impairment using benthic macro-invertebrates. Journal of the North American Bentho-logical Society, vol.16, 833-852.
SALLES, FF., DA SILVA, ER., SERRÃO, JE. and FRANCIS-CHETTI, CN., 2004. Baetidae (Ephemeroptera) na Re-gião Sudeste do Brasil: Novos registros e chave para os gêneros no estágio ninfal. Neotropical Entomology, vol. 33, no. 5, p. 725-735.
SYLVESTRE, S., FLUEGEL, M. and TUOMINEN, T., 2005.
Benthic invertebrate assessment of sites in the Georgia Basin using the least-disturbed condition approach: ex-pansion of the Fraser River invertebrate monitoring pro-gram 1998-2002. Vancouver: Environment Canada.
194 p.
VLEK, HE., VERDONSCHOT, PFM. and NIJBOER, RC., 2004. Toward a multimetric index for the assessment of Dutch sites using benthic macroinvertebrate. Hydrobio-logia, vol. 516, no. 1, p. 173-189.
WAITE, IR., HERLIHY, AT., LARSEN, DP. and KLEMM, DL., 2000. Comparing strengths of geographic and non-geographic classications of stream benthic macroinver-tebrates in the Mid-Atlantic Highlands, USA.Journal of the North American Benthological Society, vol. 19,
p. 429-441.
WINGET, RN. and MANGUM, FA., 1979. Biotic Condition In-dex: integrated biological, physical, and chemical stream parameters for management. Ogden: US. Forest Service Intermountain Region, US. Department of Agriculture. 51 p.