ABSTRACT: There is renewed interest in white lupine (Lupinus albus L.), which is appreciated for its high protein content, full range of essential amino acids and as N source to rainfed cropping systems. Unfortunately, information on its N2 fixation ability is limited. This study aimed to: (i) quantify the N2 fixation ability of white lupine crop at the plot field scale in three different environments of Sardinia (Italy) under Mediterranean climate; (ii) determine the al-location of the plant-fixed N into different organs; and (iii) establish the relationship between fixed N and DM within plant organs. In a 2-year experiment, N2 fixation was estimated using the 15N isotopic dilution method. The productive performances and ability of white lupine to fix N2 widely differed in the three environments; peak values exceeded 300 kg ha
−1 of fixed N. There were significant differences in the quantity of fixed N found in each plant organ at physiological maturity with 5, 20, 19 and 57 % of fixed N partitioned to roots, shoots, pod valves and grain, respectively. After grain harvesting, the net N balance ranged from nega-tive values to 160 kg N ha−1. The relationship between fixed N and DM yield indicated 60, 34, 8 and 6 kg of fixed N per t of grain, pod valves, shoots and root, respectively, showing that fixed N preferentially accumulated in seeds at physiological maturity. Due to its high potential for N2 fixation and N benefit, white lupine represents a valuable crop option under rainfed Mediterranean conditions.
Keywords: Lupinus albus cv. Multitalia, fixed N, isotopic dilution, plant organs, pulse 1National Research Council/Institute for the Animal
Production System in Mediterranean Environment, Traversa La Crucca, 3 − 07100 − Sassari − Italy.
2National Research Council/Institute of Biomolecular Chemistry, Traversa La Crucca, 3 − 07100 − Sassari − Italy. 3University of Sassari − Dept. of Agriculture, Viale Italia, 39 − 07100 − Sassari − Italy.
4Council for Agricultural Research and Economics − Research Unit for Agro-pastoral Systems in Mediterranean Environment, Podere Ortigara − 09025 − Sanluri − Italy. *Corresponding author <[email protected]>
Edited by: Leônidas Carrijo Azevedo Melo
Yield and nitrogen fixation potential from white lupine grown in rainfed Mediterranean
Leonardo Sulas1*, Simone Canu2, Luigi Ledda3, Antonio Melchiorre Carroni4, Mauro Salis4
Received July 24, 2015 Accepted October 06, 2015
Introduction
Grain legumes could play a crucial role in decreasing the marked deficit of high-protein feedstuff and increasing the sustainability of European crop-livestock systems (Annicchiarico et al., 2010). At the same time, grain legumes can offer ecosystem services such as renewable N input, the improvement of soil fertility and the diversification of cropping systems (Jensen et al., 2012; Sinclair and Vadez, 2012). White lupine (Lupinus albus L.), whose center of origin and domestication is the Mediterranean basin (Jansen, 2006), is known to have been cultivated since ancient times, mainly distributed around the Mediterranean and in the Nile valley, extending to Sudan and Ethiopia (Huyghe, 1997). It is an interesting grain legume due to its low alkaloid lines and higher protein content (34-45 %), similar to that of soybean (Annicchiarico, 2008; Boschin et al., 2008; Laudadio and Tufarelli, 2011; Petterson, 1998). Moreover, white lupine has a higher level of essential amino acids and important dietary minerals (iron and potassium) compared with other rainfed legumes such as pea (Pisum sativum L.), faba bean (Vicia faba L.) and narrow leafed lupine (L. angustifolius L.), which are useful as innovative ingredients of functional or healthy food products (Annicchiarico et al., 2014; Chiofalo et al., 2012; Guillamón et al., 2010). Currently, there is overall renewed interest in this species that could be a precious protein source for the Mediterranean farming systems, representing, in the meantime, an additional crop option for longer-term rotations (EC,
2013). According to Unkovich et al. (2010), only a few studies have investigated in-field N2 fixation of white lupine in comparison with other grain legumes. Several biotic and abiotic factors might affect N2 fixation as well as the methods used for its quantification (Peoples et al., 2009; Unkovich et al., 2008). In addition, the results could be dependent mainly on environmental conditions of the study site. In order to investigate the promising N contribution from white lupine to Mediterranean rainfed cropping systems, the main objectives of our study were: (i) to quantify the N2 fixation ability of white lupine crop over two years at field scale in three different pedo-climatic conditions under Mediterranean climate; (ii) to determine the allocation of the plant fixed N into different organs; and (iii) to establish the relationship between fixed N and DM within white lupine organs.
Materials and Methods
Locations and Crop Management
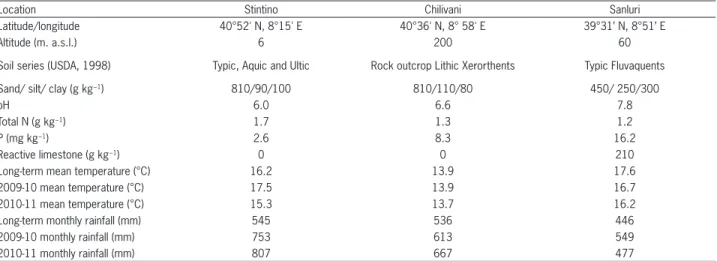
The field experiments were conducted during 2009-2011 at three locations in North-western (40°52' N, 8°15' E), Central (40°36' N, 8°58' E) and Southern (39°31’ N, 8°51’ E) Sardinia (Italy), respectively, differing for several soil characteristics (Table 1). The climate is Mediterra-nean with mild winters and dry summers; however, the three locations also differ for long-term data on rainfall and temperatures. Due to the presence of different soils and microclimates over limited surfaces, Sardinia can be considered a representative study area for environmental variations in Mediterranean basin areas.
During the experimental periods, the total rain-fall from September 2009 to August 2010 was 38, 14 and 23 % greater than the long-term means for the Stintino, Chilivani and Sanluri sites, respectively. In the second year, the total rainfall from September 2010 to August 2011 was 48, 24 and 7 % higher than climatic data for the same locations, indicating wide variations (Table 1).
Stands of white lupine cv. Multitalia for animal feeding were established by sowing 60 kg ha−1 of
vi-able seed (row spacing 50 cm) and seeds were inocu-lated with a commercial source of Bradyrhizobium lupini
(Souche LL13). In the three experimental sites, white lupine had never been grown before and durum wheat was the crop grown in the previous season. Seeding was carried out from late December 2009 to early January 2010 and in autumn 2010. Avena sativa L. (oats) sown at a rate of 180 kg ha–1 was used as non-fixing reference
species (NFS). Oats has an annual cycle overlapping that of white lupine and has already been used as NFS for white lupine and other lupine species (Cazzato et al., 2012; Carranca et al., 2013). At the three locations and over the two experimental years, both white lupine and NFS as control were arranged according to a completely randomized block design with three replicates (new ran-domization every year). The size of each plot was 4.5 × 7.5 m. All plots were fertilized with 100 kg ha−1 P
2O5
us-ing triple superphosphate before seedus-ing. The seedbed was prepared using conventional tillage consisting of 30 cm deep ploughing and superficial harrowing. No irriga-tion, fertilizer or herbicide was applied after sowing. The N2 fixation was estimated using the 15N isotopic dilution
method (Unkovich and Pate, 2000). For white lupine and non-fixing reference species, enriched 15N fertilizer (10
atom% 15N enriched ammonium sulphate) was applied
to a 3 m2 (1.5 m × 2.0 m) area at a rate of 4 kg N ha−1
af-ter seedling emergence. The 15N-enriched fertilizer was
diluted in water and uniformly hand-sprayed at a rate of 1 L m−2 to allow uniform distribution in the soil profile.
Such a 15N fertilizer application has been successfully
adopted as a common protocol in previous experiments carried out in Sardinia and other Italian locations, in the framework of the Italian national research project “Physiology of production and nitrogen fixation of forage legumes in eco-compatible farming systems” (Cazzato et al., 2012; Sulas et al., 2009, 2013).
Measurements
White lupine plants were harvested from early pod fill to seed ripening stage, but before senescence and leaf shed, during 9-15 June 2010 and 30 May to 6 June 2011, respectively. At harvest, leaf fall was negligible and stems and most of the leaves were still green. Dry matter (DM) production was measured in the 15N-enriched area
(3 m2). Complete white lupine plants were obtained by
excavating a 50-cm wide and 40-cm deep hole in the
15N-enriched sampling areas.
The root samples were wet-sieved in order to separate the physically recoverable roots from the soil by gently washing the main plant root system with water over a 2 mm sieve. Therefore, total plant biomass was subdivided into grain, pod valves, shoots, and recoverable roots plus nodules. All harvested biomass samples were dried at 65 °C in a forced-air oven until a constant weight was achieved. Dry samples of grain, pod valves, shoots, and roots were ground finely enough to pass through a 1 mm mesh and submitted by dry combustion to elemental analyzer isotope ratio mass spectrometry (Cheshire, United Kingdom) to determine both N content (%N) and the atom% 15N.
Calculations
Nitrogen yield (kg N ha−1) was calculated by
multiplying dry matter yield (DMY) (kg ha−1) per its N
content (%). The rate of N derived from the atmosphere (%Ndfa) in each plant organ was calculated according to the 15N isotopic dilution method (Warembourg, 1993)
using the following equation:
Table 1 − Main soil characteristics and annual mean temperatures and rainfall over the experimental years at the three experimental locations.
Location Stintino Chilivani Sanluri
Latitude/longitude 40°52' N, 8°15' E 40°36' N, 8° 58' E 39°31’ N, 8°51’ E
Altitude (m. a.s.l.) 6 200 60
Soil series (USDA, 1998) Typic, Aquic and Ultic Rock outcrop Lithic Xerorthents Typic Fluvaquents
Sand/ silt/ clay (g kg−1) 810/90/100 810/110/80 450/ 250/300
pH 6.0 6.6 7.8
Total N (g kg−1) 1.7 1.3 1.2
P (mg kg−1) 2.6 8.3 16.2
Reactive limestone (g kg−1) 0 0 210
Long-term mean temperature (°C) 16.2 13.9 17.6
2009-10 mean temperature (°C) 17.5 13.9 16.7
2010-11 mean temperature (°C) 15.3 13.7 16.2
Long-term monthly rainfall (mm) 545 536 446
2009-10 monthly rainfall (mm) 753 613 549
%
%
% Ndfa
atom N excess atom N excess
white lupine
NFS
= −
1
15
15
×100
where: atom% 15N excess = (atom% 15N sample−atom% 15N N
2 air) and atom%
15N of air N
2 = 0.3663. The %Ndfa
of each biomass portion was obtained using the 15N
ex-cess of the various legume plant portions and above and below ground portions of the reference non-fixing crop. The amount of N fixed (Nfix) by white lupine was then computed:
Nfix kg ha( −) white lupine N (kg ha−) %Ndfa
= ×
1 1
100
The potential contribution of white lupine to the soil N pool was estimated according to the following equation:
N balance (kg ha−) Nfix Nharv
= −
1 ,
where: Nharv is the quantity of N present in the har-vested biomass of white lupine.
Statistical analyses
Data related to white lupine and NFS were submitted to Analysis of Variance according to a completely randomized block design repeated over space (3 locations, as fixed factors) and time (2 years, as fixed factors), in order to distinguish year and location effects (Piepho et al., 2003). All statistical analyses were conducted using the Statistical Analysis System (SAS software 9.0). Percentage values were normalized by the arcsin transformation. Means were compared using Fisher’s protected least significant difference (LSD) test. The LSDs (p < 0.05) were calculated by comparing different main effects and interactions using the appropriate standard error terms according to Gomez and Gomez (1984). A linear regression analysis was applied to parameters DMY and fixed N.
Results
Dry matter yield, nitrogen concentration and yield
A year × site interaction (p < 0.05) was found in almost all investigated variables, except for pod valve DMY and root N concentration, which were affected (p
< 0.05) by year and site (data not shown).
Among sites, total DMY ranged from 6.5 to 12.2 t ha−1 in the first year and from 3.3 to 18.5 t ha−1 in the
sec-ond year, indicating a strong influence of the environmen-tal conditions (Table 2). Toenvironmen-tal DMY increased from the first to the second year in Stintino and Chilivani, but decreased in Sanluri. On the average of both years, pod valve DMY at Stintino reached about two-fold the amount measured in Chilivani and Sanluri. In the first year, root, shoots and total DMY at Stintino were higher (p < 0.05) than Chilivani and Sanluri, whereas grain DMY did not differ.
In the second year, root DMY at Stintino and Chilivani was four-fold higher than Sanluri. Shoots, grain and total DMY differed (p < 0.05) in all sites and higher values were observed in Stintino.
In Stintino, values for root, shoots, grain and total DMY were higher (p < 0.05) in the second year. Except for grain DMY, a similar trend was recorded in Chilivani, whereas in Sanluri the higher (p < 0.05) values were observed in the first year.
On average, the contribution of different plant or-gans to total DMY decreased from 50 to 22, 16 and 12 %, respectively in shoot, grain, pod valves and recover-able roots. As an average of years and sites, the rate of pod valves, calculated as the ratio between the pod valve weight and the weight of the complete pod at harvest, was 42 %.
Wide variations for N concentrations among plant organs were recorded with N concentration in grain reaching up to seven-fold more than that of shoots (Table 3). Across sites, root N concentration was higher (p < 0.05) in the first year (about 1 %), whereas, on the average of years, it was higher (p < 0.05) in Chilivani.
Table 2 − Roots, shoots, pod valves, grain and total dry matter yield of white lupine over two years at Stintino, Chilivani and Sanluri.
Year Location Dry matter yield
Roots Shoots Pod valves Grain Total
--- t ha−1 ---2009-10
Stintino
1.3 ab 6.0 ab 2.7 2.3 ab 12.2 ab
2010-11 1.8 aa 11.0 aa 2.0 3.7 aa 18.5 aa
Mean 1.5 8.1 2.4 A 2.9 14.9
2009-10
Chilivani
0.6 bb 1.8 bb 1.6 2.5 aa 6.5 bb
2010-11 1.6 aa 5.0 ba 0.8 0.8 bb 8.3 ba
Mean 1.1 3.2 1.3 B 1.8 7.3
2009-10
Sanluri
0.8 ba 3.6 ba 1.4 2.6 aa 8.3 ba
2010-11 0.4 bb 1.4 cb 0.6 0.9 bb 3.3 cb
Mean 0.6 2.5 1.0 B 1.7 5.8
Mean 2009-10 0.9 3.8 1.9 A 2.4 9.1
Mean 2010-11 1.3 5.8 1.2 B 1.8 10.0
In the first and second year, N concentrations of all plant organs showed variations in all sites.
In the sites of Stintino and Sanluri, N concentrations of shoots and pod valves were higher (p < 0.05) in the first year, as were the N concentrations of grain in Chilivani and Sanluri.
Nitrogen yields, based on DMY and N concentrations, showed wide variations (Table 4) for total N yields within years and sites, ranging from 53.3 kg N ha−1 at Sanluri to 375.1 kg N ha−1 atStintino both
in the second year. On average, the contribution of plant portions to the total N yield was 58, 19, 18 and 5 %, respectively for grain, shoots, pod valves and roots.
Nitrogen fixation and nitrogen balance
Atom% 15N excess
A year × site interaction (p < 0.05) was found for root, pod valves, grain Atom% 15N, root and grain %Ndfa
and for shoots, pod valves, grain and total fixed N (data not shown). Where interactions were not observed (p > 0.05), the site was found to affect Atom% 15N, %Ndfa
and fixed N. Absolute values ranged from 0.0078 (second year at Stintino for grain) to 0.1150 (second year at San-luri for root) Atom% 15N (Table 5).
On the average of both years, shoot Atom% 15N at
Sanluri was 3.6 to 5 times higher, compared to the values recorded at Chilivani and Stintino.
In both years, root, pod valves and grain Atom%
15N were higher (p < 0.05) in Sanluri than in
Chili-vani and Stintino. Moreover, in the site of Sanluri, root, pod valves and grain Atom% 15N values were
higher (p < 0.05) in the second year compared to the first.
Proportion of N derived from the atmosphere (%Ndfa)
Absolute values ranged from 37 (second year at Sanluri for pod valves) to 96 (second year at Stintino for
Table 3 − Nitrogen concentration of roots, shoots, pod valves and grain dry matter biomass of white lupine over two years at Stintino, Chilivani and Sanluri.
Year Location Roots Shoots Pod valves Grain
---% ---2009-10
Stintino
1.1 1.1 aa 3.6 aa 5.5 cb
2010-11 0.6 0.7 bb 2.5 ab 6.5 aa
Mean 0.9 B 0.9 3.2 5.9
2009-10
Chilivani
1.7 0.8 bb 1.6 cb 5.8 ba
2010-11 0.9 1.2 aa 2.6 aa 5.2 bb
Mean 1.4 A 1.0 2.0 5.6
2009-10
Sanluri
1.0 0.5 ca 1.7 ba 6.0 aa
2010-11 0.6 0.4 cb 0.6 bb 4.7 cb
Mean 0.8 B 0.5 1.2 5.4
Mean 2009-10 1.3 A 0.84 2.4 5.7
Mean 2010-11 0.7 B 0.78 1.9 5.5
Means followed by different capital letters differed for p < 0.05 as main effects analysis (year or location). Means followed by the same letter did not differ for p < 0.05 (lower case letters a, b, c within location; italic lower case letters a, b, c within year), according to LSD test.
Table 4 − Nitrogen yield (kg ha−1) of roots, shoots, pod valves, grain and total biomass of white lupine over two years at Stintino, Chilivani and Sanluri.
Nitrogen yield
Year Location Roots Shoots Pod valves Grain Total
--- kg ha−1 ---2009-10
Stintino
13.3 aa 66.2 ab 96.1 aa 124.6 ab 300.2 ab
2010-11 11.3 aa 75.3 aa 51.1 ab 237.4 aa 375.1 aa
Mean 12.4 70.1 76.8 172.9 332.3
2009-10
Chilivani
10.6 ab 13.9 bb 26.7 ba 143.1 aa 194.4 ba
2010-11 14.4 aa 61.9 aa 20.6 aba 43.4 bb 140.3 bb
Mean 12.2 34.5 24.1 100.4 171.2
2009-10
Sanluri
7.3 aa 19.8 ba 23.5 ba 156.9 aa 207.5 aba
2010-11 2.4 bb 5.3 bb 3.9 bb 41.6 bb 53.3 bb
Mean 4.8 12.6 13.7 99.2 130.4
Mean 2009-10 10.7 34.6 51.1 140.2 236.4
Mean 2010-11 9.3 47.5 25.2 107.5 189.6
grain) %Ndfa (Table 6). On the average of both years, shoots and pod valves %Ndfa values at Sanluri were low-er (p < 0.05) than Stintino and Chilivani. No differences (p > 0.05) were found for the same variables on the aver-age of sites for both years. In the first year for root and grain and in the second year for root only, %Ndfa val-ues differed for all sites. In the second year, Stintino and Chilivani showed similar grain %Ndfa and their values differed from Sanluri.
In the sites of Chilivani and Sanluri, root %Ndfa values were higher (p < 0.05) in the first year; higher %Ndfa values were recorded also for grain in the site of Sanluri in the first year, however, values in Stintino were higher at the first year but lower (p < 0.05) than in the other two locations. On the contrary, both root and grain %Ndfa values in Stintino and grain %Ndfa in Chilivani were higher in the second year.
Fixed N
On average, white lupine plants accumulated 316.2, 153.4 and 63.0 kg ha−1 of fixed N, respectively in
Stintino, Chilivani and Sanluri (Table 7). At the same sites, grain contribution to the total fixed N increased from 53 to 60 and 76 %. On average, the fixed N in the roots represented about 5 % of the fixed N in the total plants biomass, while shoots plus pod valves accounted for about 40 % of the total plant fixed N. On the average of both years, root fixed N values were lower (p < 0.05) in Sanluri than Stintino and Chilivani. In the first year, shoots and pod valves fixed N values were higher (p < 0.05) in the site of Stintino (more than 5 times higher than the other sites), while no significant differences were observed among sites for grain fixed N values. In the second year, fixed N in shoots and pod valves showed a higher variability, with differences between Stintino and Sanluri. Grain fixed N values were higher (p < 0.05) in Stintino; total fixed N showed variations for all sites. In the site of Stintino, fixed N in shoots, grain and total plant were higher (p < 0.05) in the sec-ond year compared to the first. On the contrary, the fixed N of pod valves was higher (p < 0.05) in the first year.
Table 5 − Atom% 15N excess in the roots, shoots, pod valves and grain dry matter of white lupine over two years at Stintino, Chilivani and Sanluri.
Year Location Roots Shoots Pod valves Grain
--- Atom% 15N ---2009-10
Stintino
0.0171 ba 0.0121 0.0113 ba 0.0122 ba
2010-11 0.0196 ba 0.0127 0.0086 ba 0.0078 ba
Mean 0.0182 0.0124 B 0.0102 0.0103
2009-10
Chilivani
0.0146 ba 0.0151 0.0105 ba 0.0092 ba
2010-11 0.0212 ba 0.0222 0.0184 ba 0.0092 ba
Mean 0.0175 0.0181 B 0.0139 0.0092
2009-10
Sanluri
0.0559 ab 0.0558 0.0588 ab 0.0464 ab
2010-11 0.1150 aa 0.0753 0.0986 aa 0.0895 aa
Mean 0.0855 0.0656 A 0.0752 0.0680
Mean 2009-10 0.0268 0.0251 0.0240 0.0205
Mean 2010-11 0.0520 0.0367 0.0395 0.0355
Means followed by different capital letters differed for p < 0.05 as main effects analysis (year or location). Means followed by the same letter did not differ for p < 0.05 (lower case letters a, b, c within location; italic lower case letters a, b, c within year), according to LSD test.
Table 6 − Rate of N derived from the atmosphere (%Ndfa) in the roots, shoots, pod valves and grain dry matter of white lupine over two years at Stintino, Chilivani and Sanluri.
Year Location Roots Shoots Pod valves Grain
--- %Ndfa ---2009-10
Stintino
90.7 ab 95.2 94.3 95.1 ab
2010-11 92.8 aa 93.9 95.8 96.2 aa
Mean 91.6 94.7 A 95.0 A 95.6
2009-10
Chilivani
86.1 ba 84.0 88.9 90.3 bb
2010-11 75.8 bb 87.7 89.9 95.0 aa
Mean 81.6 85.6 B 89.3 A 92.3
2009-10
Sanluri
71.0 ca 48.0 45.0 52.8 ca
2010-11 46.8 cb 44.6 32.6 34.2 bb
Mean 58.9 46.3 C 38.8 B 43.5
Mean 2009-10 83.6 78.3 78.9 81.8
Mean 2010-11 71.8 75.4 72.8 75.1
At Chilivani, higher values of fixed N were record-ed in the first year for shoots and in the second year for grain and total plant fixed N. Higher values of fixed N were recorded in the first year also in Sanluri for shoots, grain and total plant fixed N.
At Sanluri, the generally higher Atom% 15N
excess values indicated a reduced dilution effect from atmospheric N and were consistent with the recorded lower values of Ndfa. The overall Atom% 15N excess
for each legume biomass component was lower (p < 0.05) than that of the corresponding component of the reference species for each site and both years (data not reported).
In both years, the N balance for white lupine (Table 8) after grain harvesting was positive in Stin-tino and Chilivani, leaving 140 and 57 kg N ha−1 yr−1
on average (in addition to the legume N sparing ef-fect), but it was always negative in Sanluri (on aver-age -36 kg N ha−1 yr−1). If the total aboveground DM
(i.e. grain + pod valves + shoots) is removed, the N balance is slightly negative in Stintino and Chilivani, (on average -3.8 and -5.0 kg N ha−1, respectively)
and more negative in Sanluri (on average -62.5 kg N ha−1). The values for fixed N (Table 7) also suggest
that huge amounts of N, except for Sanluri in both
years, could be added to the soil if white lupine crop is used as crop for residues. Considering data from the three sites, white lupine fixed an average of 21 kg of N per ton of total plant DM (Figure 1). However, the regressions of the fixed N for each component of white lupine plant on the corresponding DMY wide-ly differed among plant organs, with 59.5, 34, 8 and 6 kg of fixed N per ton of grain, pod valves, shoots and root, respectively (Table 9).
Figure 1 − Relationship between fixed N and dry matter yield for total plant biomass.
Table 7 − Amount of fixed N (kg ha−1) in the roots, shoots, pod valves and grain dry matter of white lupine over two years at Stintino, Chilivani and Sanluri.
N fixed
Year Location Roots Shoots Pod valves Grain total
--- kg ha−1 ---2009-10
Stintino
12.0 63.1 ab 90.8 aa 118.4 ab 284.3 ab
2010-11 10.4 70.7 aa 49.0 ab 228.5 aa 358.7 aa
Mean 11.3 A 66.4 72.9 165.6 316.2
2009-10
Chilivani
9.2 11.8 bb 23.7 ba 129.7 aa 174.5 ba
2010-11 10.8 54.3 aba 18.6 aba 41.5 bb 125.2 bb
Mean 9.9 A 30.0 21.6 91.9 153.4
2009-10
Sanluri
5.1 9.4 ba 10.4 ba 82.0 aa 107.0 ba
2010-11 1.1 2.4 bb 1.3 ba 14.4 bb 19.1 cb
Mean 3.1 B 5.9 5.9 48.2 63.0
Mean 2009-10 9.1 29.8 44.5 112.6 196.0
Mean 2010-11 7.4 42.5 23.0 94.8 167.7
Means followed by different capital letters differed for p < 0.05 as main effects analysis (year or location). Means followed by the same letter did not differ for p < 0.05 (lower case letters a, b, c within location; italic lower case letters a, b, c within year), according to LSD test.
Table 8 − Total plant fixed N, grain harvested N, grain + shoots harvested N and N balance (kg ha−1) at the three experimental sites.
Year Location N fix (plant) N harv (grain) N harv
(grain + shoots)
N balance grain
N balance grain + shoots --- kg ha−1 ---2009-10
Stintino 284.3 124.6 286.9 159.7 -2.6
2010-11 358.7 237.4 363.8 121.3 -5.1
2009-10
Chilivani 174.5 143.1 183.8 31.4 -9.3
2010-11 125.2 43.4 125.9 81.8 -0.7
2009-10
Sanluri 107.0 156.9 200.2 -49.9 -93.2
2010-11 19.1 41.6 50.9 -22.5 -31.8
Discussion
Our results show that the performances of white lupine grown in Sardinia widely differ as indicated by the differences among locations and by the interaction of the location × year. The results highlight the strong influence of the soil characteristics at the experimental sites, where the seasonal amounts of rainfall were also different. Even if remarkable values in terms of DM and fixed N were reached in one site, soil characteristics such as alkaline pH and limestone content may have affected the symbiosis efficiency in another site, strongly reducing the yield and N2 fixation of white lupine. This is in accordance with the findings of Kerley (2000) and Kerley et al. (2002), who reported slower shoot development in white lupine grown in limed soils compared to neutral soils. The authors highlighted the importance of white lupine cultivars that are tolerant of calcareous soils in order to extend its cultivation area. Our results also indicate an overall relationship between high grain and DM yields and high percentages of N derived from the atmosphere. At the location (Stintino) where white lupine had the best results, the soil had the lowest amount of available phosphorus (Table 1). However, white lupine is known to produce cluster roots, which release vast amounts of phosphate-mobilizing carboxylates, enabling white lupine to absorb almost five-fold more P per unit root length than other legumes (Lambers et al., 2013).
Grain DMY at the three Sardinian sites in the first year was similar to that obtained in Sicily for white lupinevarieties: 2.2 t ha−1 on average (Chiofalo et al.,
2012). However, grain yields were lower compared with those reported (about 5 t ha−1) for the same cultivar
grown in Central and Northern Italy (Moschini et al., 2014), but in more favorable environments compared to Sardinian locations. Our values were also within the range (about 2 t ha−1) reported by Lopez-Bellido et al.
(1994) for white lupinecv. Multilopa in Spain, but were lower than those reported by Larson et al. (1989) for California. Results obtained in Sardinia evidenced a large variability in performance, but still indicate a relevant productive potential of white lupine when compared to field bean performances (1.1 – 2.4 t ha−1) (Sulas et al.,
2013). Therefore, white lupine should be regarded as a complementary and/or alternative protein and N source for dairy farming and cropping systems of Sardinia.
In white lupine cv. Multitalia, the %Ndfa range was also quite wide and it was affected by environmental
characteristics; however, our peak values were slightly lower than those reported by Carranca et al. (2009) and Cazzato et al. (2012). These authors showed that white lupine was able to reach about 100 % Ndfa in Portugal and southern Italy areas, indicating a very efficient symbiosis with native soil rhizobia, even if the corresponding grain yields were very low at pod formation. At physiological maturity, Carranca et al. (2013) estimated a pod plus seed yield by yellow lupine (L. luteus L.) of 68 kg N ha−1 yr−1, in similar experimental
conditions. Therefore, the potential yield of each crop variety and the growth phase are important factors that affect N2 fixation. The Ndfa percentages values recorded in the three Sardinia sites were within the range (44-95 % Ndfa) provided for the same grain legume by Howieson et al. (1998) in Australia.
High values of fixed N were always found, except for Sanluri in the second year, indicating a remarkable N2 fixation potential of white lupine in Sardinian sites if com-pared to recent results obtained by Cazzato et al. (2012) who reported values of about 70 kg ha−1 of fixed N for the
same cultivar grown in central Italy. The peak values re-corded at Stintino were about three-fold higher than those reported for white lupine by Sparrow et al. (1995) and Carranca et al. (2009) in Alaska and Portugal, respectively, however, within the range of values reported by Carranca et al. (2013) for L. luteus grown in similar conditions and by Espinoza et al. (2012) in the Mediterranean environ-ment of the Andes foothills (Chile). The fixed N values recorded in the three sites were within the range (144-400 kg N ha−1 in shoots) provided for white lupine in Australia
(Howieson et al., 1998).
Our results also evidenced a different distribution of fixed N in the white lupine organs with a relevant allocation into pods with seeds that contained, on average, about 75 % of the total plant fixed N. Moreover, our results highlighted that pod walls contained about 19 % of the total plant-fixed N. In particular, as an average of years and sites, the proportion of pod wall weight of complete pods at harvest was 42 %, higher than the mean values reported by Espinoza-Lagunes et al. (2000) for 27 Italian accessions of white lupine. Carranca et al. (2013) found 50 % for L. luteus at maturity and 93 % for
L. albus at pod filling.
When only grain is harvested without shoots removal, more than 40 % of the total plant fixed N is left in the soil by crop residue and their peak of absolute values exceeded that recorded for field bean in Sardinia (Sulas et al., 2013). According to Australian findings (Evans et al., 2001), the net effect of grain legume N2 fixation on soil N balance ranges widely in lupine (-29 to 247 kg N ha−1), depending on experimental conditions
and crop species.
In our study, N accumulated in the recoverable roots of white lupine was 5 % of the total plant N on average, very close to the value of 6 % reported by Car-ranca et al. (2009) for Portugal. This value was quite low if compared to the estimates of Espinoza et al. (2012) for Table 9 − Relationship between fixed N and plant organ.
Plant organ Equation R2
Grain y=0.0595x-20.595 0.88
Pod valve y=0.0342x-19.124 0.78
Shoot y=0.0082x-1.5313 0.77
the Mediterranean conditions of Chile (33 % of shoot total N). The same authors, in the absence of direct mea-surements of root and nodule N, have applied a “root factor” proposed by Unkovich et al. (2010) to estimate the belowground N of white lupine. However, our find-ings are lower if referred to the potential contribution of roots and nodules (up to 40 % to the total plant N) estimated by Unkovich and Pate (2000) for white lupine grown in a glasshouse in the absence of combined N. In addition, Mayer et al. (2003) studied the N rhizodeposi-tion (i.e. organic and inorganic N compounds released from living roots) for white lupinein pots that was esti-mated to account for 16 % of the total plant N and 80 % of the total belowground N. Therefore, our estimates are likely to be conservative, because only recoverable roots were considered in our study. Finally, we found that the relationship between fixed N and DMY was very differ-ent between grain, pod valves, shoots and roots, high-lighting the need to distinguish the contribution from different plant portions in N2 fixation. For example, the fixed N of white lupine grain per ton of grain DM pro-duced was about ten-fold higher than that of roots. How-ever, the average of 21 kg of N fixed per ton of white lupine plant biomass was similar to that recorded for the same species in the Mediterranean environment of Chile (Espinoza et al., 2012) and for field bean in Sar-dinia (Sulas et al., 2013) and for L. angustifolius in eastern Australia (Peoples et al., 2001).
Conclusion
In conclusion, the productive performances and the ability of white lupine to fix N2 greatly varied between locations and climatic conditions. However, the results indicate a remarkable N2 fixation capacity by this grain legume grown under Mediterranean conditions. Pods with seeds accounted for about 75 % of the total plant fixed N with an important contribution from pod valves. When N balance was positive, 18-65 % of the total plant fixed N is left in the field if grain is harvested and root N accounted for an average of 5 % of the total plant N. The relationship between fixed N and DM widely differed between plant organs. This information is useful for a precise definition of N inputs according to the possible uses of white lupine crop and/or its residues in Mediterranean farming systems where white lupine can undoubtedly represent an additional crop option and a valuable N source.
Acknowledgements
The authors wish to thank Dr. Antonio Demelas from LAORE Agency of Sardinia for his collaboration, Dr. Stefano Taras for hosting the experimental trial in his farm and Ms. Maria Maddalena Sassu and Mr. Piero Saba at CNR/ISPAAM and Mr. Maurizio Pitzalis at CRA/ AAM for their valuable technical assistance in the field and laboratory.
References
Annicchiarico, P. 2008. Adaptation of cool-season grain legume species across climatically contrasting environments of southern Europe. Agronomy Journal 100: 1647-1654.
Annicchiarico, P.; Harzic, N.; Carroni, A.M. 2010. Adaptation, diversity, and exploitation of global white lupin (Lupinus albus L.) landrace genetic resources. Field Crop Research 119: 114-124. Annicchiarico, P.; Manunza, P.; Arnoldi, A.; Boschin, G. 2014.
Quality of Lupinus albus L. (white lupin) seed: extent of genotypic and environmental effects. Journal of Agricultural and Food Chemistry 62: 6539-6545.
Boschin, G.; D’Agostina, A.; Annicchiarico, P.; Arnoldi, A. 2008. Effect of genotype and environment on fatty acid composition of
Lupinus albus L. seed. Food Chemistry 108: 600-606.
Carranca, C.; Torres, M.O.; Baeta, J. 2009. White lupine as beneficial crops in Southern Europe. I. Potential for N mineralization in lupine amended soil and yields and N2 fixation by white lupine. European Journal of Agronomy31: 183-189.
Carranca, C.; Madeira, M.; Torres, M.O. 2013. N2 fixation by two lupine species under different soil management systems. Transfer of N2 fixed from legume to intercropped eucalyptus. Revista de Ciências Agrárias 36: 71-83.
Cazzato, E.; Laudadio, V.; Stellacci, A.M.; Ceci, E.; Tufarelli, V. 2012. Influence of sulphur application on protein quality, fatty acid composition and nitrogen fixation of white lupin (Lupinus albus L.). European Food Research and Technology 235: 963-969. Chiofalo, B.; Lo Presti, V.; Chiofalo, V.; Gresta, F. 2012. The
productive traits, fatty acid profile and nutritional indices of three lupin (Lupinus spp.) species cultivated in a Mediterranean environment for the livestock. Animal Feed Science and Technology 171: 230-239.
European Commission [EC]. 2013. Regulation (EU) No 1307/2013 of the European Parliament and of the Council. Official Journal of the European Union L 347: 608-670.
Espinoza, S.; Ovalle, C.; Zagal, E.; Matus, I.; Tay, J.; Peoples, M.B.; Del Pozo, A. 2012. Contribution of legumes to wheat productivity in Mediterranean environments of central Chile. Field Crops Research 133: 150-159.
Espinoza-Lagunes, L.C.; Huyghe, C.; Papineau, J. 2000. Genetic variation for pod wall proportion in Lupinus albus. Plant Breeding 119: 421-425.
Evans, J.; McNeill, A.M.; Unkovich, M.; Fettell, N.A.; Heenan, D.P. 2001. Net nitrogen balances for cool-season grain legumes crops and contributions to wheat nitrogen uptake: a review. Australian Journal of Experimental Agriculture 41: 347-359.
Gomez, K.A.; Gomez, A. 1984. Statistical Procedures for Agricultural Research. Wiley, New York, NY, USA.
Guillamón, E.; Cuadrado, C.; Pedrosa, M.M.; Varela, A.; Cabellos, B.; Muzquiz, M.; Burbano, C. 2010. Breadmaking properties of wheat flour supplemented with thermally processed hypoallergenic lupine flour. Spanish Journal of Agricultural Research 8: 100-108.
Huyghe, C. 1997. White lupin (Lupinus albus L.). Field Crops Research 53: 147-160.
Jansen, P.C.M. 2006. Lupinus albus L. In: Brink, M.; Belay, G., eds. Plant resources of tropical Africa. Wageningen, Netherlands. Available at http://www.prota4u.org/search.asp [Accessed Feb. 17, 2015]
Jensen, E.S.; Peoples, M.B.; Boddey, R.M.; Gresshoff, P.M.; Hauggaard-Nielsen, H.; Alves, B.J.; Morrison, M.J. 2012. Legumes for mitigation of climate change and the provision of feedstock for biofuels and biorefineries: a review. Agronomy for Sustainable Development 32: 329-364.
Kerley, S.J. 2000. The effect of soil liming on shoot development, root growth, and cluster root activity in white lupins. Biology and Fertility of Soils 32: 94-101.
Kerley, S.J.; Norgaard, C.; Leach, J.E.; Christiansen, J.L.; Huyghe, C.; Römer, P. 2002. The development of potential screens based on shoot calcium and iron concentrations for the evaluation of tolerance in Egyptian genotypes of white lupin (Lupinus albus
L.) to limed soils. Annals of Botany 89: 341-349.
Lambers, H.; Clements, J.C.; Nelson, M.N. 2013. How a phosphorus-acquisition strategy based on carboxylate exudation powers the success and agronomic potential of lupines (Lupinus, Fabaceae). American Journal of Botany 100: 263-288.
Larson, K.J.; Cassman, K.G.; Phillips, D.A. 1989. Yield, dinitrogen fixation, and aboveground nitrogen balance of irrigated white lupin in a Mediterranean climate. Agronomy Journal 81: 538-543.
Laudadio, V.; Tufarelli, V. 2011. Dehulled-micronised lupin (Lupinus albus L. cv. Multitalia) as the main protein source for broilers: influence on growth performance, carcass traits and meat fatty acid composition. Journal of the Science of Food and Agriculture 91: 2081-2087.
Lopez-Bellido, L.; Fuentes, J.C.B.; Lhamby, J.E.; Castillo, J.E. 1994. Growth and yield of white lupin (Lupinus albus) under Mediterranean conditions: effect of sowing date. Field Crops Research 36: 87-94.
Mayer, J.; Buegger, F.; Jensen, E.S.; Schloter, M.; Hess, J. 2003. Estimating N rhizodeposition of grain legumes using a 15N in situ stem labelling method. Soil Biology and Biochemistry 35: 21-28.
Moschini, V.; Casella, G.; Vivoli, R.; Vazzana, C.; Martini, A.; Lotti, C.; Migliorini, P. 2014. Performance of organic grain legumes in Tuscany. Italian Journal of Agronomy 9: 38-43.
Peoples, M.B.; Bowman, A.M.; Gault, R.R.; Herridge, D.F.; McCallum, M.H.; McCormick, K.M.; Norton, R.M.; Rochester, I.J.; Scammell, G.J.; Schwenke, G.D. 2001. Factors regulating the contributions of fixed nitrogen by pasture and crop legumes to different farming systems of eastern Australia. Plant and Soil 228: 29-41.
Peoples, M.B.; Brockwell, J.; Herridge, D.F.; Rochester, I.J.; Alves, B.R.; Urquiaga, S.; Boddey, R.M.; Dakora, F.D.; Bhattarai, S.; Maskey, S.L.; Sampet, C.; Rerkasem, B.; Khans, D.F.; Hauggaard-Nielsen, H.; Jensen, E.S. 2009. The contributions of nitrogen-fixing crop legumes to the productivity of agricultural systems: a review. Symbiosis 48: 1-17.
Petterson, D.S. 1998. Composition and food uses of lupins. p. 353-384. In: Gladstones, J.S.; Atkins, C.; Hamblin, J., eds. Lupins as crop plants: biology, production and utilization. CAB International, Wallingford, UK.
Piepho, H.P.; Buchse, A.; Emrich, K. 2003. A hitchhiker’s guide to mixed models for randomised experiments. Journal of Agronomy and Crop Science 189: 310-322.
Sinclair, T.R.; Vadez, V. 2012. The future of grain legumes in cropping systems. Crop Pasture Science 63: 501-512.
Sparrow, S.D.; Cochran, V.L.; Sparrow, E.B. 1995. Dinitrogen fixation by seven legume crops in Alaska. Agronomy Journal 87: 34-41.
Sulas, L.; Seddaiu, G.; Muresu, R.; Roggero, P.P. 2009. Nitrogen fixation of sulla under Mediterranean conditions. Agronomy Journal 101: 1470-1478.
Sulas, L.; Roggero, P.P.; Canu, S.; Seddaiu, S. 2013. Potential nitrogen source from field bean (Vicia faba minor L.) under Mediterranean conditions. Agronomy Journal 105: 1735-1742. Unkovich, M.J.; Pate, J.S. 2000. An appraisal to recent field
measurements of symbiotic N2 fixation by annual legumes. Field Crops Research 65: 211-228.
Unkovich, M.; Herridge, D.; Peoples, M.; Cadisch, G.; Boddey, B.; Giller, K.; Alves, B.; Chalk, P. 2008. Measuring plant-associated nitrogen fixation in agricultural systems. ACIAR, Canberra, Australia. (ACIAR Monograph, 136).
Unkovich, M.J.; Baldock, J.; Peoples, M.B. 2010. Prospects and problems of simple linear models for estimating symbiotic N2 fixation by crop and pasture legumes. Plant and Soil 329: 75-89. Warembourg, F.R. 1993. Nitrogen fixation in soil and plant