ABSTRACT: Knowledge of the hydraulic properties of the soil is of crucial importance to an understanding of the interactions between vegetation, soil and water. There is little information available about the hydraulic properties of Podzol soils found in tropical regions. The aim of this study was to present the soil morphology and hydraulic properties of a toposequence situated in a permanent plot at the Ilha do Cardoso State Park (Cananéia, SP, Brazil). Ultradetailed soil maps were used to define a toposequence inside the permanent plot. Five profiles, representing the main types of soil, were opened along the toposequence, in which Podzols are dominant. The levels of bulk density, sand content, porosity and permeability in these soils were all high. Consequently, these soils have a high level of hydraulic conductivity with low water retention. This behavior undergoes an alteration in the Bh and Bs horizons due to the accumulation of organic and metallic compounds and a changing structure that modifies the pore distribution. Further-more, the characterization of the hydro-physical functioning of soils in natural environments is an important source of encouragement to further investigative study of soil water dynamics and its relationship to the native vegetation.
Keywords:Podzols, soil morphology, soil hydraulic properties
Hydro-physical characterization of soils under the Restinga Forest
Miguel Cooper1*, Raquel Stucchi Boschi1, Laura Fernanda Simões da Silva1, Raul Shiso Toma2, Pablo Vidal-Torrado1
1University of São Paulo/ESALQ − Dept. of Soil Science,
Av. Pádua Dias, 11, C.P. 09 − 13418-900 − Piracicaba, SP − Brazil.
2Federal University of Ceará/CCA − Dept. of Soil Science,
Av. Mister Hull, 2977 − 60356-001 − Fortaleza, CE − Brazil. *Corresponding author <[email protected]>
Edited by: Paulo Cesar Sentelhas
Received March 11, 2016 Accepted May 14, 2016
Introduction
The high number of biotic and abiotic factors af-fecting the development of native vegetation results in environmental systems that are very complex. Soil hy-draulic properties (SHP) have been recognized as impor-tant abiotic factors in the attempt to better understand the heterogeneity of these systems (Budke et al., 2007; Cooper et al., 2013). A knowledge of SHP is essential to understanding water flow and solute transport in both saturated and unsaturated soils. These properties can also be used to define soil management practices and can assist in the restoration of natural areas.
The Ilha do Cardoso State Park (IC) is an impor-tant area for conservation, housing different coastal eco-systems such as mangroves, dunes, the Restinga and the Atlantic forest (Ribeiro et al., 2009). In the Restinga, Pod-zols are dominant and most studies in tropical regions focus on their genesis and classification (Gomes et al., 2007; Buurman et al., 2013). Tropical Podzols are mainly hydromorphic sandy soils, strongly acidic, and frequent-ly deep, with low nutrient status. These poorfrequent-ly drained Podzols typically present below an E (albic) horizon a flat and thick B horizon (Bh, Bhm) enriched in organic mat-ter (OM), with or without aluminum oxides, that have been laterally transported by water as dissolved OM, and accumulated where they have come to rest by sev-eral mechanisms (Buurman and Jongmans, 2005). When compared to other tropical forests, the Restinga presents shorter stature, lower species diversity and shallow roots (Miyamoto et al., 2003; Lima et al., 2011). These features are frequently associated with the limiting soil charac-teristics observed in this environment (Lima et al., 2011; Bonilha et al., 2012).
The necessity to expand the knowledge of soils under native vegetation and their relationship has been recognized as a research priority by several researchers (Lima et al., 2011; Cooper et al., 2012; Santos-Filho et al., 2013). The close relationship between soil attributes and forest composition has long been reported in the lit-erature (Sollins, 1998), and SHP have been considered an important factor to be considered in studies involving soil-plant relationships (Ruggiero et al., 2002; Quesada et al., 2004; Oliveira et al., 2005).
The aim of this study was to present the soil mor-phology and SHP of a toposequence situated in a perma-nent research plot at the IC (Cananéia, SP, Brazil). The characterization of the SHP in natural environments will prove useful to an understanding of the relationship be-tween the soil and native vegetation.
Materials and Methods
Study area
The study was conducted at Ilha do Cardoso State Park (48°05’42” W, 25°03’05” S and 48°53’48” W, 25°18’18” S), which has an area of approximately 13,500 ha, located in the municipality of Cananéia, in the state of São Paulo. The altitude ranged from 0 to 950 m. The climate is characterized as megathermal super humid without a dry season and excessive rain in summer (Af), according to the Köppen climate classification (Alvares et al., 2013). The annual rainfall is 2,216 mm and the mean annual temperature 22.3 °C.
Ilha do Cardoso State Park is on the coastal plain of São Paulo, which was formed by sandy sediments of the Santos Formation (Suguio and Martin, 1976) de-rived from holocenic marine transgressions (Gomes et
al., 2007). The marine terrace where the study area is located was formed by the reworking of old and succes-sive sandy beach ridges whose remnants today form the highest parts of the landscape. There is, therefore, a re-cent geomorphological heritage that directly influences the local hydrology. In the contact zone with the sea, sandy deposits are found brought in by recent changes in sea level and tidal activity thus forming a topochrono-sequence in a north-south direction.
The representative permanent plot of 10.24 ha, lo-cated in the Restinga forest was divided into 256 sub-plots of 20 × 20 m, based on planialtimetric surveys. Detailed soil maps were used to define a toposequence (N-S direc-tion) that represents the main soil types found in the per-manent plot (Gomes et al., 2007) (Figure 1). Five profiles were opened, in which the morphological description was completed according to Lemos and Santos (2013) and the soils classified according to the International Classifica-tion System (WRB, 2014). The morphological descripClassifica-tion and vertical and lateral distribution of the soil horizons in the toposequence were generated according to the struc-tural analysis technique proposed by Boulet et al. (1982).
Soil attributes
Disturbed and undisturbed soil samples were col-lected from all horizons of each soil profile along the toposequence. Undisturbed 100 cm3 soil cores were used
to determine soil bulk density (ρb) (Blake and Hartge,
1986), porosity and water retention curves (SWRC). The disturbed samples were used to assess parti-cle size distribution (Gee and Bauder, 1986) and partiparti-cle density (ρb) (Vomocil, 1965). Three fractions were thus
determined according to the USDA particle size classifi-cation system: clay (< 2 µm), silt (2 a 50 µm) and sand (50 a 2000 µm). The sand fraction was divided into fine sand (50 to 250 µm) and coarse sand (250 to 2000 µm).
The samples for SWRC were obtained in three rep-licates from at least three depths for each profile. The SWRC was obtained at nine matric potentials. A tension table was used for measuring the soil water retention at matric potentials of -1, -3, -5, -8 and -10 kPa and pres-sure chambers for matric potentials of -33, -100, -500 and -1500 kPa (Klute, 1986). The water retention data were then fitted to the van Genuchten (1980) equation:
θ θ θ θ
ψ
= + −
+
(
)
s r
a n
m
1
where θr is the residual moisture content (cm3 cm−3), θs
the saturated moisture content (dimensionless), y the ab-solute value of the matric potential (kPa), aa parameter corresponding approximately to the inverse of the air-entry value (kPa−1), and n and m are shape parameters.
Total porosity (TP) was obtained from the SWRC. Microporosity was determined by using a tension table at a potential of -5 kPa, according to Topp and Zebchuk (1979) and macroporosity from the difference between total porosity and microporosity.
The Water Content Reflectometer (WCR) was used to monitor the soil volumetric water content in situ. The sensors were installed in the main soil horizons of the profiles. The calibration coefficients were derived from a curve fit of known water content and WCR output. The procedure adopted was described by Kim and Ben-son (2002). The system was maintained by a 12V bat-tery charged by a solar panel. Data were obtained every 20 min and stored in the data logger. In the field, the records were collected every 20 days, using keyboard commands connected to a storage modulus. The system was in operation for one year.
Rainfall data were collected by an automatic weather station, located between one and two kilome-ters from the area of study. These data were recorded every 15 min and stored in the data logger.
Saturated hydraulic conductivity was determined in three replicates for each horizon of the five profiles using the Guelph permeameter method (Reynolds et al., 1983). The single-head Richard’s analysis (Elrick et al., 1989) was used to calculate hydraulic conductivity.
Results and Discussion
According to the World Reference Base for Soil Re-sources (FAO, 2014), the soils of the transect were classi-fied as Arenosol Gleyic Protospodic (P1), Podzol Arenic (P2, P3), Podzol Gleyic Histic (P4) and Podzol Gleyic Ort-steinic (P5) (Figure 1 and Table 1).
The dominant soil class in the plot was the Podzol, in which podzolization is the main pedogenetic process in the formation of these soils. The Podzol profiles pres-ent the following sequence of horizons: A, E, followed by a spodic horizon (Bh, Bhm) with different levels of cementation. Spodic horizons were characterized by the illuviation of humic acid, with or without Fe2+ and Al3+
oxyhydroxides and aluminosilicates (Gomes et al., 2007). The Arenosol found in P1 presented a sequence of horizons; A, E, C and differed from the Podzols be-cause of the absence of a spodic horizon, which can be linked to the fact that P1 was located in the younger part of the topochronosequence. The presence of the Protospodic qualifier indicated intermediate character-istics of Podzol. All horizons in the Arenosol profile pre-sented a small granular and single grain structure type (Table 1). The color of the A horizon indicated absent or minor amounts of coloring materials such as organic matter (OM) and sesquioxides (10YR, 7/1). Nonetheless, the subsurface horizons presented colors from brown (10YR, 5/3) to dark yellowish brown (10YR, 4/4; 10YR, 3/4), as a result of the presence of organic matter and metallic compounds (Table 1).
An abrupt transition was observed in the soil de-velopment along the toposequence between profile 1 and profiles 2, 3, 4 and 5. This coincided with the abrupt change in topography observed between these profiles (Figure 1). P1 was formed on a lower topographic surface closer to the beach line and developed from recent coastal
sediments, whilst P2, P3, P4 and P5 developed in higher positions along the toposequence that are part of the older holocenic sandy marine terraces. These differences in al-titude and parent material along the toposequence led to the formation of younger and less developed soils in the lower topographic positions when compared to the more developed soils at the higher positions.
For the Podzols, the dominant structure type in all superficial horizons A was small granular and single grain, while massive and single grain structures char-acterized the spodic horizons. The E horizons had a single grain structure type (Table 1). The color of A ho-rizonsexhibited hues of 10YR with values of 2 to 7 and chromas of 1 to 2. The A horizons in profiles P2 and P3 showed lighter colors, similar to the color observed in the Arenosol (10YR, 7/1). However, in profiles P4 and P5 the A horizon had a darker brown color, indicating the presence of organic matter (10YR 4/2, 10YR 2/2). The color of the E horizon of P2, P3 P4 and P5 exhibited light colors due to the loss of organic matter by eluviation to subjacent horizons or by microbiological degradation Table 1 − Soil morphological descriptions for the five profiles of the toposequence in the permanent plot at Ilha do Cardoso State Park (Cananéia, SP, Brazil).
Horizon (Depth in m) Color moist (Munsell)
Structure Drainage class Type Degree¶ Profile P1 – Arenosol Gleyic protospodic
A (0 - 0.20) 10 YR 7/1 gr small; sg 3 to 2 P/VP E (0.20 - 0.32) 10 YR 5/3 gr small; sg 3 to 2 P/VP C1 (0.32 - 0.66) 10 YR 3/4 gr small; sg 3 to 2 P/P C2 (0.66 - 1.26+) 10 YR 4/4 gr small; sg 3 to 2 P/VP
Profile P2 – Podzol Hortic Arenic
A (0 - 0.15) 10 YR 7/1 gr small; sg 3 to 2 P/VP
AE (0.15 - 0.25) 2.5 Y 6/1 sg P/VP
E álbico (0.25 - 0.57) 10 YR 7/1 sg P/VP
Bs (0.57 - 1.20+) 10 YR 4/2 sg P/VP
Profile P3 – Podzol Hortic Arenic
A (0 - 0.10) 10 YR 7/1 gr small; sg 3 to 2 P/VP
E álbico (0.10 - 0.90) 10 YR 8/1 sg P/VP
Bh (0.90 - 1.03) 10 YR 2/1 M 1/cemented P/VP
Bs (1.03 - 1.40+) 10 YR 4/2 sg P/VP
Profile P4 – Podzol Gleyic Histic
Ah (0 - 0.27) 10 YR 4/2 gr small VP
E álbico (0.27 - 0.47) 2.5 YR 6/1 sg VP
Bh (0.47 - 0.75) 10 YR 2/1 M 1/cemented VP
Bs (0.75 - 1.15) 10 YR 2/2 M VP
Bs/Cg (1.15 - 1.40+) 10 YR 3/4 sg/m VP
Profile P5 – Podzol Gleyic Ortsteinic
A (0 - 0.12) 10 YR 2/2 gr small; sg VP
E álbico (0.12 - 0.48) 10 YR 7/1 sg VP
Bh (0.48 - 0.65) 10 YR 3/1 m VP
Bs orstein (0.65 - 0.90) 10 YR 3/2 m 3 VP
Bs (0.90 - 1.10) G1 3/10 Y m VP
Cg (1.10 - 1.30+) G1 2.5/10 Y m VP
(Buurman and Jongmans, 2005; Buurman et al., 2013). The spodic horizons exhibited darker colors at the top, which usually became brownish at greater depths (10 YR 4/2, 10 YR 2/1, 10 YR 2/2, 10 YR 3/1, 10 YR 3/2).
All profiles showed a very poor to poor drain-age, indicating the constant presence of the water table during the year, which results in a hydromorphic envi-ronment. The presence of thick Bh and Bhm horizons with flat and very sharp transitions in relation to the E horizon, as noted in the field morphological descrip-tions (Table 1), characterized poorly drained Podzols. It is evident that the hydrology has a major effect on the morphology of Podzols as described by Buurman et al. (2013).
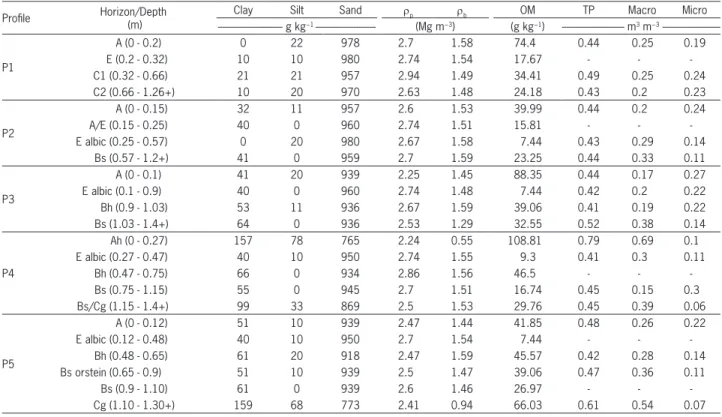
Most of the samples presented a sandy texture (Table 2) with sand contents superior to 90 %, except for the Ah (sandy loam), Bs/Cg (P4) (loamy sand) and Cg (P5) horizons (loamy sand) (Table 2). The ρb values ranged from 0.55 to 1.59 Mg m−3, with a mean value of
1.45 Mg m−3 (Table 2). The relatively high ρ
b is in strong
agreement with the high sand content of the horizons (Table 2). The lowest values occurred in Ah (P4) and Cg (P5) horizons, due to the higher clay and OM contents in these horizons.
The ρpshowed high valuesfor all the horizons, ranging from 2.24 to 2.94 Mg m−3. The narrow range of
values also showed that the soil particles of these soils had a similar constitution.
In general, the horizons presented high TP mainly due to the high sand content (Table 2). The values of TP ranged between 0.41 m3 m−3 and 0.79 m3 m−3 with a mean of 0.47
m3 m−3. The Ah (P4) and Cg (P5) horizons showed the
high-est TP, which can be explained by the low bulk density val-ues, particle size distribution and OM content (Table 2).
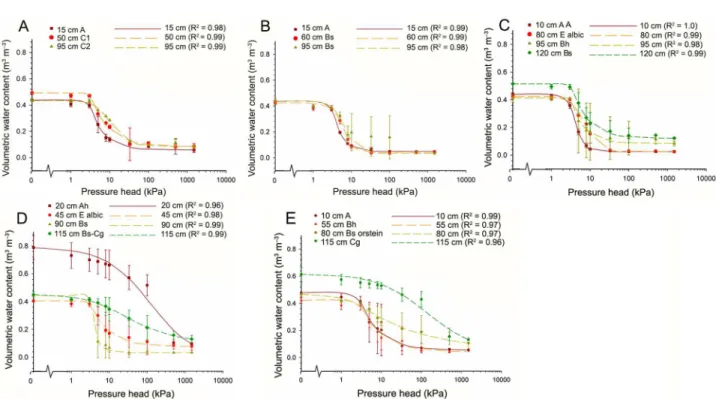
Figures 2A, B, C, D and E present the SWRCs of all profiles. All profiles presented horizons with high values of water content in the higher matric potentials, indicat-ing that these horizons have a well-developed macropo-rosity and, therefore, good water conduction. Moreover, the SWRCs also showed that as the matric potential de-creases the soil dries quickly reaching very low moisture values at the lower potentials (< -30 kPa). The domi-nance of macropores over micropores in these sandy horizons promotes better water conduction than water retention. In horizons, where the clay and OM content are high, there is a balanced distribution of macropores and micropores which favors water retention.
The SWRCs for P1 and P2 were very similar (Fig-ure 2A and B), indicating that these profiles had a similar pore size distribution. The shape of the curves of each horizon was also very close, especially for P2, due to the relatively homogeneous structure type along the profile (Table 1). For both sites the presence of a granular struc-ture led to a high macroporosity. The high microporosity in the spodic horizon in P2 was probably attributable to the clay increase observed in this horizon.
Table 2 − Percentage of clay, silt, sand, particle density (ρp), bulk density (ρb), organic matter content (OM), total porosity (TP), macroporosity
(Macro) and microporosity (Micro) of the horizons of the five profiles (P1 to P5) of the toposequence at Ilha do Cardoso State Park (Cananéia, SP, Brazil).
Profile Horizon/Depth
(m)
Clay Silt Sand ρp ρb OM TP Macro Micro
--- g kg−1 --- (Mg m−3) (g kg−1) --- m3 m−3
---P1
A (0 - 0.2) 0 22 978 2.7 1.58 74.4 0.44 0.25 0.19
E (0.2 - 0.32) 10 10 980 2.74 1.54 17.67 - -
-C1 (0.32 - 0.66) 21 21 957 2.94 1.49 34.41 0.49 0.25 0.24
C2 (0.66 - 1.26+) 10 20 970 2.63 1.48 24.18 0.43 0.2 0.23
P2
A (0 - 0.15) 32 11 957 2.6 1.53 39.99 0.44 0.2 0.24
A/E (0.15 - 0.25) 40 0 960 2.74 1.51 15.81 - -
-E albic (0.25 - 0.57) 0 20 980 2.67 1.58 7.44 0.43 0.29 0.14
Bs (0.57 - 1.2+) 41 0 959 2.7 1.59 23.25 0.44 0.33 0.11
P3
A (0 - 0.1) 41 20 939 2.25 1.45 88.35 0.44 0.17 0.27
E albic (0.1 - 0.9) 40 0 960 2.74 1.48 7.44 0.42 0.2 0.22
Bh (0.9 - 1.03) 53 11 936 2.67 1.59 39.06 0.41 0.19 0.22
Bs (1.03 - 1.4+) 64 0 936 2.53 1.29 32.55 0.52 0.38 0.14
P4
Ah (0 - 0.27) 157 78 765 2.24 0.55 108.81 0.79 0.69 0.1
E albic (0.27 - 0.47) 40 10 950 2.74 1.55 9.3 0.41 0.3 0.11
Bh (0.47 - 0.75) 66 0 934 2.86 1.56 46.5 - -
-Bs (0.75 - 1.15) 55 0 945 2.7 1.51 16.74 0.45 0.15 0.3
Bs/Cg (1.15 - 1.4+) 99 33 869 2.5 1.53 29.76 0.45 0.39 0.06
P5
A (0 - 0.12) 51 10 939 2.47 1.44 41.85 0.48 0.26 0.22
E albic (0.12 - 0.48) 40 10 950 2.7 1.54 7.44 - -
-Bh (0.48 - 0.65) 61 20 918 2.47 1.59 45.57 0.42 0.28 0.14
Bs orstein (0.65 - 0.9) 51 10 939 2.5 1.47 39.06 0.47 0.36 0.11
Bs (0.9 - 1.10) 61 0 939 2.6 1.46 26.97 - -
Figure 2 − Soil water retention curve for different horizons of the five profiles in the Ilha do Cardoso permanent plot: A) Profile 1; B) Profile 2; C) Profile 3; D) Profile 4; E) Profile 5.
The P3 SWRCs showed similar behavior to the SWRCs of P1 and P2, except for the deeper horizons Bh and Bs. In these horizons, the moisture content at higher potentials (> –30 kPa) was higher than in other horizons in the profile (Figure 2C). This behavior is pos-sibly a result of the increase in the OM and clay content at greater depths. The massive structure in Bh favored higher water retention in comparison to the Bs horizon, which presented a single grain structure type (Figure 2C). The SWRCs for P4 and P5 showed high moisture con-tent at the lower pocon-tentials for all horizons (Figure 2D and E). However, when the potential became more negative, the water content decreased by a different amount for each horizon. Soil texture and structural attributes were directly related to the SWRC behavior. The Ah (P4) and Cg (P5) horizons had the lowest moisture decrease as the matric po-tential became more negative again probably attributable to the high OM and clay contents. The reduction in clay content and OM in the E and Bs horizons of P4 resulted in lower moisture content when compared to the Ah horizon. Despite the Bs/Cg presenting a similar structure type to Bs, an increase in clay and OM at greater depth resulted in higher moisture content at all matric potentials (P4).
In P5, the amount of clay and OM in Cg favored higher moisture content compared to the other horizons. The horizons A, Bh and Bs orstein had similar values of clay and OM; however, the hard massive structure of the Bs orstein led to an increase in water retention at low potentials. The grain structure type of A horizon favored high water retention at high potentials.
The increase in depth of the clay and OM contents in the Bs/Cg and Cg horizons of P4 and P5, respectively, that affected water retention is not related to the podzol-ization processes that occur in the shallowest horizons (between the A, E and Bh or Bs horizons), but it provides evidence of the depositing of clayey marine sediments before the holocenic marine transgression (Suguio and Martin, 1976). These less permeable horizons control the water table level in this zone.
Figure 3 − Temporal soil moisture dynamics and rainfall for different horizons of the five profiles in the Ilha do Cardoso permanent plot: A) Profile 1; B) Profile 2; C) Profile 3; D) Profile 4; E) Profile 5. The horizons were monitored between Sept/2004 and Dec/2005. The “?” indicates lack of data.
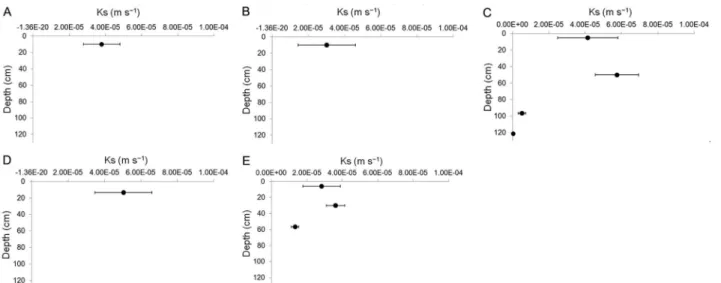
Figure 4 − Saturated hydraulic conductivity (Ks) for different horizons of the five profiles in the Ilha do Cardoso permanent plot (mean and standard deviation): A) Profile 1; B) Profile 2; C) Profile 3; D) Profile 4; E) Profile 5.
15 months for all the horizons monitored, except for the A horizons of profiles P2, P3 and P4 (Figure 3B, C and D). The lack of data for the A horizon of the P5 was due to a problem in the sensor (Figure 3E). The fluctuations in surface horizons coincide with either rainy events or consecutive dry periods. The lack of soil moisture fluctua-tions in subsurface horizons is due to the presence of the water table at this depth and is a source of permanent saturation in these horizons. This behavior is demon-strated by morphological field observations and analysis of the soil moisture monitoring data. The sub-superficial soil moisture values measured in the field coincide with the saturated moisture content in water retention curves (Figure 3A, B, C, D and E). This means that for all the profiles the water table level is high throughout the year reaching almost the soil surface.
The presence of a tall Restinga forest in the perma-nent plot of Ilha do Cardoso, as described by Lima et al. (2011), could be the result of the soils being under per-manent saturated conditions. The authors associate sev-eral characteristics of forest structure with soil attributes, such as a low richness of species related to the very acid, hydromorphic and periodically flooded soils. This type of Restinga forest represents one of the rarest and most threatened vegetation types of the already deforested Bra-zilian Atlantic forest (Ribeiro et al., 2009).
Due to the high water table at the time of field measurements, in the case of a number of horizons the saturated hydraulic conductivity could not be evaluated. Only for P3 was it possible to perform measurements for all horizons (Figure 4C). For the other profiles, only the surface horizons were measured (Figures 4A, B, D and E). The values of saturated hydraulic conductivity (Ks) ranged from 10−5 to 10−7.
rep-resent porous media with high permeability, 10−6 porous
intermediate permeability and 10−7 a porous media with
low permeability. In the surface horizons, the dominance of a sandy texture with a single grain structure type favored the occurrence of interconnected macropores, resulting in high permeability. For subsurface horizons, permeability ranged from low to high. In P3, the Ks for E horizon (45 cm) were higher than the other horizons, probably due to the low amount of OM and structure represented by single grains (Figure 4C). The deeper horizons showed lower K values due to the massive structure and high concentration of OM. In P5 (Figure 4E), the E horizon (30 cm) exhibited similar behavior to the same horizon in P4 (Figure 4D). For the deepest layer, the presence of high bulk density, high OM content and massive structure results in lower Ks.
Conclusions
The soils of the transect studied showed low re-tention and high water conduction, except for when the sand stratification (size and sorting) and organic matter contents, added to the soil structure, contributed to lower conduction and increased retention. The presence of per-manently saturated horizons and the climate of the region contributed to the non-occurrence of water stress which probably influences the type of local vegetation. The high permeability of the surface horizons can be explained by the presence of a sandy texture and simple grain struc-ture. The hydro-physical properties of these soils are af-fected by the Podzolization process and the presence of clayey marine sediments at greater depths deposited be-fore the depositing of the current sandy sediments.
Acknowledgments
This study was supported by the São Paulo State Foundation for Research Support (FAPESP) as part of the BIOTA/FAPESP Program "The Virtual Institute of Bio-diversity". The authors would like to thank André Op-pitz Ketzer, Bruno Gherardi, Dorival Grisotto and Valter Novais for their support in the field activities. We would like to thank the Brazilian National Council for Scien-tific and Technological Development (CNPq) and the São Paulo State Foundation for Research Support (FAPESP) for the scholarships and fellowships.
References
Alvares, C.A.; Stape, J.L.; Sentelhas, P.C.; Gonçalves, J.L.M.; Sparovek, G. 2013. Koppen’s climate classification map for Brazil. Meteorologische Zeitschrift 22: 711-728.
Blake, G.R.; Hartge, K.H. 1986. Bulk density. p. 363-375. In: Klute. A., ed. Methods of soil analysis, physical and mineralogical methods. ASA, Madison, WI, USA.
Bonilha, R.M.; Casagrande, J.C.; Soares, M.R.; Reis-Duarte, R.M. 2012. Characterization of the soil fertility and root system of Restinga forests. Revista Brasileira de Ciência do Solo 36: 1804-1813.
Boulet, R.; Chauvel, A.; Humbel, F.X.; Lucas, Y. 1982. Structural analysis and soil mapping. II. An analytical method including the tridimensional organization of soil covers = Analyse structurale et cartographie en pédologie. II. Une méthode d'analyse prenant en compte l'organisation tridimensionnelle des couvertures pédologiques. Cahiers Orstom Séries Pédologie 19: 309-321 (in French).
Budke, J.C.; Jarenkow, J.A.; Oliveira-Filho, A.T. 2007. Relationships between tree component structure, topography and soils of a riverside forest, Rio Botucaraí, Southern Brazil. Plant Ecology 189: 187-200.
Buurman, P.; Vidal-Torrado, P.; Martins, V.M., 2013. The Podzol hydrosequence of Itaguaré (São Paulo, Brazil). 1. Geomorphology and interpretation of profile morphology. Soil Science Society of America Journal 77: 1294.
Buurman, P.; Jongmans, A.G. 2005. Podzolisation and soil organic matter dynamics. Geoderma, 125:71-83.
Cooper, M.; Medeiros, J.C.; Rosa, J.D.; Soria, J.E.; Toma, R.S. 2013. Soil functioning in a toposequence under rainforest in São Paulo, Brazil. Revista Brasileira de Ciência do Solo 37: 392-399.
Cooper, M.; Rosa, J.D.; Medeiros, J.C.; Oliveira, T.C.; Toma, R.S.; Juhász, C.E.P. 2012. Hydro-physical characterization of soils under tropical semi-deciduous forest. Scientia Agricola 69: 152-159.
Elrick, D.E.; Reynolds, W.D.; Tan, K.A. 1989. Hydraulic conductivity measurements in the unsatured zone using improved well analyses. Ground Water Monitoring and Remediation 9: 184-193.
Food and Agriculture Organization of the United Nations [FAO]. 2014. World reference base for soil resources 2014. International soil classification system for naming soils and creating legends for soil maps. p. 181. FAO, Rome, Italy. (World Soil Resources Reports, 106).
Gee, G.W.; Bauder, J.W. 1986. Particle size analysis. p. 383-411. In: Klute, A., ed. Methods of soil analysis. 2ed. ASA, Madison, WI, USA.
Gomes, F.H.; Vidal-Torrado, P.; Macías, F.; Gherardi, B.; Perez, X.L.O. 2007. Soils under Restinga vegetation on the Cardoso Island (SP). I. Characterization and classification = Solos sob vegetação de Restinga na Ilha do Cardoso (SP). I. Caracterização e classificação. Revista Brasileira de Ciência do Solo 31: 1563-1580 (in Portuguese).
Kim, K.C.; Benson, C.H. 2002. Water content reflectometer calibrations for final cover soils. University of Wisconsin, Madison, WI, USA. (Geo Engineering Report, 02-12).
Klute, A. 1986. Water retention: laboratory methods. p. 635-662. In: Klute, A., ed. Methods of soil analysis: physical and mineralogical methods. 2ed. ASA, Madison, WI, USA. Lemos, R.C.; Santos, R.D. 2013. Manual of Description and Soil
Sampling on Field = Manual de Descrição e Coleta de Solo no Campo. 6ed. Brazilian Society of Soil Science, Viçosa, MG, Brazil (in Portuguese).
Miyamoto, K.; Suzuki, E.; Kohyama, T.; Seino, T.; Mirmanto, E.; Simbolon, H. 2003. Habitat differentiation among tree species with small-scale variation of humus depth and topography in a tropical heath forest of Central Kalimantan, Indonesia. Journal of Tropical Ecology 19: 43-54.
Oliveira, R.S.; Bezerra, L.; Davidson, E.A.; Pinto, F.; Klink, C.A.; Nepstad, D.C.; Moreira, A. 2005. Deep root function in soil water dynamics in Cerrado savannas of Central Brazil. Functional Ecology 19: 574-581.
Quesada, C.A.; Miranda, A.C.; Hodnett, M.G.; Santos, A.J.B.; Miranda, H.S.; Breyer, L.M. 2004. Seasonal and depth variation of soil moisture in a burned open savanna (campo sujo) in Central Brazil. Ecological Applications 14: 33-41.
Reynolds, W.D.; Elrick, D.E.; Topp, G.C. 1983. A re-examination of the constant head well permeameter method for measuring saturated hydraulic conductivity above the water table. Soil Science 136: 250-268.
Reynolds, W.D.; Elrick, D.E.A. 1986. Method for simultaneous in situ measurement in the vadose zone field saturated hydraulic conductivity, sorptivity and the conductivity-pressure head relationship. Groundwater Monitoring & Remediation 6: 84-95. Ribeiro, M.C.; Metzger, J.P.; Martensen, A.C.; Ponzoni, F.J.;
Hirota, M.M. 2009. The Brazilian Atlantic forest: how much is left, and how is the remaining forest distributed? Implications for conservation. Biological Conservation 142: 1141-1153.
Ruggiero, P.G.C.; Batalha, M.A.; Pivello, V.R.; Meirelles, S.T. 2002. Soil-vegetation relationships in cerrado (Brazilian Savanna) and semi deciduous forest. Southeastern Brazil. Plant Ecology 160: 1-16.
Santos-Filho, F.S.; Almeida, E.B.; Zickel, C.S. 2013. Do edaphic aspects alter vegetation structures in the Brazilian Restinga? Acta Botanica Brasilica 27: 613-623.
Sollins, P. 1998. Factors influencing species composition in tropical lowland rain forest: does soil matter? Ecology 79: 23-30. Suguio, K.; Martin, L. 1976. Brazilian coastline quaternary
formations: the states of São Paulo and Bahia littoral zone evolutive schemes. Anais da Academia Brasileira de Ciências 48: 325-334.
Topp, G.C.; Zebchuk, W. 1979. The determination of soil water desorption curves for soil cores. Canadian Journal of Soil Science 59: 19-26.
van Genuchten, M.T. 1980. A closed-form equation for predicting the hydraulic conductivity of unsaturated soils. Soil Science Society of America Journal 44: 892-898.