Brazilian Archives of Biology and Technology Vol.48, n. 5 : pp. 825-839, September 2005
ISSN 1516-8913 Printed in Brazil
BRAZILIAN ARCHIVES OF
BIOLOGY AND TECHNOLOGY
A N I N T E R N A T I O N A L J O U R N A LStructure of Molluscan Assemblages in Sheltered Intertidal
Unconsolidated Environments
Márcia Regina Denadai
1*, Antonia Cecilia Zacagnini Amaral
1and Alexander Turra
21
Departamento de Zoologia; Instituto de Biologia; UNICAMP; 13.083-970; Campinas - SP - Brasil. Laboratório de Biologia Aquática; Curso de Ciências Biológicas; Campus II; Fundação de Ensino Octávio Bastos; 2UNIFEOB; 13.870-159; São João da Boa Vista - SP - Brasil
ABSTRACT
The molluscan macrofauna from 13 oceanic sheltered intertidal unconsolidated environments and its relationship with abiotic factors were studied in order to establish the degree of species richness and to understand the role environment plays in structuring such assemblages. Four distinct intertidal habitat types were recognized based on molluscan assemblage descriptors (diversity, richness and density) and abiotic characteristics. The mean grain size (in phy units) and the beach slope showed a negative relationship with the diversity, richness and density. Coarser sediments were favorable to molluscan fauna in the study areas, contrasting the well-known negative effect of this type of sand on fauna in typical oceanic beaches. The low-tide terraces, typical from tide-dominated areas, and the presence of physical (rocky fragments) and biogenic (gravel) structures, were also associated to the higher values of richness. The high richness in the study area as a whole seemed to be a direct consequence of its environmental heterogeneity, once it was composed by quite distinct habitat types.
Key words:Intertidal, molluscan assemblage, beach structure, environmental heterogeneity
* Author for correspondence
INTRODUCTION
The structure of sandy beach benthic communities is strongly affected by physical conditions such as wave action, sediment composition, and beach slope (McLachlan, 1983; 1996; Dexter, 1983; Borzone et al., 1996; Omena and Amaral, 1997). In general, macrofauna species richness increases from exposed to sheltered sandy beaches, being the molluscs the most representative group in sandy beaches with moderate hydrodynamism (McLachlan, 1983).
Human or natural impacts, which alter the hydrodynamic conditions or the substrate characteristics, and consequently the morphodynamics of a beach, may affect species
1995), while studies in sheltered heterogeneous environments are less common (McQuaid and Dower, 1990; Brown et al.,1991; Rizzo and Amaral, 2000; Denadai et al., 2001; Amaral et al., 2003).
Sheltered marine sandy beaches are uncommon on most of the Brazilian coast, but are abundant on the northern coast of the State of São Paulo, especially along the São Sebastião Channel. These beaches afford a varied array of environments and, in general, support a rich intertidal fauna (Amaral et al., 1990; Omena and Amaral, 1997; Denadai and Amaral, 1999; Rizzo and Amaral, 2000; Nucci et al., 2001), in which the molluscs are an important component.
We describe here the structure of the molluscan macrofauna assemblages in 13 unconsolidated intertidal environments in the São Sebastião Channel and Caraguatatuba Bay. Different structural characteristics of the study areas, the relationships of species richness, diversity, and abundance of individuals with the abiotic factors were calculated in order to understand how molluscan assemblages were organized, and to enable estimates of the outcome of eventual natural or man-made environmental alterations.
MATERIAL AND METHODS
Study area
The São Sebastião Channel is located on the northern coast of the State of São Paulo, Brazil (Fig. 1) between São Sebastião Island and the mainland. The channel is bounded by Canas Top (45021’W; 23043’S) to the north, Sela Top
(45027’W; 23052’S) to the south and lined by
different types of sandy beaches, which vary from sandy-muddy to sand with rock fragments. This study was performed in intertidal areas located on 12 of these sandy beaches (Fig. 1), eight on the mainland (Enseada, Cigarras, São Francisco, Pontal da Cruz, Araçá, Grande, Segredo, and Barequeçaba), and four on São Sebastião Island (Garapocaia, Siriúba, Engenho d´Água, and Barra Velha). These are low-energy (sheltered and very sheltered) sandy beaches, according the exposure rating system of McLachlan (1980), and have a 2 m maximum tidal range (Furtado and Mahiques, 1990). According to Short (1996), the higher
influence of tides in relation to waves leads to a tide-dominated hydrodynamism.
Sampling and data treatment
Thirteen unconsolidated environments named “sectors” were established on these beaches, intending to characterize the environmental diversity of the channel. Two sectors were selected in Araçá, due to the presence (sector II) or absence (sector I) of gravel mixed to the mud. The sectors were fixed 10-m-wide strips that covered the entire intertidal region. Samples were taken monthly in these strips between August 1995 and July 1997 during spring low tides. Sampling periods and efforts were not coincident at all the study sectors (see below, Table 1). For quantitative sampling, two sizes of cylindrical corers were used, a smaller (0.01 m2 base area) and a larger (0.16 m2). The
samples were stratified into three “strata” parallel to the water line. Fifteen random samples (five in each stratum) were taken monthly with the small corer, and nine (three in each stratum) with the large corer in each sector. A coordinate x/y arrangement was used to locate the sorting samples in a 10 x 10 m area delimited in each stratum. The sediment was collected from a depth of 20 cm. The biological samples obtained with the large corer were washed with seawater in the coastal laboratory through a 1.0-mm-mesh sieve and that obtained with the small corer in 1.0 and 0.5-mm-mesh superimposed sieves. This method guaranteed the collection of the smallest individuals from macrofauna and also benefited the abundance estimate by sampling a larger area. The molluscs were preserved in 70% ethanol, identified to species, and counted. Salinity of the interstitial water (3 samples/stratum) was measured monthly. Seasonal (quarterly) sediment samples (3 samples/stratum) were taken for the analyses of granulometry and calcium carbonate and organic matter contents. Sediment grain size was evaluated after manual removal of the rocks, following Suguio (1973). This method consisted in weigh the dry sand grains according to Wentworth scale in phi units [ =-log2 (mean grain diameter in
Figure 1 - Location of the study sites at the São Sebastião Channel, São Paulo State, Brazil.
Data analysis
The values of sand grain diameter, sorting coefficient, salinity and contents of silt-clay, calcium carbonate, and organic matter were averaged for each sector and compared among them through the Kruskal-Wallis non-parametric test using seasonal/monthly samples as temporal replicates. The density of individuals recorded in each sample of two corer sizes was converted to ind.m-2 and used to calculate monthly mean
densities for each sector. The total mean densities of individuals of each species in each sector were calculated by taking the monthly means of all samples as replicates. The total mean densities of each species in the entire channel were calculated by averaging the means of all sectors. The total densities provided an overall estimate of diversity (H’ - Shannon-Wiener index, log2), evenness (J’),
and dominance (D - Simpson’s index,) for each sector and for the entire channel over the whole study period (Krebs, 1989).
RESULTS
Characterization of the environments
The abiotic factors varied among the sectors (Kruskal-Wallis, p<0.05 for all variables, see below Fig. 3). The sites on Enseada, Barequeçaba, Araçá I, and Grande beaches had very fine sands, well sorted at two former and moderately sorted at the later two sites. Among the sectors constituted by fine sand, Cigarras had well-sorted grains and Barra Velha poorly-sorted, while moderately-sorted sediment was characteristic of Segredo and Araçá II. All the sectors with coarse sand dominating (São Francisco, Pontal da Cruz, Garapocaia, Siriúba, and Engenho d´Água) had poorly-sorted grains. The sector at Barra Velha had the highest contents of silt-clay and organic matter, while the highest calcium carbonate content was recorded in the sectors of Araçá, mainly in II. Small rivulets flew into almost all the study beaches, and caused significant variation in salinity within and among sectors. São Francisco and Engenho d´Água had rock fragments mixed to the sand. The intertidal slopes varied markedly among the sectors, being steeper in Segredo, Cigarras and Pontal da Cruz, while Enseada was the flattest sector.
Structure of the molluscan assemblages
The number of species tended to reach an asymptote during the sampling period (Denadai, 2001) in all sectors and an overall total of 76 species was recorded. Most species were accidental (sensu Dajoz, 1977) and few were abundant (Table 1), but not dominant in relation to the entire channel. The most abundant species in the channel as a whole were the gastropods Cerithium atratum, Olivella minuta, and Bulla striata, and the bivalves Anomalocardia brasiliana, Tagelus plebeius, Semele proficua, and Tellina lineata.
Low molluscan density and species richness were recorded at Cigarras, Pontal da Cruz, Grande, Segredo and Barequeçaba (Table 1). The high
measured dominance in Grande and Segredo beaches were an artifact of their small numbers of species. Density and species richness were highest at São Francisco, Engenho d´Água, Barra Velha and Araçá (I and II). The highest values of diversity were recorded at Engenho d´Água, where the number of species was the highest, and at Barra Velha, where no individual species dominated. Despite the large number of species at São Francisco, diversity and evenness were low, because of the dominance of the bivalve A. brasiliana (56.8% of total individuals). The numerical importance of certain species in other sectors was responsible for the low measurements of evenness and the high dominance index in the assemblages: T. plebeius, 89.3% of the total of molluscan individuals in Enseada; C. atratum, 45.4% in Engenho d´Água; O. minuta, 36.0% and 41.3%, and A. brasiliana, 27.2% and 31.2%, respectively, in Araçá I and II. Intermediate density, diversity, and richness were recorded in Garapocaia and Siriúba, where the fauna was dominated by T. lineata (53.6%) and A. brasiliana (54%), respectively.
Assemblage structure and abiotic factors
Brazilian Archives of Biology and Technology
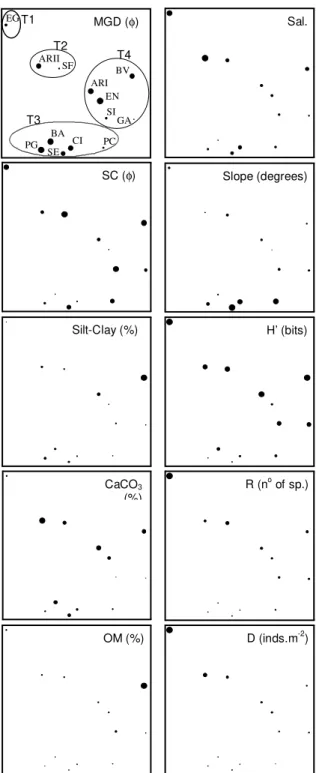
Figure 2 -Non-metric multidimensional scaling analysis (n-MDS) of the study intertidal environments in relation to abiotic factors and community descriptors using Bray-Curtis distance measure and original (non-transformed) data. The environmental marks and the group delimitations are the same as in the first graphic. (MGD = mean grain diameter; SC = sorting coefficient; Silt-clay content, CaCO3 = calcium carbonate content; OM = organic matter content; Sal. = salinity; Slope) and the assemblage descriptors (H’= Shannon-Wiener diversity index; R = species richness; D = density - individuals.m-2). Symbols with
different sizes (diameters) represent the magnitude of each variable (abiotic and biotic). All variables showed a significant variation among sectors (Kruskal-Wallis, P<0.05 for all comparisons). Percent of variance explained: Axis 1 = 41.7 % and Axis 2 = 54.5 %. The intertidal sectors were grouped into four types (T1 to T4). En = Enseada; Ci = Cigarras; SF = São Francisco; PC = Pontal da Cruz; AraI = Araçá I; AraII = Araçá II; PG = Praia Grande; Se = Segredo; Ba = Barequeçaba; Ga = Garapocaia; Si = Siriúba; EA = Engenho d’Água; BV = Barra Velha.
SC (φ)
Silt-Clay (%)
CaCO3
(%)
OM (%)
Sal.
Slope (degrees)
H’ (bits)
R (no of sp.)
D (inds.m-2)
EN
CI SF
PC ARI ARII
PG SE
BA
GA SI EG
BV
MGD (φ) T1
T2
T3
High variation in sediment constitution and slope was recorded in the sectors of this group. Sectors with low slope (or presence of a low-tide terrace), low salinity, and intermediate richness composed the last group (T4 - Enseada, Araçá I, Garapocaia, Siriúba and Barra Velha). These four groups were also identified, but at a lower similarity level, even when only the numbers of species and individuals of each species of each environment were considered (Fig. 4), although Enseada was not grouped within T4 due to the dominance of Tagelus plebeius.
The multiple stepwise regression analyses combined a negative influence of the mean grain diameter (in units, positive in mm), with a negative influence of slope and a positive influence of salinity in species richness and density (Table 2), i.e., the coarser the sand, the higher the salinity and the lower the slope, the higher the richness and density. Higher silt-clay contents were positively correlated with species diversity when interacting with grain size and beach slope.
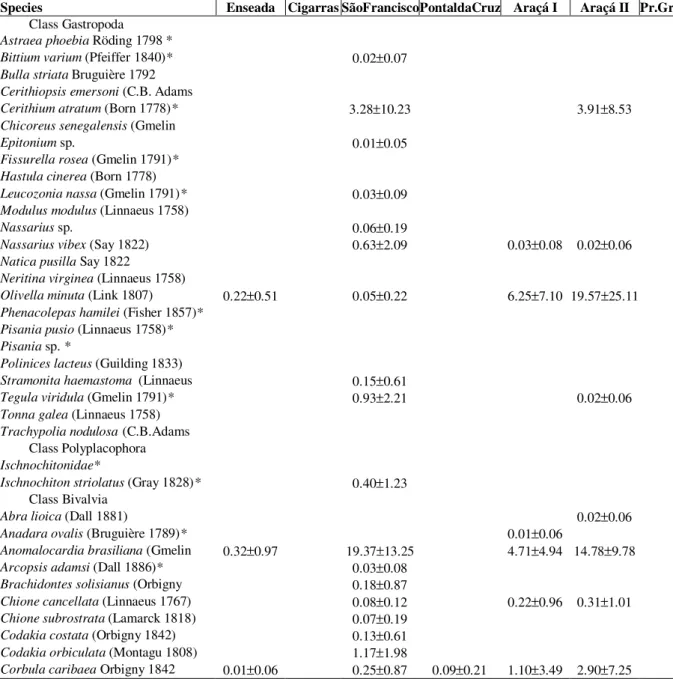
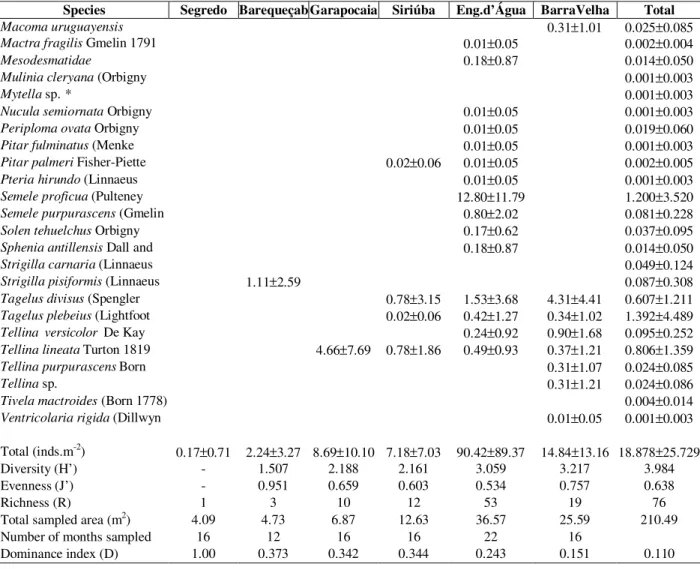
Table 1 - Molluscan densities (mean ± standard deviation of the number of individuals/m2) and indexes of Shannon
diversity (H’), dominance (D) and evenness (J’) in the studied intertidal sectors at São Sebastião Channel. *, indicates the species living in association to hard substrate.
Species Enseada Cigarras SãoFranciscoPontaldaCruz Araçá I Araçá II Pr.Grande
Class Gastropoda Astraea phoebia Röding 1798 *
Bittium varium (Pfeiffer 1840)* 0.02±0.07 Bulla striata Bruguière 1792
Cerithiopsis emersoni (C.B. Adams 1838)*
Cerithium atratum (Born 1778)* 3.28±10.23 3.91±8.53 Chicoreus senegalensis (Gmelin
1790)*
Epitonium sp. 0.01±0.05
Fissurella rosea (Gmelin 1791)* Hastula cinerea (Born 1778)
Leucozonia nassa (Gmelin 1791)* 0.03±0.09 Modulus modulus (Linnaeus 1758)
Nassarius sp. 0.06±0.19
Nassarius vibex (Say 1822) 0.63±2.09 0.03±0.08 0.02±0.06 Natica pusilla Say 1822
Neritina virginea (Linnaeus 1758)
Olivella minuta (Link 1807) 0.22±0.51 0.05±0.22 6.25±7.10 19.57±25.11 Phenacolepas hamilei (Fisher 1857)*
Pisania pusio (Linnaeus 1758)* Pisania sp. *
Polinices lacteus (Guilding 1833) Stramonita haemastoma (Linnaeus 1767)*
0.15±0.61
Tegula viridula (Gmelin 1791)* 0.93±2.21 0.02±0.06
Tonna galea (Linnaeus 1758) Trachypolia nodulosa (C.B.Adams 1845)Class Polyplacophora* Ischnochitonidae*
Ischnochiton striolatus (Gray 1828)* 0.40±1.23 Class Bivalvia
Abra lioica (Dall 1881) 0.02±0.06
Anadara ovalis (Bruguière 1789)* 0.01±0.06
Anomalocardia brasiliana (Gmelin
1791) 0.32±0.97 19.37±13.25 4.71±4.94 14.78±9.78 Arcopsis adamsi (Dall 1886)* 0.03±0.08
Brachidontes solisianus (Orbigny 1846)*
0.18±0.87
Chione cancellata (Linnaeus 1767) 0.08±0.12 0.22±0.96 0.31±1.01 Chione subrostrata (Lamarck 1818) 0.07±0.19
Codakia costata (Orbigny 1842) 0.13±0.61 Codakia orbiculata (Montagu 1808) 1.17±1.98
Corbula caribaea Orbigny 1842 0.01±0.06 0.25±0.87 0.09±0.21 1.10±3.49 2.90±7.25
Brazilian Archives of Biology and Technology Cont. Table 1
Species Enseada Cigarras SãoFranciscoPontaldaCruz Araçá I Araçá II Pr.Grande
Corbula cubaniana Orbigny 1853 2.60±8.05
Corbula sp.1 0.10±0.42 0.55±1.42
Corbula sp.2 0.61±2.01
Diplodonta punctata (Say 1822) 0.09±0.15 0.38±1.53 0.44±1.61 Diplodonta semiaspera (Philippi 1836) 0.01±0.05
Donax gemmula Morrison 1971 0.40±1.82 1.39±3.12 0.01±0.06 0.69±1.62 Dosinia concentrica (Born, 1778)
Ervilia nitens (Montagu 1806) Gouldia cerina (C.B.Adams 1845) Heterodonax bimaculata (Linnaeus 1758)
Iphigenia brasiliana (Lamarck 1818) 0.39±1.62 1.61±4.08 0.39±1.62 Leavicardium brasilianum (Lamarck
1819)
Limaria pelucida (C.B.Adams 1846)* Lioberus castaneus (Say 1822)*
Lucina pectinata (Gmelin 1791) 0.88±1.96 0.23±0.95
Macoma constricta (Bruguière 1792) 0.51±1.57 0.10±0.25 1.48±2.47 0.47±1.60 Macoma uruguayensis (E.A.Smith
1885) 0.01±0.06
Mactra fragilis Gmelin 1791 0.01±0.05 Mesodesmatidae
Mulinia cleryana (Orbigny 1846) 0.01±0.06
Mytella sp. * 0.01±0.05
Nucula semiornata Orbigny 1846
Periploma ovata Orbigny 1846 0.22±0.96 0.02±0.06
Pitar fulminatus (Menke 1828) Pitar palmeri Fisher-Piette and Testude 1967
Pteria hirundo (Linnaeus 1758)*
Semele proficua (Pulteney 1799) 0.61±1.27 0.44±1.91 1.76±5.12
Semele purpurascens (Gmelin 1791) 0.25±1.01
Solen tehuelchus Orbigny 1843 0.31±1.04 Sphenia antillensis Dall and Simpson
1901
Strigilla carnaria (Linnaeus 1758) 0.39±1.18 0.25±1.01
Strigilla pisiformis (Linnaeus 1758) 0.02±0.06
Tagelus divisus (Spengler 1794) 0.01±0.05 0.48±1.30 0.78±1.66 Tagelus plebeius (Lightfoot 1786) 16.31±10.03 0.20±0.87 0.02±0.08 0.03±0.08 0.77±2.20
Tellina versicolor De Kay 1843 0.01±0.06 0.08±0.20
Tellina lineata Turton 1819 0.02±0.07 2.42±3.37 1.37±2.45 0.37±1.06 Tellina purpurascens Born 1778
Tellina sp.
Tivela mactroides (Born 1778) 0.05±0.10 Ventricolaria rigida (Dillwyn 1817)
Total (inds.m-2) 18.26±9.57 1.78±4.10 34.08±28.82 2.34±4.30 17.34±14.1247.38±30.39 0.69±1.62
Diversity (H’) 0.887 0.805 2.553 1.170 2.710 2.326
-Evenness (J’) 0.256 0.805 0.526 0.585 0.638 0.538
-Richness (R) 11 2 29 4 19 20 1
Total sampled area (m2) 21.64 3.94 36.57 4.53 28.77 19.83 4.73
Number of months sampled 22 16 22 11 14 18 16
Cont. Table 1
Species Segredo Barequeçab
a Garapocaia Siriúba Eng.d’Água BarraVelha Total
Class Gastropoda
Astraea phoebia Röding 1798 0.13±0.61 0.010±0.035
Bittium varium (Pfeiffer 1840)*
0.001±0.005
Bulla striata Bruguière 1792 5.61±8.28 0.431±1.556
Cerithiopsis emersoni (C.B. Adams 1838)*
0.01±0.05 0.001±0.003
Cerithium atratum (Born 1778)*
0.08±0.27 0.25±1.01 41.05±78.37 3.735±11.290 Chicoreus senegalensis
(Gmelin 1790)*
0.01±0.05 0.001±0.003
Epitonium sp. 0.001±0.003
Fissurella rosea (Gmelin 1791)*
0.05±0.13 0.003±0.013
Hastula cinerea (Born 1778) 0.56±1.92 0.043±0.154
Leucozonia nassa (Gmelin 1791)*
0.08±0.17 0.008±0.023 Modulus modulus (Linnaeus
1758) 0.08±0.15 0.006±0.022
Nassarius sp. 0.01±0.05 0.005±0.016
Nassarius vibex (Say 1822) 0.02±0.06 0.01±0.05 0.32±1.01 0.079±0.188
Natica pusilla Say 1822 0.36±1.20 0.028±0.100
Neritina virginea (Linnaeus
1758) 0.20±0.87 0.016±0.056
Olivella minuta (Link 1807) 0.58±1.92 1.48±3.67 0.78±1.75 2.226±5.484 Phenacolepas hamilei (Fisher
1857)*
0.23±0.86 0.017±0.063 Pisania pusio (Linnaeus
1758)*
0.03±0.12 0.003±0.009
Pisania sp. * 0.01±0.05 0.001±0.003
Polinices lacteus (Guilding
1833) 0.01±0.05 0.001±0.003
Stramonita haemastoma (Linnaeus 1767)*
0.01±0.05 0.012±0.042 Tegula viridula (Gmelin
1791)*
0.26±0.87 0.092±0.261
Tonna galea (Linnaeus 1758) 0.02±0.06 0.001±0.004
Trachypolia nodulosa (C.B.Adams 1845)*
1.13±2.11 0.087±0.313 Class Polyplacophora
Ischnochitonidae* 0.01±0.05 0.001±0.003
Ischnochiton striolatus (Gray 1828)*
3.79±5.20 0.322±1.049 Class Bivalvia
Abra lioica (Dall 1881) 0.08±0.15 0.007±0.021
Anadara ovalis (Bruguière 1789)*
0.02±0.06 0.002±0.005 Anomalocardia brasiliana
(Gmelin 1791) 0.68±1.86 3.88±4.56 0.40±1.19 2.77±2.98 3.608±6.257
Arcopsis adamsi (Dall 1886)* 3.75±3.98 0.291±1.040
Brachidontes solisianus (Orbigny 1846)*
0.014±0.050 Chione cancellata (Linnaeus
1767) 0.20±0.87 0.062±0.108
Chione subrostrata (Lamarck
1818) 1.12±2.31 0.092±0.310
Codakia costata (Orbigny
1842) 0.39±1.62 0.28±1.07 0.85±1.52 0.02±0.06 0.128±0.251 Codakia orbiculata (Montagu
1808) 7.94±5.34 0.06±0.17 0.706±2.198
Corbula caribaea Orbigny
1842 0.39±1.62 0.30±0.86 0.03±0.09 0.391±0.813
Corbula cubaniana Orbigny
1853 0.78±2.10 0.260±0.736
Corbula sp.1 0.050±0.153
Corbula sp.2 0.047±0.168
Diplodonta punctata (Say
1822) 0.02±0.06 2.46±3.20 0.260±0.679
Diplodonta semiaspera
(Philippi 1836) 0.37±1.20 0.030±0.103
Donax gemmula Morrison
1971 0.17±0.71 0.08±0.32 0.211±0.411
Dosinia concentrica (Born,
1778) 0.01±0.05 0.001±0.003
Ervilia nitens (Montagu 1806) 0.03±0.10 0.02±0.06 1.03±2.89 1.18±4.85 0.173±0.414 Gouldia cerina (C.B.Adams
1845) 0.64±1.51 0.049±0.178
Heterodonax bimaculata
(Linnaeus 1758) 0.02±0.06 0.02±0.06 0.002±0.006
Iphigenia brasiliana (Lamarck
1818) 0.81±2.20 0.247±0.481
Leavicardium brasilianum
(Lamarck 1819) 0.01±0.05 0.001±0.003
Limaria pelucida (C.B.Adams 1846)*
0.01±0.04 0.001±0.002 Lioberus castaneus (Say
1822)*
0.19±0.87 0.015±0.053 Lucina pectinata (Gmelin
1791) 1.39±1.98 0.193±0.437
Macoma constricta (Bruguière
Brazilian Archives of Biology and Technology Cont. Table 1
Species Segredo Barequeçab
a Garapocaia Siriúba Eng.d’Água BarraVelha Total
Macoma uruguayensis
(E.A.Smith 1885) 0.31±1.01 0.025±0.085
Mactra fragilis Gmelin 1791 0.01±0.05 0.002±0.004
Mesodesmatidae 0.18±0.87 0.014±0.050
Mulinia cleryana (Orbigny
1846) 0.001±0.003
Mytella sp. * 0.001±0.003
Nucula semiornata Orbigny
1846 0.01±0.05 0.001±0.003
Periploma ovata Orbigny
1846 0.01±0.05 0.019±0.060
Pitar fulminatus (Menke
1828) 0.01±0.05 0.001±0.003
Pitar palmeri Fisher-Piette
and Testude 1967 0.02±0.06 0.01±0.05 0.002±0.005
Pteria hirundo (Linnaeus 1758)*
0.01±0.05 0.001±0.003 Semele proficua (Pulteney
1799) 12.80±11.79 1.200±3.520
Semele purpurascens (Gmelin
1791) 0.80±2.02 0.081±0.228
Solen tehuelchus Orbigny
1843 0.17±0.62 0.037±0.095
Sphenia antillensis Dall and
Simpson 1901 0.18±0.87 0.014±0.050
Strigilla carnaria (Linnaeus
1758) 0.049±0.124
Strigilla pisiformis (Linnaeus
1758) 1.11±2.59 0.087±0.308
Tagelus divisus (Spengler
1794) 0.78±3.15 1.53±3.68 4.31±4.41 0.607±1.211
Tagelus plebeius (Lightfoot
1786) 0.02±0.06 0.42±1.27 0.34±1.02 1.392±4.489
Tellina versicolor De Kay
1843 0.24±0.92 0.90±1.68 0.095±0.252
Tellina lineata Turton 1819 4.66±7.69 0.78±1.86 0.49±0.93 0.37±1.21 0.806±1.359 Tellina purpurascens Born
1778 0.31±1.07 0.024±0.085
Tellina sp. 0.31±1.21 0.024±0.086
Tivela mactroides (Born 1778) 0.004±0.014
Ventricolaria rigida (Dillwyn
1817) 0.01±0.05 0.001±0.003
Total (inds.m-2) 0.17±0.71 2.24±3.27 8.69±10.10 7.18±7.03 90.42±89.37 14.84±13.16 18.878±25.729
Diversity (H’) - 1.507 2.188 2.161 3.059 3.217 3.984
Evenness (J’) - 0.951 0.659 0.603 0.534 0.757 0.638
Richness (R) 1 3 10 12 53 19 76
Total sampled area (m2) 4.09 4.73 6.87 12.63 36.57 25.59 210.49
Number of months sampled 16 12 16 16 22 16
Dominance index (D) 1.00 0.373 0.342 0.344 0.243 0.151 0.110 2
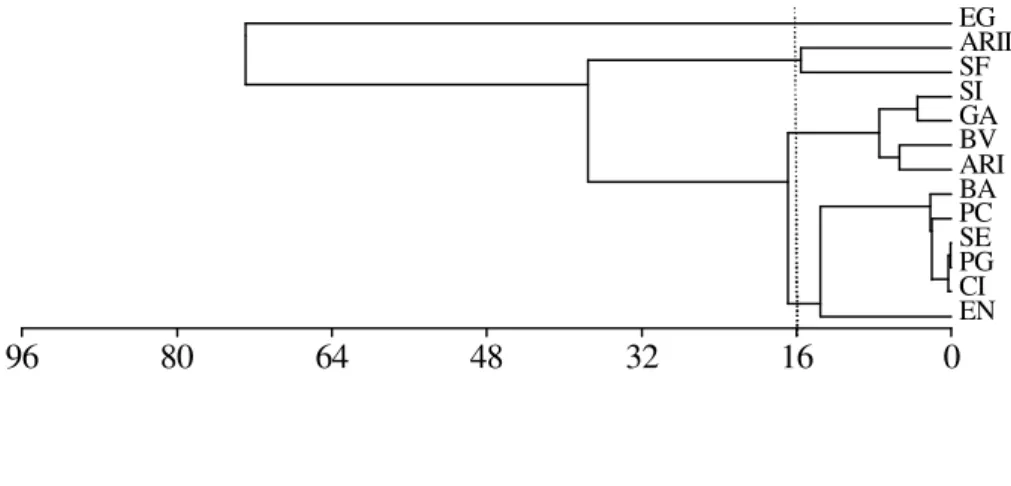
Figure 3 - Cluster analysis of the study intertidal environments in relation to abiotic factors and assemblage descriptors (H’, R and D) using the minimum variance method (Ward) and squared Euclidean distance. No transformations were employed. Dashed line indicates the cut-off level that generated four groups. See caption of Figure 2 for label legend.
Environmental variables and community descritpors
Minimum variance - Squared Euclidean
EN ARI GA SI BV CI SE PC PG BA SF ARII EG
9600 8000 6400 4800 3200 1600 0
T1 T2
Figure 4 - Cluster analysis of the study intertidal environments in relation to number of species and individuals in each species using the minimum variance method (Ward), the squared Euclidean distance and squared-root transformed data. Dashed line indicates the cut-off level that generated four groups. See caption of Figure 2 for label legend.
Table 2 - Multiple stepwise regressions between the descriptors (diversity, richness and density) of the molluscan assemblages and the abiotic factors: mean grain diameter (MGD - units), sorting coefficient (SC - units), salinity† (Sal), slope† (degrees), and silt-clay† (Silt - %), calcium carbonate† (CC - %) and organic matter† (OM - %)
contents. The analyses were conducted comparing all sectors and removing the sectors with sand and rocky fragments - São Francisco (SF) and Engenho d’Água (EA). Only the independent variables (abiotic) with significant regression coefficients (β) are shown (p<0.05).
Dependent variable Equation n r2 p
All sectors
Diversity (H’) Y = 3.627 - 0.866MGD + 1.664Silt - 2.965Slope 13 0.688 0.012 Richness (R) † Y = -4.414 - 0.238MGD + 4.457Sal - 1.264Slope 13 0.787 0.002
Density (Inds.m-2) † Y = -7.794 - 0.249MGD + 6.934Sal - 1.678Slope 13 0.875 <0.001
Without SF and EA
Diversity (H’) Y = 0.128 - 0.697MGD + 3.560CaCO3 + 2.404OM 11 0.696 0.031
Richness (R) † Y = 1.321 - 0.270MGD + 1.040CaCO
3 - 1.090Slope 11 0.751 0.016
Density (Inds.m-2) † Y = -5.421 - 0.187MGD + 5.144Sal - 1.637Slope 11 0.852 0.003 † log transformation employed.
When the sectors composed of sand and rock fragments (São Francisco and Engenho d’Água) were omitted, the results changed slightly (Table 2). Density was influenced by the same variables in the same way. The diversity was negatively influenced by the sand grain diameter ( ), and positively by the calcium carbonate and organic matter contents. The richness was negatively influenced by the sand grain diameter ( ) and slope, and positively by the calcium carbonate content.
DISCUSSION
The diversity in the sandy beach macrofauna generally shows a tendency to be higher in sheltered environments than in exposed ones (McLachlan, 1983; see Table 3). A less clear tendency of decrease in richness could be evidenced in a latitudinal gradient (Table 3).
Species composition
Minimum variance -Squared Euclidean - Data square-root transformed
EN CI PG SE PC BA ARI BV GA SI SF ARII EG
Brazilian Archives of Biology and Technology
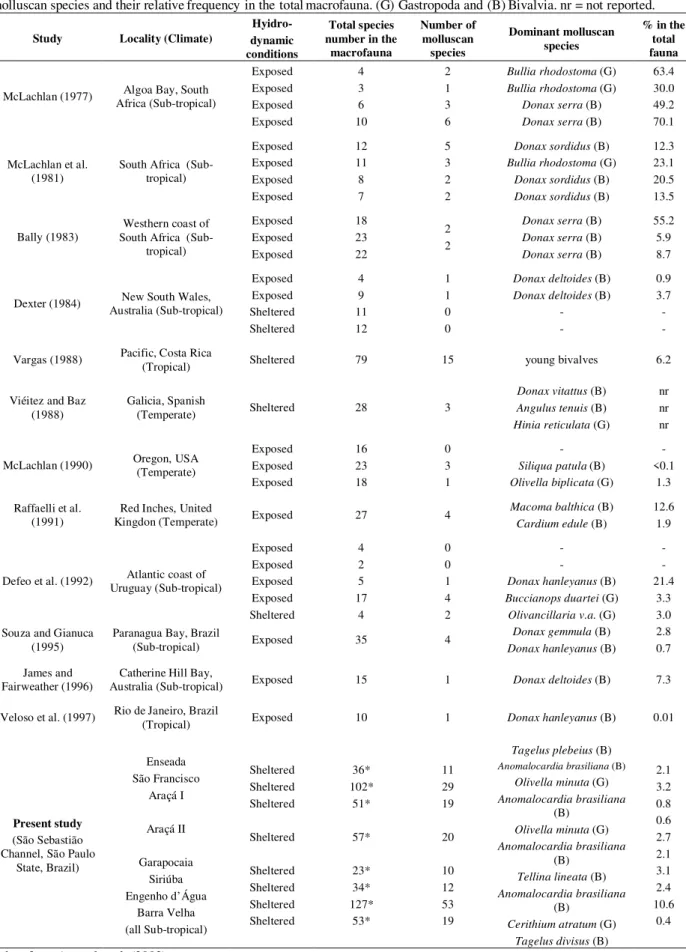
Table 3 - Comparison between the present study and previous researches on oceanic sandy beaches (from tropical, sub-tropical and temperate climates) with different hydrodynamic conditions, focusing the richness of molluscs and total fauna, the dominant molluscan species and their relative frequency in the total macrofauna. (G) Gastropoda and (B) Bivalvia. nr = not reported.
Study Locality (Climate)
Hyidro-dynamic conditions
Total species number in the
macrofauna Number of molluscan species Dominant molluscan species
% in the total fauna
McLachlan (1977) Africa (Sub-tropical)Algoa Bay, South
Exposed Exposed Exposed Exposed 4 3 6 10 2 1 3 6
Bullia rhodostoma (G) Bullia rhodostoma (G)
Donax serra (B) Donax serra (B)
63.4 30.0 49.2 70.1
McLachlan et al. (1981)
South Africa (Sub-tropical) Exposed Exposed Exposed Exposed 12 11 8 7 5 3 2 2
Donax sordidus (B) Bullia rhodostoma (G)
Donax sordidus (B) Donax sordidus (B)
12.3 23.1 20.5 13.5
Bally (1983)
Westhern coast of South Africa
(Sub-tropical) Exposed Exposed Exposed 18 23 22 2 2
Donax serra (B) Donax serra (B) Donax serra (B)
55.2 5.9 8.7
Dexter (1984) Australia (Sub-tropical)New South Wales,
Exposed Exposed Sheltered Sheltered 4 9 11 12 1 1 0 0
Donax deltoides (B) Donax deltoides (B)
-0.9 3.7
-Vargas (1988) Pacific, Costa Rica
(Tropical) Sheltered 79 15 young bivalves 6.2
Viéitez and Baz (1988)
Galicia, Spanish
(Temperate) Sheltered 28 3
Donax vitattus (B) Angulus tenuis (B) Hinia reticulata (G)
nr nr nr
McLachlan (1990) Oregon, USA(Temperate)
Exposed Exposed Exposed 16 23 18 0 3 1 -Siliqua patula (B) Olivella biplicata (G)
-<0.1
1.3
Raffaelli et al. (1991)
Red Inches, United
Kingdon (Temperate) Exposed 27 4
Macoma balthica (B) Cardium edule (B)
12.6 1.9
Defeo et al. (1992) Uruguay (Sub-tropical)Atlantic coast of
Exposed Exposed Exposed Exposed Sheltered 4 2 5 17 4 0 0 1 4 2
-Donax hanleyanus (B) Buccianops duartei (G)
Olivancillaria v.a. (G) -21.4
3.3 3.0 Souza and Gianuca
(1995)
Paranagua Bay, Brazil
(Sub-tropical) Exposed 35 4
Donax gemmula (B) Donax hanleyanus (B)
2.8 0.7
James and Fairweather (1996)
Catherine Hill Bay,
Australia (Sub-tropical) Exposed 15 1 Donax deltoides (B) 7.3
Veloso et al. (1997) Rio de Janeiro, Brazil(Tropical) Exposed 10 1 Donax hanleyanus (B) 0.01
Present study
(São Sebastião Channel, São Paulo
State, Brazil) Enseada São Francisco Araçá I Araçá II Garapocaia Siriúba Engenho d’Água Barra Velha (all Sub-tropical) Sheltered Sheltered Sheltered Sheltered Sheltered Sheltered Sheltered Sheltered 36* 102* 51* 57* 23* 34* 127* 53* 11 29 19 20 10 12 53 19
Tagelus plebeius (B)
Anomalocardia brasiliana (B) Olivella minuta (G) Anomalocardia brasiliana
(B) Olivella minuta (G) Anomalocardia brasiliana
(B) Tellina lineata (B) Anomalocardia brasiliana
(B) Cerithium atratum (G)
Tagelus divisus (B)
2.1 3.2 0.8 0.6 2.7 2.1 3.1 2.4 10.6 0.4
The diversity recorded in the São Sebastião Channel (in molluscan and total macrofauna) was higher than in other sheltered and/or tropical/sub-tropical areas around the world (Table 3). A total of 76 species of molluscs was obtained from these sites during the study period, varying from 1 to 53 species in the different environments sampled. Probably the variety of unconsolidated intertidal environments in the São Sebastião Channel, the sub-tropical climate, the sheltered hydrodynamic condition, and the presence of highly complex/heterogeneous environments were responsible for this diverse molluscan fauna. Some of these species, such as the gastropods Fissurella rosea and Natica pusilla and the bivalves Dosinia concentrica, Laevicardium brasilianum, and Pteria hirundo, were recorded for the first time in the channel.
Despite this high richness of molluscs, the molluscan assemblage of the São Sebastião Channel was composed of a few abundant (but not dominant) and many accidental species (sensu Dajoz, 1977), in contrast to the high dominance of some species (gastropods or bivalves) found in oceanic exposed beaches (see Table 3).
The most abundant species in the channel were those that were locally abundant (B. striata, S. proficua and C. orbiculata) or that occurred in five or more sectors in relatively high densities (C. atratum, O. minuta,A. brasiliana, Tagelus divisus, T. plebeius and T. lineata). Gastropods were well represented in this area (32% of the species) compared to other studies in sandy beaches (McLachlan et al., 1981; Dexter, 1983; Bally, 1983; Rafaelli et al., 1991; Defeo et al., 1992; Souza and Gianuca, 1995). Most (75%) of the gastropods occurred exclusively in the substrates with sand and rock fragments, which supported both soft and hard bottom species.
Higher species richness and density were observed in areas where habitat complexity was enhanced by the presence of physical and biogenic structures mixed with the sand, such as São Francisco and Engenho d´Água (rock fragments) and Araçá (gravel). McQuaid and Dower (1990) also observed higher number of species in such mixed environments than in typical sandy beaches or rocky shores.
The study sectors were classified in four groups (T1 to T4, see results section) based on physical characteristics and assemblage descriptors. Amaral
et al. (2003) recognized six intertidal environmental types in São Sebastião Channel (T1 = fine sand and gravel; T2 = sandy-muddy; T3 = sand flat - very fine sand; T4 = fine and very fine sand; T5 = medium and coarse sand; and T6 = sand and rock fragments), using the total macrofauna, instead only the molluscs. This difference in the clustering patterns was caused by the high dominance of some polychaete species, which presents different distribution patterns than molluscs.
Among the four environmental types found here, Engenho d’Água (T1) was the richest sector in the channel where no dominant species were evident. It presented a wide low-tide terrace covered with rocky fragments and was subjected to a low influence of organic pollution (Denadai et al. 2000). Organic pollution influenced assemblage composition in such heterogeneous low slopping habitats (Denadai et al., 2000). In fact, the lower richness in São Francisco (28 sp.; sand with rock fragments) and in Araçá II (20 sp., well sorted fine sand with gravel), when compared with Engenho d’Água, could be due to their chronic organic pollution (CETESB, 1999). Despite the absence of typical bioindicator molluscan species, Amaral et al. (2003) found the dominance of opportunistic species of polychaete, oligochaete and tanaid crustaceans in these two sectors (T2), which indicated the presence of organic enrichment (Amaral et al., 1998; Nucci et al., 2001). The bivalve A. brasiliana was one of the most abundant molluscan species in São Francisco and Araçá II. This species is eurytopic and is able to occupy organically enriched areas (Schaeffer-Novelli, 1980).
The group T4 was also composed by sectors with low-tide terraces, but showed high variation in their mean sediment grain sizes. The lower richness in relation to T1 and T2 could be an indirect evidence of the effect of environmental heterogeneity in species richness in the former two groups. Sectors with low contents of organic matter and absence of low-tide terraces were grouped in T3, which presented the lowest values of richness.
Brazilian Archives of Biology and Technology correlated with beach slope and sand grain size,
that is, dissipative beaches tend to afford richer and more abundant faunas than reflective beaches (Brown and McLachlan, 1990). A different scenario emerged in the sheltered tide dominated areas studied here. Abiotic factors and assemblage descriptors were not so clearly related due to the high environmental heterogeneity among sectors. In addition, higher richness and densities were significantly associated with sites with lower slopes (low-tide terraces) and coarser sand grains. The confounding effect of the association of coarse sand with rock fragments in some sectors did not invalidate these results, because analyses omitting such sectors showed the same results for grain diameter and slope. This positive effect of sand grain diameter on fauna contradicted the findings for exposed sandy beaches, where the synergistic effect of wave action, grain size, and beach slope made such environments extremely unstable. In sheltered and very sheltered areas (McLachlan, 1980) such as those in the São Sebastião Channel, grain size and beach slope were more dependent on the current circulation pattern, tides, and geological history than on wave action (Souza, 1997). Thus, the structural stability in sheltered environments enables the evaluation of the influence of the sediment on richness and density of macrofauna without the by-side effect of wave action.
ACKNOWLEDGEMENTS
This study was supported by grants from the Conselho Nacional de Desenvolvimento Científico e Tecnológico (CNPq), Fundação de Amparo à Pesquisa do Estado de São Paulo (FAPESP) and Fundo de Apoio à Pesquisa (FAEP - UNICAMP). We wish to express our thanks to CEBIMar - USP for logistical support. We also thank to Élcio Soares Marinho, Antonio Máximo Rosa (UNICAMP), and the technicians of the Centro de Biologia Marinha (CEBIMar - USP), who helped in the fieldwork. Dr. Janet W. Reid revised the English text. We are grateful to Dr. Anton McLachlan and Dr. Célia R. G. Souza for their criticism and comments.
RESUMO
A malacofauna de 13 ambientes oceânicos, protegidos, entremarés e não-consolidados e sua relação com os fatores abióticos foram estudados com o intuito de conhecer a riqueza de espécies e compreender o papel dos fatores abióticos na estruturação das associações. Quatro tipos distintos de ambiente entremarés foram reconhecidos com base nos descritores da comunidade (diversidade, riqueza e densidade) e nas características abióticas. O tamanho médio do grão de areia (em phy) e a inclinação da praia mostraram uma relação negativa com a diversidade, riqueza e densidade. Sedimentos grossos foram favoráveis à fauna de moluscos nas áreas estudadas, contrastando o bem conhecido efeito negativo deste tipo de areia sobre a fauna em praias oceânicas típicas. Os terraços de maré baixa, típicos de áreas dominadas pela maré, e a presença de estruturas biogênicas, tais como fragmentos rochosos e cascalho, estiveram também associados aos altos valores de riqueza. O grande número de espécies registrado na área estudada como um todo parece ser uma conseqüência direta desta heterogeneidade ambiental, uma vez que esta é composta por tipos de ambientes altamente distintos.
REFERENCES
Amaral, A. C. Z.; Denadai, M. R.; Turra, A. and Rizzo, A. E. (2003), Intertidal macrofauna in Brazilian subtropical sandy beach landscapes. J. Coast. Res.35,
446-455.
Amaral, A. C. Z.; Morgado, E. H.; Lopes, P. P.; Belúcio, L. F.; Leite, F. P. P. and Ferreira, C. P. (1990), Composition and distribution of the intertidal macrofauna of sandy beaches on São Paulo coast.
Publ.ACIESP, 3, 258-279.
Amaral, A. C. Z.; Morgado, E. H. and Salvador, L. B. (1998), Poliquetas bioindicadores de poluição orgânica em praias paulistas. Rev. Bras. Biol., 58,
307-316.
Amoreux, L. (1966), Étude bionomique et écologique de quelques annélides polyquetes des sables interidaux de côtes ouest de la France. Arch. Zool. Experim. Gen., 107, 1-128.
Borzone, C. A.; Souza, J. R. B. and Soares, A. G. (1996), Morphodynamic influence on the structure of inter and subtidal macrofaunal communities of subtropical sandy beaches. Rev. Chil. Hist. Nat., 69,
565-577.
Brown, A. C. and McLachlan, A. (1990), Ecology of sandy shores. Amsterdam: Elsevier Science.
Brown, A. C.; Winberg, R. P. and Harris, S. A. (1991), Ecology of shores of mixed rock and sand in False Bay. Trans. Roy. Soc. S. Afr., 47, 563-573.
CETESB (1999), Relatório de balneabilidade das praias paulistas. São Paulo: CETESB.
Dajoz, R. (1977), Introduction to ecology. London:
Hodder and Stoughton.
Defeo, O.; Jaramillo E. and Lyonnet, A. (1992), Community structure and intertidal zonation of the macroinfauna on the Atlantic Coast of Uruguay. J. Coast. Res., 8, 830-839.
Denadai, M. R. (2001), Moluscos de praia do litoral norte do Estado de São Paulo. Ph. D. thesis,
Universidade Estadual Paulista, Rio Claro, SP, Brazil. Denadai, M. R. and Amaral, A. C. Z. (1999), A comparative study of intertidal molluscan communities in sandy beaches, São Sebastião Channel, São Paulo State, Brazil. Bull. Mar. Sci., 65, 91-103.
Denadai, M. R.; Amaral A. C. Z. and Turra, A. (2000), Annual variation of the malacofauna on two intertidal sandy substrates with rocky fragments in southeastern Brazil. Braz. J. Oceanogr., 48, 141-150.
Denadai, M. R.; Amaral A. C. Z. and Turra, A. (2001), Spatial distribution of molluscs on sandy intertidal substrates with rocky fragments in southeastern Brazil. Estuar. Coast. Shelf Sci., 53, 733-743.
Dexter, D. M. (1983), Community structure of intertidal sandy beaches in New South Wales, Australia. In: McLachlan, A. and Erasmus, T. (Eds.). Sandy beaches as Ecosystems. The Hague, Junk. pp. 461-471.
Dexter, D. M. (1984), Temporal and spatial variability in the community structure of the fauna of sandy beaches in the South-Eastern New South Wales.
Austr. J. Mar.Fresh. Res., 35, 663-672.
Furtado, V. V. and Mahiques, M. M. (1990), Distribuição dos sedimentos em regiões costeiras e plataforma continental norte do Estado de São Paulo (1). Publ. ACIESP, 1, 20-29.
James, R. J. and Fairweather, P. G. (1996). Spatial variation of intertidal macrofauna on a sandy ocean beach in Australia. Estuar. Coast. Shelf Sci., 43, 81-107.
Jaramillo, E.; McLachlan, A. and Coetzee, P. (1993), Intertidal zonation patterns of macroinfauna over a range of exposed sandy beaches in south-central Chile. Mar. Ecol. Progr. Ser., 101, 105-118.
Krebs, C. J. (1989), Ecological Methodology. Harper
Collins, New York.
McLachlan, A. (1980), The definition of sandy beaches in relation to exposure: a simple rating system. S. Afr. J. Sci., 44, 213-222.
McLachlan, A. (1983). Sandy beach ecology: a review. In Sandy beaches as Ecosystems. In: McLachlan, A.
and Erasmus, T. (Eds.). Sandy beaches as Ecosystems.
The Hague, Junk. pp. 321-380.
McLachlan, A. (1990), Dissipative beaches and macrofauna communities on exposed intertidal sands.
J. Coast.Res., 6, 57-71.
McLachlan, A. (1996), Physical factors in benthic ecology: the effects of changing sand particle size on beach fauna. Mar. Ecol. Progr. Ser., 131, 205-217.
McLachlan, A.; Wooldridge, T. and Dye, A. H. (1981), The ecology of sandy beaches in southern Africa. S. Afr. J. Zool., 16, 219-231.
McQuaid, C. D. and Dower, K. M. (1990), Enhancement of habitat heterogeneity and species richness on rocky shore inundated by sand. Oecologia, 84, 142-144.
Nucci, P. R.; Turra, A. and Morgado, E. H. (2001), Diversity and distribution of crustaceans in subtropical brazilian intertidal sandy beaches. J. Mar. Biol. Assoc. U. K., 81, 475-484.
Omena, E. P. and Amaral, A. C. Z. (1997), Distribuição espacial de polychaeta (Annelida) em diferentes ambientes entremarés de São Sebastião (SP). Oecol. Bras., 3, 183-196.
Raffaelli, D.; Karakassis, I. and Galloway, A. (1991), Zonation schemes on sandy shores: a multivariate approach. J. Exp. Mar. Biol. Ecol., 148, 241-253.
Rios, E. C. (1994). Seashells of Brazil. Rio Grande:
Fundação Universidade do Rio Grande.
Rizzo, A. E. and Amaral, A. C. Z. (2000), Temporal variation of annelids in the intertidal zone of beaches of the São Sebastião Channel, southern Brazil. J. Mar. Biol. Assoc. U. K., 80, 1007-1017.
Schaeffer-Novelli, Y. (1980), Análise populacional de
Anomalocardia brasiliana (Gmelin, 1791) na Praia
do Saco da Ribeira, Ubatuba, Estado de São Paulo.
Bolm. Inst. oceanogr., 29, 351-355.
Short, A. D. (1996), The role of wave height, period, slope, tide range and embaymentisation in beach classifications: a review. Rev. Chil.Hist. Nat., 69,
589-604.
Souza, C. R. G. (1997), As células de deriva litorânea e a erosão nas praias do Estado de São Paulo. Ph. D.
Thesis, Universidade de São Paulo, São Paulo, Brazil Souza, J. R. B. and Gianuca, N. M. (1995), Zonation
and seasonal variation of the intertidal macrofauna on a sandy beach of Paraná State, Brazil. Sci. Mar., 59,
103-111.
Suguio, K. (1973), Introdução a Sedimentologia. São
Paulo: EDUSP.
Brazilian Archives of Biology and Technology Veloso, V. G.; Cardoso, R. S. and Fonseca, D. B.
(1997), Spatio-temporal characterization of intertidal macrofauna at Prainha Beach (Rio de Janeiro State).
Oecol. Bras., 3, 213-225.
Viéitez, J. M. and Baz, A. (1988), Comunidades bentonicas del substrato blando intermareal de la playa de Lapamán (Ria de Pontevedra, Galicia). Cah. Biol. Mar., 29, 261-276.
Woodin, S. A. (1981), Disturbance and community structure in a shallow water sand flat. Ecology, 62,
1052-1066.