Analysis of five streptokinase
formulations using the euglobulin
lysis test and the plasminogen
activation assay
Departamento de Farmacologia, Faculdade de Ciências Médicas, Universidade Estadual de Campinas, Campinas, SP, Brasil L.T. Couto,
J.L. Donato and G. de Nucci
Abstract
Streptokinase, a 47-kDa protein isolated and secreted by most group A, C and G ß-hemolytic streptococci, interacts with and activates human protein plasminogen to form an active complex capable of converting other plasminogen molecules to plasmin. Our objective was to compare five streptokinase formulations commercially avail-able in Brazil in terms of their activity in the in vitro tests of euglobulin clot formation and of the hydrolysis of the plasmin-specific substrate S-2251™. Euglobulin lysis time was determined using a 96-well microtiter plate. Initially, human thrombin (10 IU/ml) and streptoki-nase were placed in individual wells, clot formation was initiated by the addition of plasma euglobulin, and turbidity was measured at 340 nm every 30 s. In the second assay, plasminogen activation was measured using the plasmin-specific substrate S-2251™. Streptase™ was used as the reference formulation because it presented the stron-gest fibrinolytic activity in the euglobulin lysis test. The Unitinase™ and Solustrep™ formulations were the weakest, showing about 50% activity compared to the reference formulation. All streptokinases tested activated plasminogen but significant differences were ob-served. In terms of total S-2251™ activity per vial, Streptase™ (75.7 ± 5.0 units) and Streptonase™ (94.7 ± 4.6 units) had the highest activity, while Unitinase™ (31.0 ± 2.4 units) and Strek™ (32.9 ± 3.3 units) had the weakest activity. Solustrep™ (53.3 ± 2.7 units) pre-sented intermediate activity. The variations among the different for-mulations for both euglobulin lysis test and chromogenic substrate hydrolysis correlated with the SDS-PAGE densitometric results for the amount of 47-kDa protein. These data show that the commercially available clinical streptokinase formulations vary significantly in their
in vitro activity. Whether these differences have clinical implications needs to be investigated.
Correspondence G. de Nucci
Departamento de Farmacologia Faculdade de Ciências Médicas UNICAMP
13084-970 Campinas, SP Brasil
Fax: +55-19-3242-7439 E-mail: [email protected]
Presented, as a poster, at the XXXV Congresso Brasileiro de Farmacologia e Terapêutica Experimental, Águas de Lindóia, SP, Brazil, September 21-24, 2003.
Publication supported by FAPESP.
Received November 28, 2003 Accepted August 31, 2004
Key words
•Streptokinase •Plasminogen •Plasmin
Introduction
In 1933, Tillet and Garner (1) first de-scribed the exogenous plasminogen activa-tor isolated and secreted by most group A, C and G ß-hemolytic streptococci. This activa-tor was named “streptokinase” by Chris-tensen and MacLeod (2). Streptokinase, a 47-kDa protein, interacts with the protein plasminogen to form a streptokinase-plas-minogen complex capable of converting other plasminogen molecules to plasmin. Strep-tokinase does not require fibrin for efficient plasminogen activation in blood (3). It is a catalytically inert bacterial protein that has no structural homologues (4,5). Streptoki-nase can form an activator complex with plasmin, which contains a functional active site, or with plasminogen (lys-plasminogen) in which it induces non-proteolytically the formation of a functional active site (5,6).
The success of the complex formed by streptokinase as a therapeutic agent has been attributed to its unique mechanism of fibrin-dependent plasminogen activation. When administered to humans, the streptokinase activator complex rapidly generates plasmin in the circulating blood at sites distant from fibrin clots. This mechanism depletes the plasminogen substrate and exhausts the clot-dissolving (or fibrinolytic) potential of plas-minogen (7-9).
Streptokinase is now a leading agent for the treatment of acute myocardial infarction. Approximately 400,000-500,000 patients
receive thrombolytic therapy per year world-wide. Many investigators (10-15), based on several randomized multicenter clinical tri-als, recommend 1,500,000 IU as the appro-priate dose for the treatment of an acute myocardial infarction. From a clinical per-spective, the possible effect of significant deviations from the recommended dose is unknown. Note that the assays reported here were not the same as used for the recommen-dation of 1,500,000 IU.
Five streptokinase preparations commer-cialized in Brazil for clinical use by different manufacturers were analyzed to determine their activity, content and homogeneity. Streptase™ was used as a reference mate-rial. The activity of the samples was deter-mined on the basis of euglobulin lysis time and of a chromogenic assay using S-2251™. The homogeneity of the protein content of the samples was determined by SDS-PAGE. The study revealed significant differences among commercially available preparations in Brazil in terms of total streptokinase activ-ity per vial.
Material and Methods
Streptokinase
Five streptokinase preparations from dif-ferent manufacturers, containing 1,500,000 IU per vial as a powder, were tested (Table 1). Five milliliters of cold Milli-Q water was added to each flask to dissolve the solid. Samples nominally containing 300,000 IU/ ml were frozen at -70ºC until use. During analysis all solutions were immersed in ice.
Preparation of human plasma and euglobulin fraction
Blood was obtained by venipuncture from the antecubital vein of 2 healthy volunteers at rest, with minimum stasis. Samples were collected into a 0.1 volume of 3.8% sodium citrate and plasma was prepared by
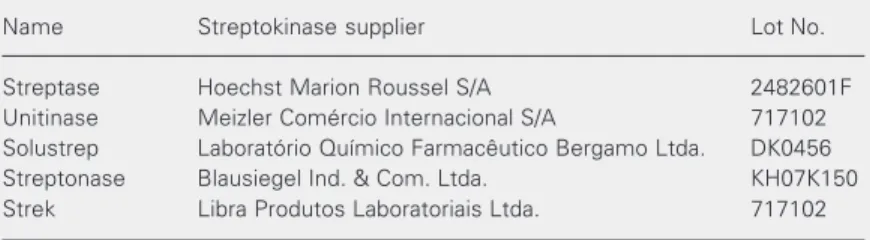
centrifu-Table 1. Streptokinase formulations for clinical use evaluated in the present study.
Name Streptokinase supplier Lot No.
Streptase Hoechst Marion Roussel S/A 2482601F
Unitinase Meizler Comércio Internacional S/A 717102
Solustrep Laboratório Químico Farmacêutico Bergamo Ltda. DK0456
Streptonase Blausiegel Ind. & Com. Ltda. KH07K150
Strek Libra Produtos Laboratoriais Ltda. 717102
gation (2,000 g) for 15 min at 4oC. Plasma samples were pooled and kept at -70oC until use.
The plasma euglobulin fraction was pre-pared by 10-fold dilution of citrated plasma and acidification at pH 5.0 by the addition of 1% acetic acid. After standing for 1 h at 4oC the diluted plasma was centrifuged (2,000 g) for 15 min at 4oC. The precipitate was dis-solved in 0.1 M Tris-HCl buffer, pH 7.4.
Euglobulin clot lysis assay
We used a 96-well microtiter plate assay to determine the euglobulin lysis time (16-18). Control samples were prepared by add-ing 20 µl human thrombin (10 IU/ml) and 30 µl 0.1 M Tris-HCl buffer, pH 7.4, to indi-vidual wells. Test samples were prepared by adding 10 µl thrombin, 10 µl buffer and 20 µl streptokinase solution. Clot formation was initiated by the addition of 150 µl of the plasma euglobulin fraction. The turbidity in the wells was measured as absorbance at 340 nm every 30 s for 20 min using a SPECTRAmax Microplate Spectrophotom-eter and the software SOFTmax PRO (Mo-lecular Devices Corporation, Sunnyvale, CA, USA). Each streptokinase dilution was as-sayed in triplicate. To evaluate the effect of the different streptokinases on euglobulin lysis time, we used the software GraphPad Prisma 3.0 to plot the log of streptokinase IU against log of the area under the curve. Lin-ear regression was applied and the efficiency of each streptokinase formulation was com-pared to the reference Streptase™.
To evaluate the streptokinase activity af-ter storing the stock solution, the fibrinolytic activity was also evaluated after 24 h at 4oC.
Chromogenic assay
Plasminogen activation by streptokinase was assayed using the synthetic substrate S-2251™ (Chromogenix-Instrumentation Lab-oratory, Milan, Italy). S-2251™ is a
chromo-genic substrate for both plasmin and strep-tokinase-activated plasminogen. The method for the determination of activity is based on the difference in absorbance between the pNA formed and the original substrate. The rate of pNA formation is measured at 405 nm and this photometric signal is directly proportional to the plasmin activity, which reflects the amount of functional plasmino-gen originally present in the sample.
The reaction was performed using 96-well plates. Control samples were prepared by adding 20 µl 0.1 M Tris-HCl buffer, pH 7.4, 30 µl substrate S-2251 (0.6 mM) and 100 µl plasminogen solution (0.1 CU/ml). In the test samples the reaction was performed after addition of 20 µl streptokinase solution tested at different concentrations (150 to 600 IU/ml), 30 µl S-2251 and 100 µl plasmino-gen solution. The plate was immediately placed in the plate reader previously heated at 37ºC. The absorbance of the wells was measured at 405 nm every 30 s for 30 min. Plates were shaken for 3 s before reading the absorbance using a SPECTRAmax Micro-plate Spectrophotometer and the software SOFTmax PRO. Each streptokinase dilution was assayed a minimum of three times.
One unit was defined as the amount of enzyme activity that converts 1 µmol of sub-strate per minute per liter. Since the enzy-matic activity is normally calculated using a cuvette with 1 cm of optical path, we adapt-ed the formula to the 96-well plate taking into account a total reaction volume of 150 µl and an optical path of 0.4 cm. Under these conditions, the extinction coefficient of pNA is 3840 mol l-1 cm-1.
Polyacrylamide gel electrophoresis
for 4 min to complete the reaction with the SDS and ß-mercaptoethanol and 20 µl of each sample was loaded onto the stacking gel. PAGE was performed using a discon-tinuous system (19). Samples were initially loaded and stacked in 4% polyacrylamide gel (stacking gel). Proteins were resolved in 10% polyacrylamide gel (resolving gel). SDS was used in combination with ß-mercapto-ethanol to reduce disulfide bonds, denature the proteins and make the proteins nega-tively charged. Electrophoresis was con-ducted at 20 mA per gel (100-200 V) until the bromophenol blue marker reached the bottom of the gel. Proteins were stained with Coomassie brilliant blue solution (0.025%
Coomassie blue in 10% acetic acid) for at least 1 h, then destained with 10% acetic acid for 2 h. Mobility was plotted against the molecular weight of standard proteins (SigmaMarker Wide Range, Sigma, St. Louis, MO, USA) using a semi-log scale and the molecular weight of the proteins was esti-mated by interpolation.
Densitometric analysis of the protein bands was performed using the software Scion Image for Windows (Scion Corpora-tion, Frederick, MD, USA).
Protein quantification
Total protein concentration was deter-mined with the QuantiPro™ BCA assay kit (Sigma) using bovine serum albumin as stan-dard (20).
Results and Discussion
Euglobulin clot lysis
Clot formation was observed immedi-ately after starting the reaction and turbidity increased until clot lysis was initiated by activated plasmin. The resulting graph was a hyperbole and the area under the curve in-creased with decreasing streptokinase con-centration. Since the lines obtained were not perfectly parallel, we performed the com-parison using 100 points covering the total line length. The relative streptokinase activ-ity is represented as the mean ± SD of these 100 points.
Streptase™ showed the strongest fibrino-lytic activity in the euglobulin lysis test. Unitinase™ and Solustrep™ were the weak-est proteins, showing about 50% of the activity of the Streptase™ formulation (Table 2). The data show a more than 50% difference in activity between the most active (Streptase™) and least active (Unitinase™) streptokinase preparations as measured by euglobulin clot lysis. Streptokinase activity decreased dra-matically after 24 h at 4oC (Table 2).
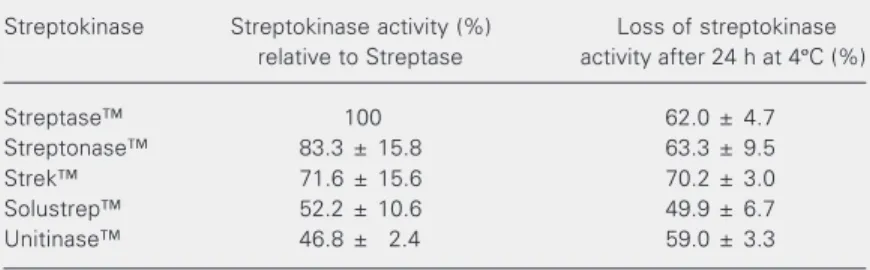
Table 2. Comparison of streptokinase activity measured by euglobulin lysis in five clinical formulations.
Streptokinase Streptokinase activity (%) Loss of streptokinase
relative to Streptase activity after 24 h at 4ºC (%)
Streptase™ 100 62.0 ± 4.7
Streptonase™ 83.3 ± 15.8 63.3 ± 9.5
Strek™ 71.6 ± 15.6 70.2 ± 3.0
Solustrep™ 52.2 ± 10.6 49.9 ± 6.7
Unitinase™ 46.8 ± 2.4 59.0 ± 3.3
Activity was measured by the euglobulin lysis test and is reported as percent of the activity present in the Streptase™ formulation. Data are reported as the mean ± SEM for three independent experiments performed in duplicate. The data for the stability study at 4oC for 24 h represent the total loss (%) of the fibrinolytic activity compared to the values reported in the first column.
Table 3. Comparison of streptokinase activity measured by the hydrolysis of the chromogenic peptide S-2251™.
Streptokinase Total units Ratio to the reference Streptase N
Streptonase™ 94.7 ± 4.6 1.25 16
Streptase™ 75.7 ± 5.0 1.00 14
Solustrep™ 53.3 ± 2.7 0.70 15
Strek™ 32.9 ± 3.3 0.43 14
Unitinase™ 31.0 ± 2.4 0.41 12
Hydrolysis of S-2251™
All streptokinase preparations tested hy-drolyzed the plasminogen-like synthetic pep-tide substrate. However, the activity varied amongst the streptokinase formulations, as indicated in Table 3. Streptonase™ (94.7 ± 4.6 units/vial) and Streptase™ (75.7 ± 5.0 units/vial) were the most active formulations, while Strek™ and Unitinase™ were the weakest (32.9 ± 3.3 and 31.0 ± 2.4 units/vial, respectively). Solustrep™ (53.3 ± 2.7 units/ vial) presented intermediate activity (Table 3).
SDS-PAGE
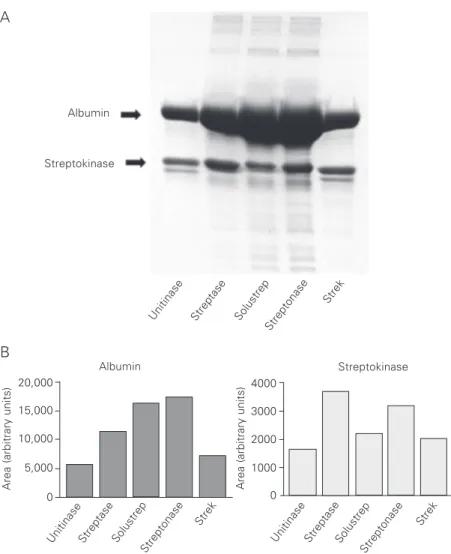
Electrophoretic analysis showed two major bands. The upper band corresponded to human albumin (~67 kDa) and was the most prominent protein (Figure 1A). The lower band was identified as the streptoki-nase protein on the basis of its apparent molecular mass of 47 kDa (data not shown), Streptase™, Solustrep™ and Streptonase™ showed contaminating proteins of a wide molecular mass range below 67 kDa. The bands corresponding to Unitinase™ and Strek™ were resolved into two components. Densitometric analysis of protein bands confirmed a significant variation in the amount of both streptokinase and human albumin protein in each formulation (Figure 1B). The total amount of albumin is only indicated on the label of the following formulations: Unitinase™ (195 mg), Solustrep™ (200 mg) and Streptonase™ (200 mg). After protein quantitation by three in-dependent determinations the variability ob-served for total protein amount obob-served in each flask agreed with the densitometric re-sults: Unitinase™ (87.5 ± 8.5 mg), Streptase™ (207.1 ± 9.8 mg), Solustrep™ (374.0 ± 32.1 mg), Streptonase™ (433.3 ± 47.2 mg), and Strek™ (107.8 ± 5.1 mg).
The amount of protein corresponding to streptokinase is not indicated on the product labels. The variations among the different
formulations for both euglobulin lysis test and chromogenic substrate hydrolysis pre-sented a close correlation with the densito-metric data for the streptokinase main band (Figure 1B).
The euglobulin lysis test and the chromo-genic substrate assay presented similar re-sults in ranking the streptokinase activity of five commercial clinical preparations. This suggests that either assay can be used to determine streptokinase activity. The chro-mogenic substrate assay has the advantage of being fast and highly reproducible. In the
Figure 1. SDS-PAGE analysis of the protein content of five streptokinase formulations. A, PAGE was performed using a 10% polyacrylamide gel in a discontinuous system at 20 mA per gel (100-200 V). Proteins were stained with Coomassie brilliant blue. This result is representative of four independent experiments. B, Densitometric analysis of the albumin and streptokinase bands. The areas of the bands are reported in arbitrary units. Note that the scale for albumin is five times that of streptokinase.
Albumin
Streptokinase
Albumin Streptokinase
Unitinase Streptase Solustrep
Strek
Area (arbitrary units)
20,000
15,000
10,000
5,000
0 Area (arbitrary units)
4000
3000
2000
1000
0 A
B
Unitinase Streptase Solustrep
Strek
Unitinase StreptaseSolustrep Streptonase
Strek
Streptonase
euglobulin test, the preparation of the eu-globulin fraction is laborious and this mate-rial has also the disadvantage of being un-stable.
The present study revealed significant differences among the commercially avail-able streptokinase preparations. Only Streptonase™ presented similar fibrinolytic activity when compared to Streptase™. All
other streptokinases presented significantly less fibrinolytic activity. There are also sig-nificant densitometric differences regarding protein content associated with the SDS-PAGE band.
Whether these differences have clinical consequences deserve further evaluation by both medical professionals and regulatory authorities.
References
1. Tillet WS & Garner RL (1933). The fibrinolytic activity of hemolytic streptococci. Journal of Experimental Medicine, 58: 485-502. 2. Christensen LR & MacLeod CM (1945). A proteolytic enzyme of
serum: characterization, activation and reaction with inhibitors. Jour-nal of General Physiology, 28: 559-583.
3. Marder VJ & Sherry S (1988). Thrombolytic therapy: current status (1). New England Journal of Medicine, 318: 1512-1520.
4. Reddy KN & Markus G (1972). Mechanism of activation of human plasminogen by streptokinase. Presence of active center in strep-tokinase-plasminogen complex. Journal of Biological Chemistry, 247: 1683-1691.
5. Reddy KN (1988). Streptokinase - biochemistry and clinical applica-tion. Enzyme, 40: 79-89.
6. Urano S, Metzger AR & Castellino FJ (1989). Plasmin-mediated fibrinolysis by variant recombinant tissue plasminogen activators.
Proceedings of the National Academy of Sciences, USA, 86: 2568-2571.
7. Torr SR, Nachowiak DA, Fujii S & Sobel BE (1992). “Plasminogen steal” and clot lysis. Journal of the American College of Cardiology, 19: 1085-1090.
8. Reed GL, Houng AK, Liu L, Parhami-Seren B, Matsueda LH, Wang S & Hedstrom L (1999). A catalytic switch and the conversion of streptokinase to a fibrin-targeted plasminogen activator. Proceed-ings of the National Academy of Sciences, USA, 96: 8879-8883. 9. Collen D & Lijnen HR (1995). Molecular basis of fibrinolysis, as
relevant for thrombolytic therapy. Thrombosis and Haemostasis, 74: 167-171.
10. Wardlaw JM, Zoppo G, Yamaguchi T & Berge E (2003). Thromboly-sis for acute ischaemic stroke. Cochrane Database Systematic Review: CD000213.
11. Jerjes-Sanchez C, Ramirez-Rivera A, Arriaga-Nava R et al. (2001).
High dose and short-term streptokinase infusion in patients with pulmonary embolism: prospective with seven-year follow-up trial.
Journal of Thrombosis and Thrombolysis, 12: 237-247.
12. Clase CM, Crowther MA, Ingram AJ & Cina CS (2001). Thromboly-sis for restoration of patency to haemodialyThromboly-sis central venous cath-eters: a systematic review. Journal of Thrombosis and Thromboly-sis, 11: 127-136.
13. Forster A & Wells P (2001). Tissue plasminogen activator for the treatment of deep venous thrombosis of the lower extremity: a systematic review. Chest, 119: 572-579.
14. Wells PS & Forster AJ (2001). Thrombolysis in deep vein thrombo-sis: is there still an indication? Thrombosis and Haemostasis, 86: 499-508.
15. Cannon CP (2000). Exploring the issues of appropriate dosing in the treatment of acute myocardial infarction: potential benefits of bolus fibrinolytic agents. American Heart Journal, 140: S154-S160. 16. Carlson RH, Garnick RL, Jones AJ & Meunier AM (1988). The
determination of recombinant human tissue-type plasminogen acti-vator activity by turbidimetry using a microcentrifugal analyzer.
Analytical Biochemistry, 168: 428-435.
17. Beebe DP, Gaffney PJ & van Schie DM (1992). Potency assays for Anistreplase: comparison of the fibrin plate assay and a 96-well plate assay. Biologicals, 20: 129-133.
18. Marsh NA (1978). Measurement of fibrinolytic capacity by the eu-globulin lysis time method - a problem of “units”. Thrombosis Research, 12: 197-200.
19. Laemmli UK (1970). Cleavage of structural proteins during the as-sembly of the head of bacteriophage T4. Nature, 227: 680-685. 20. Brown RE (1989). Protein measurement using bicinchoninic acid: