ABSTRACT: Longevity is a desirable trait in the dairy industry because of its relationship to profit-ability. The aim of this study was to estimate genetic parameters for longevity measurements related to productive life, or life in the herd, and linear type traits of Brazilian Holstein cows born between the years 1990 and 2008. The (co) variance components were estimated by the restricted maximum likelihood method. The heritability for measurements of longevity and linear type traits ranged from 0.05 to 0.07 and 0.08 to 0.39, respectively. The genetic correlations between measurements of longevity and linear type traits ranged from -0.39 to 0.31. Direct se-lection for longevity does not necessarily lead to long-lived cows, due to low heritability. Indirect genetic selection for udder depth, bone quality, udder height, rear teat placement and conforma-tion traits showed the highest genetic correlaconforma-tions with measurements of time between birth and last milk record and time from first calving to last milk record.
Keywords: genetic correlation, mammary system, productive life, rear teat placement
Introduction
Programs for the genetic improvement of dairy cattle generally aim at improving productive traits, with emphasis on milk production, which adversely affect other traits such as reproduction, health and longevity (Pérez Cabal et al., 2006). Longevity is a desirable trait in the dairy industry because of its relationship to profit-ability. The reduction of problems related to health and reproduction results in cows that remain in the herd for a longer time, increases the proportion of cows avail-able for culling based on average milk production and reduces replacement costs (Sewalem et al., 2008).
Breeders in many countries have recognized the economic importance of longevity, have calculated ge-netic parameters of longevity and have included them in dairy cattle breeding programs (Forabosco et al., 2009). However, direct selection for longevity is limited by the time needed to obtain the records, usually after the death of the cow (Lagrotta et al., 2010) and low heritabil-ity, ranging from 0.03 to 0.13 (Vollema and Groen, 1997; Daliri et al., 2008).
Some researchers have evaluated the use of lin-ear type traits as alternative indirect selection measure-ments of longevity due to favorable genetic correlations (Cruickshank et al., 2002; Zavadilová et al., 2009). More-over, type traits are usually obtained early on during the productive life; are easy to measure and have higher heritability than longevity, commonly ranging from 0.08 to 0.49 (Daliri et al., 2008; Campos et al., 2012).
Genetic parameters are used to direct selection procedures, for prediction of genetic values and for the development of selection indices in genetic improve-ment programs. Considering the importance of longevity for dairy farming, the objective of this study was to
esti-mate (co) variance components and genetic parameters for measuring longevity and linear type traits of Holstein cows, and to make recommendations for the inclusion of longevity in the Brazilian genetic evaluation system.
Materials and Methods
Data for this study consisted of type traits and longevity measurements taken from cows born between 1990 and 2008 and classified between 1995 and 2010 by technicians from the Brazilian Association of Holstein cattle Breeders (ABCBRH). These cows belonged to 375 herds distributed in the southeastern and southern re-gions of Brazil.
The linear classification system used by the AB-CBRH includes 21 type traits based on direct measure-ments or visual scores of morphology expressed on a scale of one to nine points. These traits were divided into seven sections as in the Canadian model as follows: 1. Conformation (ST - stature; TL - top line; WE - weight; CW - chest width; BD - body depth; LS - loin strength), 2. Rump (RA - rump angle; RW - rump width), 3. Feet and Legs (FA - foot angle; BQ - bone quality; SV – side view of rear legs), 4. Anterior udder (FU - fore udder at-tachment; FT - fore teat placement; UTL - teat length), 5. Posterior udder (RH - rear udder height; RUW - rear udder width; RT - rear teat placement), 6. Mammary system (UD – udder depth; UT - udder texture; UC - ud-der cleft) and 7. Dairy form (AN - angularity), as well as Final Score (FS) where Dairy Form accounted for 12 %, Conformation (18 %), Feet and Legs (20 %) and Mam-mary System (8 %), Rump (10 %), Front Udder (14 %) and Rear Udder (18 %).
Five longevity measures were evaluated: (i) total milk production over all lactations (Long1); (ii) number 1Federal University of Rio Grande do Sul/Faculty of
Agronomy – Dept. of Animal Science – Av. Bento Gonçalves, 7712 – 91540-000 – Porto Alegre, RS – Brazil.
2Embrapa Dairy Cattle, Eugênio do Nascimento, 610 - Dom Bosco – 36038-330 – Juiz de Fora, MG – Brazil.
3University of Brasilia, Campus Darcy Ribeiro s/n, Asa Norte – 70910-900 – Brasília, DF – Brazil.
4National Institute of Science and Technology-Information-Genetic Sanitary of Brazilian Livestock, Antonio Carlos, 6627 – 31270-901 – Belo Horizonte, MG – Brazil.
*Corresponding author <[email protected]>
Edited by: Gerson Barreto Mourão
Genetic association between longevity and linear type traits of Holstein cows
Elisandra Lurdes Kern1, Jaime Araujo Cobuci1*, Cláudio Napolis Costa2, Concepta Margaret McManus3,4, José Braccini Neto1
Received January 13, 2014
of lactations initiated (Long2); (iii) total number of days in lactation over all lactations (Long3); (iv) time between birth and last milk recording (Long4) in months; and (v) time from first calving to last milk recording (Long5) also in months.
To improve the database consistency for linear type traits, cows classified for type in the fourth or sub-sequent lactations and those cows with age at calving below 20 and above 87 months were excluded from the dataset. To reduce the influence of environmental fac-tors on the analysis, ten lactation classes at classification (first to tenth month of lactation) and four classification periods were formulated: summer (January to March); fall (April to June); winter (July to September) and spring (October-December). Contemporary groups for type traits were formulated based on herd, year, and classi-fication period, each one containing at least three cows. Additionally, each cow sire had at least two daughters in at least two herds.
As regards the consistency of longevity measure-ments, cows that might still be alive at the time of the analyses were excluded from the dataset. Two criteria were used to verify if the cows were still alive in the herd. The first was the presence of the last date of milk record-ing and the second consisted of the difference between the date of the cow’s last calving (up to the time of data collection for each cow) and the date of the latest calving on each farm. If this difference was less than 24 months the cow was considered to be alive. The 24 month-period was used because about 95 % of this population had a new calving during this period. This criterion was also used by Caetano et al. (2012) for Nelore cows.
Contemporary groups for longevity measuring were composed of herd, year and season of first calving, each one containing at least three cows. For the longev-ity analysis, the milk production in the first lactation and the age at first calving were divided into four classes. The classes of milk production in the first lactation were as follows: up to 6,500 kg, 6,501 to 7,750 kg, 7,751 to 9,000 and greater than 9,001 kg milk and the classes of age at first calving were up to 24 months, 25 to 26 months, 27 to 29 months and more than 29 months of age.
After the consistency of linear type traits and lon-gevity measures, the number of records for the bivari-ate analysis including these traits, ranged from 19,318 (Long4) to 25,889 (Long1) (Table 1).
The bivariate models used for estimation of (co) variance for linear type traits and longevity included the fixed effects of contemporary groups, lactation class at classification, classifier (a technician from ABCBRH who carried out the morphological evaluation for type traits), classification period and age of the cow at classi-fication date (covariate with linear and quadratic terms) for linear type traits and fixed effects of contemporary groups, classes of milk production in first lactation and classes of age at first calving for longevity measure-ments. Animal and residual random effects were com-mon to all models.
The bivariate model used in the estimation of (co) variance among linear type traits and longevity can be described as follows
where: yi is the vector of observations of the ith linear
type traits (i = 1) and longevity measures (i = 2), βi is the vector of fixed effects of the ith character, u
i is the
vector random effect of animal ith character, e
i is the
vec-tor of residual effects of the ith character, X
i and Zi are
incidence matrices relating to the observations of the ith
character in the fixed and random effects of animal. Estimates of (co)variance were performed by the restricted maximum likelihood derivative free method using MTDFREML software (Boldman et al., 1995). A convergence criterion of 10–9 was used, restarting the
analysis at each convergence, using the final values of the previous analysis as initial values in the new analy-sis of (co)variance until no further difference existed in the four decimal values of -2 log likelihood between two successive analyses.
Results and Discussion
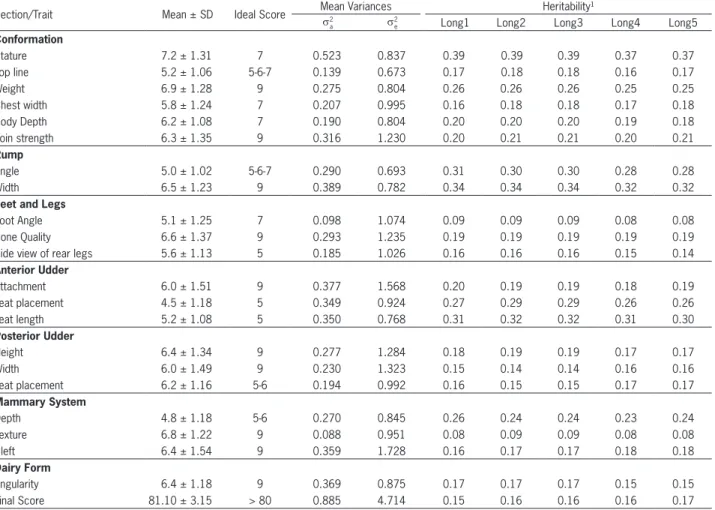
The mean scores for the 21 linear type traits ranged from 4.5 for teat placement to 7.2 for stature, showing no marked differences in relation to the ideal score recommended by ABCBRH (Table 2). The traits rump angle (5.0), udder depth (4.8) teat length (5.2) and top line (5.2) had a mean score closest to the ideal score and the traits fore udder attachment (6.0), rear ud-der width (6.0) and loin strength (6.3) presented mean scores more distant from the ideal score recommended (Table 2). The final score, which expresses the balance between the type traits of animals, was slightly above the minimum established as ideal, indicating the exis-tence of a certain harmony between linear type traits in this population.
The proximity of the values of the traits to the ide-al vide-alues is important for the continued genetic improve-ment of linear type traits in Brazilian herds, in order to obtain harmonic animals, a functional body structure
Table 1 – Number of cows, bulls, cow dams, herds and contemporary groups in the Brazilian Holstein database, according to longevity measurements.
Database Long1 Long2 Long3 Long4 Long5
Cows 25,889 24,243 20,073 19,318 24,243
Bulls 1,092 1,058 965 950 1,058
Cow dams 21,026 19,696 16,535 15,945 19,696
Herds 375 334 321 308 334
and good reproductive ability, enabling them to face the challenges of increasingly higher production levels, as these traits are genetically related to longevity (Darili et al., 2008; Makgahlela et al., 2009), leading to a higher permanence of cows in the herd with lower proportion of culling due to poor conformation, as well as health and reproduction problems.
Linear type classification is an important tool in the decision making process as it aims at the selection of animals which express their productive and reproduc-tive potential through their phenotypic characteristics which should lead to longer herd productive life (Pérez-Cabal and Alenda, 2002; Posadas et al., 2004).
Only the average estimate of these analyzes are reported because of the similarity between genetic and residual variances estimated in the multiple analyzes be-tween each type traits and the five longevity measure-ments (Table 2 and Table 3). Likewise, averages of heri-tability for longevity measures were obtained in joint analyses with each type traits (Table 3).
Table 2 – Mean, standard deviation (SD), ideal score, average estimate of additive genetic (s2
a) and residual (s 2
e) variances and heritability for linear
type traits in Brazilian Holstein cows obtained in bivariate analysis with all longevity measurements*
Section/Trait Mean ± SD Ideal Score Mean Variancess2 Heritability¹
a s
2
e Long1 Long2 Long3 Long4 Long5
Conformation
Stature 7.2 ± 1.31 7 0.523 0.837 0.39 0.39 0.39 0.37 0.37
Top line 5.2 ± 1.06 5-6-7 0.139 0.673 0.17 0.18 0.18 0.16 0.17
Weight 6.9 ± 1.28 9 0.275 0.804 0.26 0.26 0.26 0.25 0.25
Chest width 5.8 ± 1.24 7 0.207 0.995 0.16 0.18 0.18 0.17 0.18
Body Depth 6.2 ± 1.08 7 0.190 0.804 0.20 0.20 0.20 0.19 0.18
Loin strength 6.3 ± 1.35 9 0.316 1.230 0.20 0.21 0.21 0.20 0.21
Rump
Angle 5.0 ± 1.02 5-6-7 0.290 0.693 0.31 0.30 0.30 0.28 0.28
Width 6.5 ± 1.23 9 0.389 0.782 0.34 0.34 0.34 0.32 0.32
Feet and Legs
Foot Angle 5.1 ± 1.25 7 0.098 1.074 0.09 0.09 0.09 0.08 0.08
Bone Quality 6.6 ± 1.37 9 0.293 1.235 0.19 0.19 0.19 0.19 0.19
Side view of rear legs 5.6 ± 1.13 5 0.185 1.026 0.16 0.16 0.16 0.15 0.14
Anterior Udder
Attachment 6.0 ± 1.51 9 0.377 1.568 0.20 0.19 0.19 0.18 0.19
Teat placement 4.5 ± 1.18 5 0.349 0.924 0.27 0.29 0.29 0.26 0.26
Teat length 5.2 ± 1.08 5 0.350 0.768 0.31 0.32 0.32 0.31 0.30
Posterior Udder
Height 6.4 ± 1.34 9 0.277 1.284 0.18 0.19 0.19 0.17 0.17
Width 6.0 ± 1.49 9 0.230 1.323 0.15 0.14 0.14 0.16 0.16
Teat placement 6.2 ± 1.16 5-6 0.194 0.992 0.16 0.15 0.15 0.17 0.17
Mammary System
Depth 4.8 ± 1.18 5-6 0.270 0.845 0.26 0.24 0.24 0.23 0.24
Texture 6.8 ± 1.22 9 0.088 0.951 0.08 0.09 0.09 0.08 0.08
Cleft 6.4 ± 1.54 9 0.359 1.728 0.16 0.17 0.17 0.18 0.18
Dairy Form
Angularity 6.4 ± 1.18 9 0.369 0.875 0.17 0.17 0.17 0.15 0.15
Final Score 81.10 ± 3.15 > 80 0.885 4.714 0.15 0.16 0.16 0.16 0.17
*Long1= total milk production in all lactations; Long2= number of lactations initiated; Long3= total number of days during all lactations; Long4= time between birth and last milk recording, in months; and Long5= time from first calving to last milk recording, in months. ¹The standard deviations of heritability ranged from 0.00 to 0.022 for all type traits.
The highest estimates of additive genetic (0.88) and residual (4.71) variance were observed for the fi-nal score (Table 2). These high estimates for fifi-nal score are due to the original phenotypic scales which were higher for this trait than for other trait types. For the other type traits, estimates ranged from 0.08 to 0.52 and 0.67 to 1.72 for the additive genetic and residual variances, respectively. Except for foot angle and ud-der texture, the remaining linear type traits had es-timates of additive genetic variance exceeding 0.13, proportionally lower than the values of estimated re-sidual variance.
(0.32 to 0.30). Lower heritabilities were observed for foot angle (0.08 to 0.09) and udder texture (0.08 and 0.09). These results are similar to those reported by Zavadilová and Stípková (2012) in the bivariate analysis of Long5 with stature (0.41), rump width (0.35), teat length (0.27) and foot angle (0.10) and by Darili et al. (2008), for stature (0.38). Campos et al. (2012) also reported that foot angle (0.10) and udder texture (0.11) were the characteristics that showed the lowest heritability in dairy cows in Brazil.
The estimated residual, phenotypic and genetic correlations ranged from -0.04 to 0.08, -0.05 to 0.07 and -0.38 to 0.31, respectively (Table 4). Estimates of genetic correlations between linear type traits with longevity measurements were higher than the corresponding phe-notypic correlations. This result is similar to that report-ed by Cruickshank et al. (2002), with Jersey cows, who obtained higher estimates of genetic (-0.29 to 0.24) than phenotypic (-0.08 to 0.10) correlations between linear type traits and Long4.
The values near nullity for residual and pheno-typic correlations suggest that type traits and longevity are not influenced by the same factors or environmental effects and so it is practically impossible to predict the individual longevity of a cow in the herd through type phenotype. Estimates of phenotypic and genetic correla-tions reinforce the need to practice selection based pri-marily on values generated simultaneously by genetic evaluation procedures for such traits.
In general, genetic correlations between conforma-tion traits with longevity measurements were negative and moderate, except for top line with Long4 and Long5 (-0.09) (Table 4). Genetic correlations indicate that cows with values for higher stature, top line, weight, chest width, body depth and loin strength have less opportu-nity to remain productive in the herd, due to negative genetic correlations of these traits with these longevity measurements.
As regards the traits related to the rump of the animal, genetic correlations between rump angle and all measures of longevity, and between rump width and Long1, Long4 and Long5 were low, ranging from -0.10 to 0 05, and suggest that selection for longevity through these two traits would lead to small genetic gains. In contrast, slightly higher genetic correlations between rump width with Long2 and Long3 were observed, indicating that a higher response to selection for lon-gevity can be achieved by selecting daughters of bulls with narrower rump width. These results are similar to those observed by Zavadilová and Stípková (2012), who reported a genetic correlation between rump width and Long2 of -0.15, and less than that observed by Cruickshank et al. (2002) and Zavadilová and Stípková (2012), who found correlations between rump width and Long5 of -0.27 and Long4 of -0.29, in Jersey and Holstein cows, respectively. Rump traits are associated with calving ease, this being important for the dairy industry, where cows with calving problems are less profitable due to the increase in veterinary costs and The average for Long2 (2.66) (Table 3) was similar
to that observed in dairy cows in the United States of America by Tsuruta et al. (2005), with an average of 2.8 initiated lactations, slightly lower than those reported by Potočnik et al. (2011) in Slovenia and Strapák et al. (2011) in Slovakia, with averages of 3.0 and 3.4 lactations initiat-ed, respectively, for Holsteins and Simmental dairy cows. The cows remained, on average, 970 days in pro-duction (Long3) until their death or culling (Table 3). With the increase of total days in lactation, higher milk production and longer permanence of cows in the herd is expected, to be accompanied by a lower incidence of udder, reproductive and conformation problems (Cruick-shank et al., 2002).
The mean values for the measurements of longev-ity of time between birth and last milk record (Long4) and time from first calving to last milk record (Long5) were approximately 60 and 33 months, respectively (Ta-ble 3). These values were similar to those reported by Nilforooshan and Edriss (2004), who obtained values of 57.2 months for Long4 and 30.1 months for Long5.
In general, the low estimates of additive genetic variances associated with high residual variance esti-mates resulted in low heritability for all longevity mea-surements, ranging from 0.05 to 0.07 (Table 3). These estimates indicate that longevity is highly influenced by environmental factors and, therefore, indicate that di-rect selection based on these measurements leads to low genetic gains when selecting directly for longevity.
The heritability estimates for linear type traits had small variations when analyzed in bivariate analy-ses with different measures of longevity. The estimates were slightly higher when analyzed with Long1, Long2 and Long3, except for rear udder width, rear teat place-ment and udder cleft which showed higher heritability when analyzed jointly with Long4 and Long5 measures (Table 2).
The traits with highest heritabilities were stature (0.39 to 0.37), rump width (0.34 to 0.32) and teat length
Table 3 – Mean, standard deviation (SD), mean estimate of additive genetic variance (sa 2 ) and residual (s
e
2 ) and mean heritability (h²)
for longevity in Brazilian Holstein dairy cows obtained in bivariate analysis with all type traits*
Longevity
measures Mean ± SD s2a se
2 h²
Long1 22,406.75 ± 12,756.09 451.89 9070.018 0.05
Long2 2.66 ± 1.40 0.07 1.04 0.07
Long3 970.88 ± 491.91 0.80 13.36 0.06
Long4 59.80 ± 18.50 13.49 200.37 0.06
Long5 33.35 ± 18.15 11.83 193.90 0.06
deaths in calves, thereby increasing involuntary cull-ing, and substantially affecting longevity in the herd (Sewalem et al., 2008).
The genetic correlations between traits of the feet and legs section and measures of longevity, ranged from -0.18 to 0.23 (Table 4). Estimates for the side view of rear legs and all measures of longevity, and between foot angle with Long1, Long2 and Long3 were close to zero, indicating that they are not good predictors of longevity. In contrast, the estimates for foot angle with Long4 and Long5 were negative and moderate, indicat-ing that the problems associated with the foot angle tend to decrease the persistence of the cows in the herd. The highest genetic correlations, although mod-erate, were between longevity and traits of feet and legs and between bone quality and Long5 (0.23). Thus, cows with high scores for bone quality may remain longer in the herd.
Although the traits of the feet and legs section presented moderate to low genetic correlations, Schnei-der et al. (2003) observed that cows with a low degree of bone surface, presenting a clean, flat angle, an ex-tremely low foot angle and legs that were exex-tremely curved or straight showed a considerable decrease in Long5. This decrease can be explained by the increase in involuntary culling due to illnesses related to feet and legs. Onyiro et al. (2008) found moderate genetic correlation with bone quality (-0.21) and high
corre-lation between the side view of rear legs (-0.63) and digital dermatitis, reporting that cows without disease had good quality, flat bones and good set of the legs and feet, this being associated with increased herd lon-gevity.
The low genetic correlations between the fore ud-der and longevity traits suggest that selection based on fore udder attachment, fore teat placement and fore teat length, has little influence on longevity. Zavadilová and Stípková (2012) and Zavadillová et al. (2009) also had low correlations with Long5 and fore udder attachment (0.04 and -0.08).
The moderate and positive values for the genetic correlations between rear udder height (0.17 and 0.20) and rear teat placement (0.16 and 0.17) with Long4 and Long5 indicate that selection based on these traits may favor the permanence of cows in the herd. The same cannot be said between rear udder height and rear teat placement with Long1 (0.02 and -0.05), Long2 (0.09 and -0.01) and Long3 (0.12 and 0.05) that showed low genetic correlations, suggesting that few genes in-volved in the expression of rear udder height and rear teat placement also influence longevity (Long1, Long2 and Long3).
The genetic correlations between rear udder width and measures of longevity (-0.30 to -0.15) suggest that cows with wide rear udder, have lower longevity. This result clearly illustrates the decreased longevity of cows
Table 4 – Genetic, residual and phenotypic correlations between linear type traits and longevity in Brazilian Holstein cows, according to Conformation (1) Rump (2), Feet & Legs (3), Anterior udder (4), Posterior udder (5), Mammary System (6) Dairy Form (7) and Final score (8).
Sections
1 2 3 4 5 6 7 8
ST TL WE CW BD LS RA RW FA BQ SV FU FT UTL RH RUW RT UD UT UC AN FS
Genetic Correlation
LONG1 -0.18 -0.20 -0.28 -0.19 -0.22 -0.19 0.02 -0.09 0.08 0.16 -0.07 0.06 0.02 0.10 0.02 -0.21 -0.05 0.20 0.07 0.05 -0.13 -0.01 LONG2 -0.30 -0.21 - 0.33 - 0.23 - 0.26 -0.19 0.06 -0.17 -0.01 0.14 0.02 -0.04 0.02 0.11 0.09 -0.27 - 0.01 0.17 -0.07 -0.05 -0.29 -0.07 LONG3 -0.31 -0.25 -0.38 -0.27 -0.21 -0.16 0.04 -0.18 -0.02 0.21 0.05 0.02 0.07 0.08 0.12 -0.30 0.05 0.20 0.03 -0.03 -0.15 -0.08 LONG4 -0.21 -0.09 -0.30 -0.21 -0.22 -0.15 0.04 -0.10 -0.18 0.19 -0.02 0.01 0.11 0.12 0.17 -0.15 0.16 0.24 0.14 0.06 -0.15 0.02 LONG5 -0.21 -0.09 -0.31 -0.20 -0.28 -0.18 0.05 -0.07 -0.17 0.23 -0.01 0.03 0.10 0.11 0.20 -0.16 0.17 0.31 0.17 0.14 -0.17 0.04
Residual Correlation
LONG1 -0.01 0.00 - 0.01 - 0.01 - 0.02 0.01 0.01 -0.01 0.00 0.03 0.00 0.01 -0.01 0.00 0.02 0.02 0.00 - 0.01 0.01 0.02 0.03 0.08 LONG2 0.02 0.01 - 0.01 0.00 - 0.02 0.01 0.02 -0.01 -0.01 0.02 0.00 0.01 -0.02 - 0.01 0.00 0.02 -0.02 0.00 0.01 0.03 0.03 0.08 LONG3 0.02 0.00 0.00 0.00 - 0.01 0.01 0.01 0.00 0.00 0.02 0.00 0.02 -0.02 - 0.02 0.01 0.02 -0.02 0.02 0.00 0.03 0.02 0.08 LONG4 0.02 0.00 - 0.01 0.00 - 0.02 0.00 0.00 -0.01 0.01 0.00 0.01 0.02 -0.04 - 0.02 0.00 0.00 -0.04 0.04 0.00 0.02 0.01 0.06 LONG5 0.02 0.00 0.00 0.00 - 0.02 0.01 0.00 -0.01 0.01 0.00 0.00 0.02 -0.03 - 0.02 0.00 0.00 -0.03 0.04 0.00 0.01 0.01 0.06
Phenotypic Correlation
assigned to intensive selection for milk production in re-cent years, because cows with large udders have high genetic correlation with milk production (0.46 to 0.65) (Cruickshank et al., 2002; Esteves et al., 2004), and cows with high milk production are more likely to suffer in-voluntary culling, due to the higher incidence of udder health problems, such as mastitis (Rupp and Boichard, 1999; Carlén et al., 2004).
Udder depth in the mammary system section showed the highest positive genetic correlations with longevity measurements, ranging from 0.17 to 0.31, with emphasis on Long4 (0.24) and Long5 (0. 31). Higher ge-netic correlations between traits leads to the possibility of selection based on just one trait, when two are geneti-cally correlated. The choice of which to use depends on factors such as heritability, cost, ease of collection and time for taking measurements of the traits. Selection for udder depth, preferentially obtained in first lactation, has higher heritability (0.23 to 0.26) than longevity mea-sures (0.05 to 0.07), has a lower cost as it is collected early in life and presents moderate correlations with longevity (0.17 to 0.31), and, therefore, can be used as an auxiliary measure for indirect selection for longevity.
The genetic correlations between measurements of longevity and other traits of the mammary system section were low, except for udder texture and Long5 (0.14) and Long4 (0.17), and the mammary system cleft and Long5 (0.14), indicating that indirect selection for longevity based on these traits would affect Long4 and Long5. The moderate to low negative genetic correla-tions between angularity and longevity measurements show that cows with good angularity have lower longev-ity. This type trait also represents the structure of a cow and showed genetic correlation similar to traits in the conformation section.
The estimates of genetic correlations between final score and longevity measurements were close to zero (-0.08 to 0.04). These values are similar to those re-ported by Samoré et al. (2010) and Zavadilová and Stíp-ková (2012), among final score and Long5 and Long2, respectively. The low genetic correlation between lon-gevity measurements and final score, according to Za-vadilová and Stípková (2012), could result from the im-proper choice of traits and their weights to form the final score. However, Caraviello et al. (2003) and Sewalem et al. (2004) observed a strong linear relationship between final score and longevity in Holstein and Jersey cows, respectively, reducing the risk of culling animals with a high final score. The final score deserves special atten-tion because it expresses the balance of the cow for all type traits (Esteves et al., 2004).
In general, the genetic correlations between linear type traits and longevity measurements were moderate to low, indicating that indirect selection for longevity based on linear type traits may not translate into sig-nificant correlated gains in longevity. When the indirect gain in longevity was calculated to consider the type trait that had the highest genetic correlation (weight,
-0.38), this gain was approximately 20 % lower than that found with direct gain, i.e. without taking into account the generation interval. If the generation interval were to be included in the calculation of the gain, however, this could result in a greater gain in longevity, due to the longer period needed to obtain longevity compared to type measurements. Indirect selection for longevity based on type traits is, therefore, less efficient than di-rect selection, but can be justified since type traits are already collected by the breed associations, and are eas-ily measured and obtained at the beginning of the pro-ductive life, usually at the first lactation.
The highest positive genetic correlations were be-tween traits related to udder, feet and legs with Long4 and Long5, indicating that selection based on these traits may result in higher genetic longevity gains. Traits in the conformation section also showed high, but negative ge-netic correlations with Long4 and Long5 measurements.
Conclusion
Direct selection for longevity implies small and long-term genetic gains for the cows due to the low es-timates of heritability found for productive life. Linear type traits associated with the mammary system such as udder depth, udder height and rear teat placement as well as bone quality, and traits of the conformation section had higher heritability than the longevity mea-surements. They represented considerable genetic cor-relations with measurements of time between birth and last milk record, and time from first calving to last milk record and may, therefore be used for indirect selection for longevity.
Acknowledgement
The authors thank the Brazilian Association of Holstein Cattle Breeders (ABCBRH) for supplying the data, which were essential for the development of this study, and also the Coordination of Improvement of Higher Education Personnel (CAPES) for granting the scholarship.
References
Boldman, K.G.; Kriese, L.A.; Van Vleck, L.D.; Van Tassell, C.P.; Kachman S.D. 1995. A manual for use of MTDFREML: a set of programs to obtain estimates of variances and covariances. Available at: ftp://aipl.arsusda.gov/pub/outgoing/mtdfreml/ mtdfrman.pdf [Accessed May 15, 2013].
Caetano, S.L.; Rosa, G.J.M.; Savegnago, R.P.; Ramos, S.B.; Bezerra, L.A.F.; Lôbo, R.B.; De Paz, C.C.P.; Munari, D.P. 2012. Characterization of the variable cow’s age at last calving as a measurement of longevity by using the Kaplan–Meier estimator and the Cox model. Animal 7: 540-546.
Caraviello, D.Z.; Weigel, K.A.; Gianola, D. 2003. Analysis of the relationship between type traits, inbreeding, and functional survival in Jersey cattle using a Weibull Proportional Hazards Model. Journal of Dairy Science 86: 2984-2989.
Carlén, E.; Strandberg, E.; Roth, A. 2004. Genetic parameters for clinical mastitis, somatic cell score, and production in the first three lactations of Swedish Holstein cows. Journal of Dairy Science 87: 3062-3070.
Cruickshank, J.; Weigel, K.A.; Dentine, M.R.; Kirkpatrick, B.W. 2002. Indirect prediction of herd life in Guernsey Dairy Cattle. Journal of Dairy Science 85: 1307-1313.
Daliri, Z.; Hafezian, S.H.; Shad Parvar, A.; Rahimi, G. 2008. Genetic relationships among longevity, milk production and linear type traits in Iranian Holstein Cattle. Journal of Animal and Veterinary Advances 7: 512-515.
Esteves, A.M.; Bergmann, J.A.G.; Durães, M.C.; Costa, C.N.; Silva, H.M. 2004. Genetic and phenotypic correlations between type traits and milk production in Holstein cattle. Arquivo Brasileiro de Medicina Veterinária e Zootecnia 56: 529-535 (in Portuguese, with abstract in English).
Forabosco, F.; Jakobsen, J.H.; Fikse, W.F. 2009. International genetic evaluation for direct longevity in dairy bulls. Journal of Dairy Science 92: 2338-2347.
Lagrotta, M.R.; Euclydes, R.F.; Verneque, R.S.; Santana Júnior, M.L.; Pereira, R.J.; Torres, R.A. 2010. Relationship between morphological traits and milk production in Gir cows. Pesquisa Agropecuária Brasileira 45: 423-429 (in Portuguese, with abstract in English).
Makgahlela, M.L; Mostert, B.E.; Banga, C.B. 2009. Genetic relationships between calving interval and linear type traits in South African Holstein and Jersey cattle. South African Journal of Animal Science 39: 90-92.
Nilforooshan, M.A.; Edriss, M.A. 2004. Effect of age at first calving on some productive and longevity traits in Iranian Holsteins of the Isfahan Province. Journal of Dairy Science 87: 2130-2135.
Onyiro, M.O.; Andrews, J.L.; Brotherstone, S. 2008. Genetic parameters for digital dermatitis and correlations with locomotion, production, fertility traits, and longevity in Holstein-Friesian dairy cows. Journal of Dairy Science 91: 4037-4046.
Pérez-Cabal, M.A.; Alenda, R. 2002. Genetic relationships between lifetime profit and type traits in Spanish Holstein cows. Journal of Dairy Science 85: 3480-3491.
Pérez-Cabal, M.A.; García, C.; Gonzàlez-Recio, O.; Alenda, R. 2006. Genetic and phenotypic relationships among locomotion type traits, profit, production, longevity, and fertility in Spanish dairy cows. Journal of Dairy Science 89: 1776-1783.
Posadas, M.V.; López, F.J.R.; Valdenegro, H.H.M. 2004. Estimation of genetic parameters for longevity traits and milk production in Holstein cattle in Mexico. Interciencia 29: 52-56 (in Spanish, with abstract in English).
Potočnik, K.; Gantner, V.; Krsnik, J.; Štepec, M.; Logar, B.; Gorjanc, G. 2011. Analysis of longevity in Slovenian Holstein cattle. Acta Agriculturae Slovenica 98: 93-100.
Rupp, R.; Boichard, D. 1999. Genetic Parameters for clinical mastitis, somatic cell score, production, udder type traits, and milking ease in first lactation Holsteins. Journal of Dairy Science 82: 2198-2204.
Samoré, A.B.; Rizzi, R.; Rossoni, A.; Bagnato, A. 2010. Genetic parameters for functional longevity, type traits, somatic cell scores, milk flow and production in the Italian Brown Swiss. Italian Journal of Animal Science 9: 145-152.
Schneider, M.; Durr, J.W.; Cue, R.I.; Monardes, H.G. 2003. Impact of type traits on functional herd life of Quebec Holsteins assessed by survival analysis. Journal of Dairy Science 86: 4083-4089.
Sewalem, A.; Kistemaker, G.J.; Miglior, F.; Doormaal, B.J. van. 2004. Analysis of the relationship between type traits and functional survival in Canadian Holsteins using a Weibull Proportional Hazards Model. Journal of Dairy Science 87: 3938-3946.
Sewalem, A.; Miglior, F.; Kistemaker, G.J.; Sullivan, P.; Doormaal, B.J. van. 2008. Relationship between reproduction traits and functional longevity in Canadian Dairy Cattle. Journal of Dairy Science 91: 1660-1668.
Strapák, P.; Juhás, P.; Strapáková, E. 2011. The relationship between the length of productive life and the body conformation traits in cows. Journal of Central European Agriculture 12: 239-254. Tsuruta, S.; Misztal, I.; Lawlor, T.J. 2005. Changing definition of
productive life in US Holsteins: effect on genetic correlations. Journal of Dairy Science 88: 1156-1165.
Vollema, A.R.; Groen, F.A. 1997. Genetic correlations between longevity and conformation traits in an upgrading dairy cattle population. Journal of Dairy Science, 80: 3006-3014.
Zavadilová, L.; Němcová, E.; Štípková, M.; Bouška, J. 2009. Relationships between longevity and conformation traits in Czech Fleckvieh cows. Czech Journal of Animal Science 54: 387-394.