PROGRAMA DE PÓS-GRADUAÇÃO EM CIÊNCIA DA COMPUTAÇÃO DOUTORADO EM CIÊNCIA DA COMPUTAÇÃO
IGO RAMALHO BRILHANTE
RECOMMENDING PLACES BASED ON THE WISDOM-OF-THE-CROWD
RECOMMENDING PLACES BASED ON THE WISDOM-OF-THE-CROWD
Tese apresentada ao Curso de Doutorado em Ciência da Computação do Programa de Pós-Graduação em Ciência da Computação do Centro de Ciência da Universidade Federal do Ceará, como requisito parcial à obtenção do título de doutor em Ciência da Computação. Área de Concentração: Ciência da Computação Orientador: Prof. Dr. Jose Antonio Fer-nandes de Macedo
Co-Orientador: Prof. Dr. Dino Pedres-chi
Co-Orientadora: Dr.aChiara Renso
Gerada automaticamente pelo módulo Catalog, mediante os dados fornecidos pelo(a) autor(a)
B866r Brilhante, Igo Ramalho.
Recommending places based on the wisdom-of-the-crowd / Igo Ramalho Brilhante. – 2016. 168 f. : il. color.
Tese (doutorado) – Universidade Federal do Ceará, Centro de Ciências, Programa de Pós-Graduação em Ciência da Computação , Fortaleza, 2016.
Orientação: Prof. Dr. Jose Antonio Fernandes de Macedo. Coorientação: Prof. Dr. Dino Pedreschi.
1. Recommender System. 2. Trajectory Mining. 3. Sightseeing Tours. I. Título.
RECOMMENDING PLACES BASED ON THE WISDOM-OF-THE-CROWD
Tese apresentada ao Curso de Doutorado em Ciência da Computação do Programa de Pós-Graduação em Ciência da Computação do Centro de Ciência da Universidade Federal do Ceará, como requisito parcial à obtenção do título de doutor em Ciência da Computação. Área de Concentração: Ciência da Computação
Aprovada em: 10 de Junho de 2016
BANCA EXAMINADORA
Prof. Dr. Jose Antonio Fernandes de Macedo (Orientador)
Universidade Federal do Ceará - UFC
Dr.aChiara Renso (Co-Orientadora) Consiglio Nazionale delle Ricerche - CNR/Pisa
Prof. Dr. Marco Antônio Casanova Pontifícia Universidade Católica do Rio de
Janeiro - PUC/RIO
Prof.aDr.aVania Bogorny
Universidade Federal de Santa Catarina - UFSC
Prof. Dr. João Paulo Pordeus Gomes Universidade Federal do Ceará - UFC
First of all, I thank God for this achievement. Thanks to my girlfriend, Clara Rebou-ças, for sharing the hard times, lovely and unforgettable moments, and for always motivating me to improve and to take a step forward.
I thank my family: my father, Newton, who always guided me with wisdom, showing me the ways of life; my mother, Ana Paula, for the immeasurable affection; my brother, Hugo, and sister, Izabelle. I thank my grandmothers, my aunts and uncles, godmother and godfather, and cousins for all the words of encouragement.
I thank my friends and university colleagues, Regis Pires, Samara Martins, Ivanildo Barbosa, Ticiane Linhares, Livia Almada, Paulo Rego, Alex, Samara, Josue, Pedro, Romulo, Rodrigo and Janaina. Thanks to friends, colleagues and teachers of CNR: from KDDLab Roberto Trasarti, Salvatore Rinzivillo, Paolo Cintia, Lorenzo Gabrielli, Riccardo Guidotti, Giulio Rossetti, Letizia Milli, Francesca Pratesi, Vittorio Romano, Chiara Falchi, Brunella Falchi, Mirco Nanni, Anna Monreale, Barbara Furletti, Caterina D’Angelo, prof. Dino Pedreschi and Fosca Giannotti; and from HPC Lab, Massimo Coppola, Patrizio Dazzi, Claudio Lucchese, Salvatore Orlando, Fabrizio Silvestri and Cristina Muntean. Thanks to my great friends David Araujo, Luca Pappalardo, Vinicius Monteiro and Amilcar Soares Jr.
I thank the professors of the Federal University of Ceara for the teachings during this long period at the University. Thanks to Prof. Pierpaolo Degano for all efforts to achieve the collaboration between Federal University of Ceara and University of Pisa.
to any other talent.”
A opinião coletiva de um grande número de usuários, popularmente conhecida como wisdom-of-the-crowd, tem sido vista como uma poderosa ferramenta para resolver problemas. Como
sugerido por Surowiecki em seus livros, grandes grupos de pessoas são considerados mais inteligentes do que uma elite de poucos, independentemente de quão brilhante na resolução de problemas ou tomadas de decisões sábias esses são. Este fenômeno, juntamente com a disponibi-lidade de uma enorme quantidade de dados na Web propiciou o desenvolvimento de soluções que empregam a sabedoria da multidão para resolver uma variedade de problemas em diferentes domínios, tais como sistemas de recomendação, redes sociais e problemas combinatoriais. Neste sentido, esta tese tem o objetivo de aproveitar a sabedoria da multidão para entender melhor o comportamento da mobilidade humana de modo a alcançar o propósito final de auxiliar os usuários (por exemplo, pessoas), fornecendo recomendações inteligentes e eficazes. Alcançamos esse objetivo seguindo três linhas principais de investigação, conforme discutido abaixo. Na primeira linha de investigação, realizamos um estudo sobre a mobilidade humana usando a sabe-doria da multidão, culminando no desenvolvimento de uma estrutura analítica que oferece uma metodologia para entender como os pontos de interesse (PoIs) em uma cidade estão relacionados com base no deslocamento de pessoas. A segunda linha de investigação explora a sabedoria da multidão coletada através de conteúdo gerado por usuários para recomendar itinerários em cidades turísticas. Para isso, propomos uma estrutura não supervisionada, chamada TripBuilder, que alavanca grandes coleções de fotos do Flickr e pontos de interesse da Wikipedia, a fim de auxiliar os turistas no planejamento de suas visitas às cidades. Na terceira linha de investigação, exploramos a sabedoria da multidão para realizar recomendações de grupos de pessoas (por exemplo, amigos) que pudessem desfrutar de um determinado item (por exemplo, restaurante) em conjunto. Propomos GroupFinder para abordar o novo problema de formação de grupo de usuário-item destinado a recomendar o melhor grupo de amigos para um determinado par
<usuario,item>.
The collective opinion of a great number of users, popularly known aswisdom of the crowd,
has been seen as powerful tool for solving problems. As suggested by Surowiecki in his books, large groups of people are now considered smarter than an elite few, regardless of how brilliant at solving problems or coming to wise decisions they are. This phenomenon together with the availability of a huge amount of data on the Web has propitiated the development of solutions which employ the wisdom-of-the-crowd to solve a variety of problems in different domains, such as recommender systems, social networks and combinatorial problems. In this light, this thesis has the objective of taking advantage of the wisdom of the crowd in order to better understand human mobility behavior so as to achieve the final purpose of supporting users (e.g. people) by providing intelligent and effective recommendations. We accomplish this objective by following three main lines of investigation. In the first line of investigation we conduct a study of human mobility using the wisdom-of-the-crowd, culminating in the development of an analytical framework that offers a methodology to understand how the points of interest (PoIs) in a city are related to each other on the basis of the displacement of people. The second line of investigation exploits the wisdom-of-the-crowd collected through user-generated content to recommend itineraries in tourist cities. To this end, we propose an unsupervised framework, called TripBuilder, that leverages large collections of Flickr photos, as the wisdom-of-the-crowd, and points of interest from Wikipedia in order to support tourists in planning their visits to the cities. In the third line of investigation, we exploit the wisdom-of-the-crowd to leverage recommendations of groups of people (e.g. friends) who can enjoy an item (e.g. restaurant) together. We propose GroupFinder to address the novel user-item group formation problem aimed at recommending the best group of friends for a<user,item>pair.
Figura 1 – Empirical analysis of a dataset of public available on Flickr. Figure from (MICHEL, 2014). . . 24 Figura 2 – Representative photos found from 33,393,835 photos from 307,448 Flickr
users. Figure from (CRANDALLet al., 2009). . . 24
Figura 3 – Two multiplex/multidimensional networks illustations: (a) network of nine nodes with two layers, the red (solid) and the blue (dashed) layer from (LEE
et al., 2015); (b) two social networks with different types of links between
the users from (BERLINGERIOet al., 2011b). . . 30
Figura 4 – Example of communities found in two networks: (a) three communities found using modularity by Newmanet al. (Figure from (NEWMAN, 2006));
(b) communities found using the link community algorithm by Ahn et al.
(Figure from (AHNet al., 2010)). . . 32
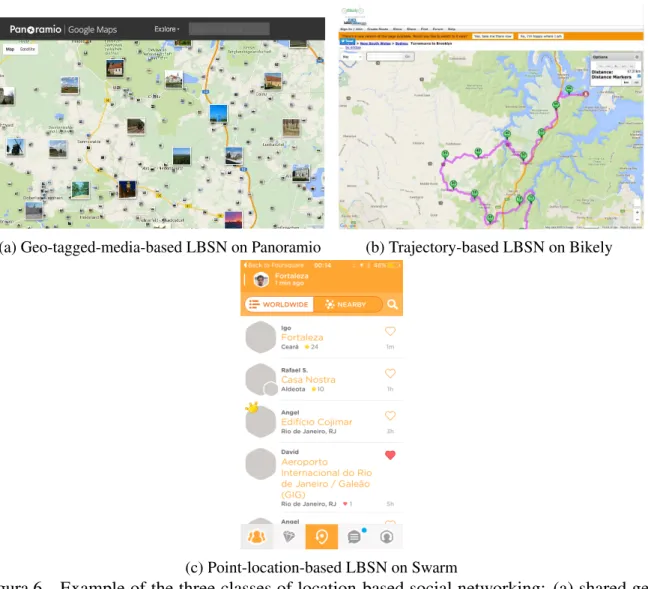
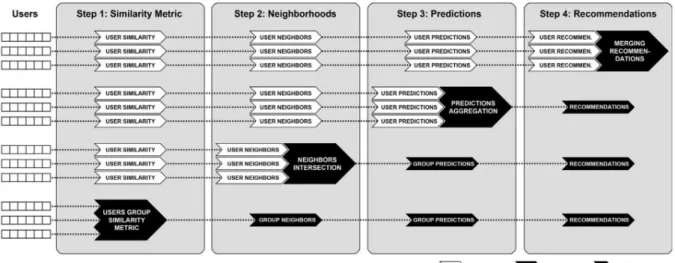
Figura 5 – Example of neighborhood-based collaborative filtering for each group of users similar to the active user are identified to find out possible interesting items as recommendation. . . 38 Figura 6 – Example of the three classes of location-based social networking: (a) shared
geo-tagged photos by users in Panoramio; (b) trajectory shared by a user on Bikely; (c) venues sharing through users’ check-ins on Swarm. . . 43 Figura 7 – (a) Tree-based Hierchical Graph on the left, and the Tree-based Hierarchy on
the right; and (b) HITS-based inference model. Figures from (ZHENGet al.,
2009). . . 45 Figura 8 – Concepts and their relationships in the ontology by Huanget al. Figure from
(HUANG; BIAN, 2009). . . 50 Figura 9 – Classification of the recommendations to groups in Collaborative Filtering
RSs. The figure represents the four representative cases for approaching the solution to group recommendations. Figure from (ORTEGAet al., 2013). . 54
Figura 10 – The dual-wing RBM proposed by (HU et al., 2014) placed on the top of
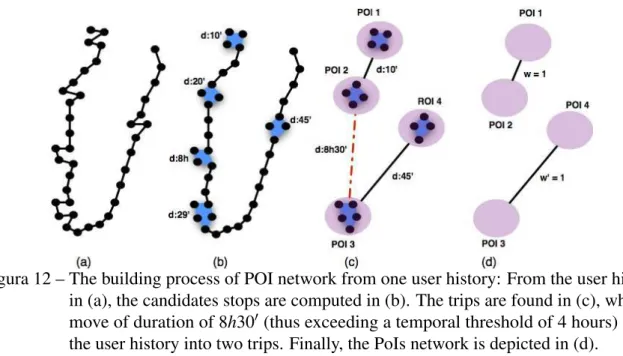
DBN, which jointly models the group choices and collective features to learn the comprehensive features of group preference. . . 56 Figura 11 – Example of assigning the POILeaning Tower(purple diamond) to two
(c), where a move of duration of 8h30′(thus exceeding a temporal threshold
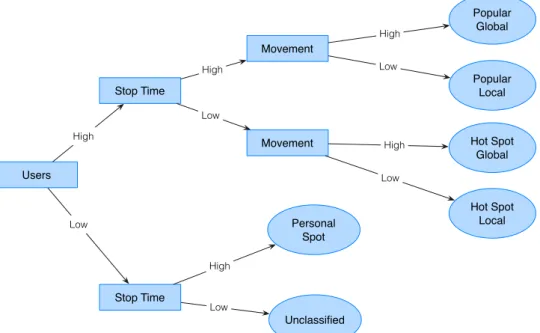
of 4 hours) splits the user history into two trips. Finally, the PoIs network is depicted in (d). . . 68 Figura 13 – Summarization of node classes based on users, stoptime and movement
attributes. . . 70 Figura 14 – Category distribution for each city: Pisa, Florence and Milan. Four
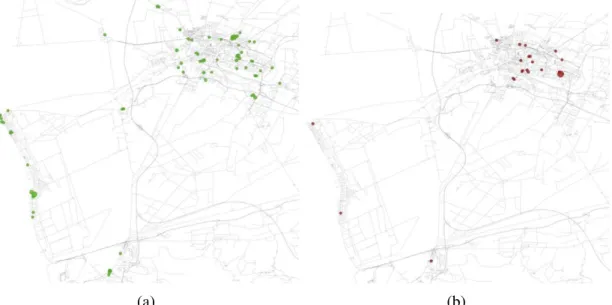
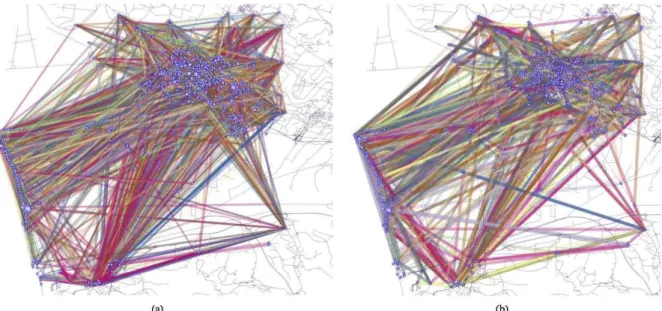
cate-gories are considered: Shop & Service, Food, Great Outdoors and Arts & Entertainment. (a) absolute values and (b) for normalized values. . . 76 Figura 15 – Points of interest for each city: (a) Pisa, (b) Florence and (c) Milan. . . 76 Figura 16 – Degree distribution of the networks for weekdays (a) and weekends (b). . . 78 Figura 17 – POI Network of Pisa in weekdays(a) and weekends(b) . . . 79 Figura 18 – Comparison between PoIs Network and randomly generated networks. . . . 80 Figura 19 – Node classes in the three networks for weekdays and weekends. Axis y
corresponds to the % of number of number of each class. . . 80 Figura 20 – Hot spot global (a) and local (b) nodes in Pisa on weekends. We can see more
global PoIs on the beaches and the concentration of local ones on the city center. . . 81 Figura 21 – Popular global (a) and local (b) nodes in Florence on weekdays. . . 82 Figura 22 – Hot spot global (a) and local (b) nodes in Milan on weekends. . . 82 Figura 23 – Communities in the PoI networks of Pisa for weekdays (a) and weekends (b). 83 Figura 24 – Community size distribution for each city: (a) Pisa, (b) Florence, (c) Milan;
on log scale. . . 84 Figura 25 – Compactness for each city: (a) Pisa, (b) Florence, (c) Milan. . . 84 Figura 26 – The five largest communities in Pisa on weekdays (a) and weekends (b). . . 85 Figura 27 – The five largest communities in Florence on weekdays (a) and weekends (b). 85 Figura 28 – The five largest communities in Milan on weekdays (a) and weekends (b). . 86 Figura 29 – The least and most similar communities to the network in Pisa. . . 87 Figura 30 – The least and most similar communities to the network in Florence. . . 88 Figura 31 – The least and most similar communities to the network in Milan. . . 88 Figura 32 – Correlation between number of trips (trip count) andFeatureSimin Pisa. . . 90
Figura 33 – Examples of how op(i,k) modifies the tour according to l(i,k), i.e., the
minimum number of endPoIs connections betweeniandk. . . 99
Figura 36 – Plot shows the probability distribution of the inter-arrival time for pairs of consecutive photos taken in Rome, Florence, and Pisa. The vertical lines highlight the time thresholds corresponding toP(x≤δ) =0.9. . . 103
Figura 37 – Plots (a), (b), (c) show instead the distribution of trajectories length (as num-ber of PoIs crossed), the popularity of PoIs and the popularity of categories in the three datasets. . . 104 Figura 38 – Average path costs of the techniques employed to solve TRAJSP as a function
of the budget. . . 113 Figura 39 – Average total runtime as a function of the time budget for each city. Bottom
bars refer to the average TRIPCOVERruntime while upper bars refer to the average TRAJSP runtime. . . 113 Figura 40 – Average runtime of Nearest Trajectory and Local Search by varying the time
budget. . . 114 Figura 41 – Architecture of TRIPBUILDER. We outline the four modules of the system,
i.e. Data Collection,Data Processing,Data StorageandTripBuilder Engine. 117
Figura 42 – A screen-shot of the Web interface that lets users interact with TRIPBUILDER to select the targeted city in the system. This screen is the very first step on the web application. . . 121 Figura 43 – Screen-shot illustrating the component for setting the preferences, number of
days of the tour, level of personalization and also the details of the created sightseeing tours for each day. . . 122 Figura 44 – List of saved sightseeing tours saved by the user. She can then open and edit
any of those tours. . . 122 Figura 45 – Among the information about the points of interest such as time needed to
visit, the user is also able to find photos of the point of interest from Flickr and Panoramio. We see in this example a photo of an important museum in Amsterdam that is part of the generated tour. . . 123 Figura 46 – Popular places of the city are mined from the collected Flickr photos given
important insights for the tourists. . . 123 Figura 47 – Users can save and retrieve their created tours in order to share them with
other users (e.g. friends) that might take advantage of it to plan their visit in the city. . . 124 Figura 48 – Layers of the distributed and scalable architecture of TRIPBUILDER for
network of useru0having the same set of users. . . 129
Figura 51 – Application of the Aggregated Voting (a) and Least Misery (b) pairwise user-item relevance functions w.r.t. itemFlorencein the previous example. . 131
Figura 52 – Running example of the GREEDYalgorithm for the example in Figure 51a using Aggregated Voting, the itemFlorenceandk=3. . . 134 Figura 53 – Running example of thek-NN algorithm for the example in Figure 51a using
Aggregated Voting, the itemFlorenceandk=3. . . 135 Figura 54 – The components of the GroupFinder framework: Recommender System,
Social Network ManagerandGroup Finder Engine. The input is the triple
<u,i,k>representing the user, the item and the size of the group and the
output is the recommended groupGu,i. . . 136
Figura 55 – Degree distribution of the social networks of the four datasets used in the experiments: Foursquare, Foursquare (New York), Brightkite and Gowalla. . 138 Figura 56 – Weighted density of the groups computed with the various algorithms
em-ploying PAV and PLM on the four datasets: Foursquare, Foursquare (New York), Brightkite and Gowalla. . . 143 Figura 57 – Precision computed on the basis of the groups suggested by the various
algorithms employing PAV and PLM w.r.t. the ground-truth groups for the four datasets: Foursquare, Foursquare (New York), Brightkite and Gowalla. 144 Figura 58 – Recall computed on the basis of the groups suggested by the various
algo-rithms employing PAV and PLM w.r.t. the ground-truth groups for the four datasets: Foursquare, Foursquare (New York), Brightkite and Gowalla. . . . 145 Figura 59 – Execution time for the GREEDY,k-NN, andDkSPalgorithms as a function
of the sizekof the groups (a), and of the size of the User-Item Ego Networks
Tabela 1 – Overview of traditional aggregation strategies for group recommendation.
Table from (RICCIet al., 2011). . . 55
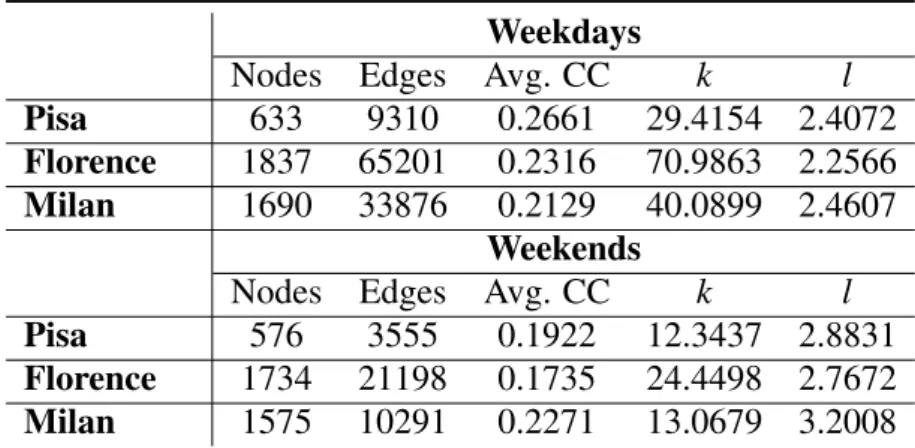
Tabela 2 – PoI Network properties for Pisa, Florence and Milan. Number of nodes, number of edges, average clustering coefficient (Avg. CC), average degree of the nodes (k), and average shortest path (l). . . 78
Tabela 3 – Number of communities found in Pisa, Florence and Milan on weekdays (WD) and weekends (WE). . . 84
Tabela 4 – Pisa . . . 89
Tabela 5 – Florence . . . 89
Tabela 6 – Milan . . . 89
Tabela 7 – Statistics regarding the three cities in our dataset. . . 103
Tabela 8 – Top-3 most popular PoIs and Categories in Pisa, Florence, and Rome. We also report three examples of trajectories per city extracted from the dataset. 105 Tabela 9 – Random Selection: average effectiveness of TRIPBUILDERand the baseli-nes in Pisa. . . 108
Tabela 10 – Random Selection: average effectiveness of TRIPBUILDERand the baseli-nes in Florence. . . 108
Tabela 11 – Random Selection: average effectiveness of TRIPBUILDERand the baseli-nes in Rome. . . 109
Tabela 12 – Profile-based selection: average effectiveness of TRIPBUILDER and the baselines in Pisa obtained by exploiting the profiles from Florence visits. . . 111
Tabela 13 – Profile-based selection: average effectiveness of TRIPBUILDER and the baselines in Florence obtained by exploiting the profiles from Rome visits. . 111
Tabela 14 – Profile-based selection: average effectiveness of TRIPBUILDER and the baselines in Rome obtained by exploiting the profiles from Florence visits. . 112
Tabela 15 – Example of the geo-tagged photos collected from Flickr. . . 118
Tabela 16 – Example of the points of interest collected from Wikipedia. . . 118
Tabela 17 – Statistics regarding the four datasets used in the experiments: Foursquare, Foursquare (New York), Brightkite and Gowalla. . . 137
Algoritmo 1 – PoI Network Builder . . . 69 Algoritmo 2 – GREEDYalgorithm from (ASAHIROet al., 2000) adapted to the UI-GF
1 INTRODUCTION . . . 21
1.1 Context and Challenges . . . 21
1.2 Hypotheses and Research Questions . . . 22
1.3 Thesis Contribution . . . 26
1.4 Thesis Organization . . . 27
2 RELATED WORKS . . . 28
2.1 Mobility Data Analysis, Mining and Networks . . . 28
2.1.1 Trajectories . . . 28
2.1.2 Networks . . . 29
2.2 Recommender Systems . . . 31
2.2.1 Content-based Recommender Systems . . . 33
2.2.2 Collaborative Filtering Recommender Systems . . . 36
2.2.2.1 Neighborhood-based Collaborative Filtering . . . 36
2.2.2.2 Model-based Collaborative Filtering Recommender Systems . . . 40
2.3 Recommender Systems for Location-based Services. . . 41
2.3.1 Stand-alone location recommendation . . . 44
2.3.2 Sequential location recommendation . . . 48
2.4 Group Recommendation . . . 53
2.5 Group Formation Problem. . . 58
3 COMETOGETHER: FINDING AND CHARACTERIZING COMMU-NITIES OF PLACES IN URBAN MOBILITY . . . 61
3.1 Introduction . . . 61
3.2 Basic Concepts . . . 63
3.3 The COMETOGETHERMethodology . . . 66
3.3.1 Building the PoI network . . . 67
3.3.2 PoI Network Analysis . . . 68
3.3.2.1 From network connectivity to mobility-related measures . . . 70
3.3.3 Communities of points of interests . . . 72
3.3.3.1 Compactness . . . 73
3.3.3.2 Feature Similarity . . . 73
3.4 Random Mobility Models . . . 74
3.5 Case Study on Different Cities . . . 74
3.5.1 Data and Tools. . . 75
3.5.2 Building the PoI network . . . 76
3.5.3.1 Confronting PoI Networks and Random Models . . . 79
3.5.3.2 Node classes . . . 79
3.5.4 Community discovery in PoI networks . . . 82
3.5.5 Largest Communities . . . 84
3.5.6 Comparing Communities against the Network. . . 86
3.6 Discussion . . . 90
4 PLANNING SIGHTSEEING TOURS BASED ON THE WISDOM-OF-THE-CROWD . . . 92
4.1 Introduction . . . 92
4.2 The TripCover Problem . . . 94
4.3 The TrajSP Problem . . . 97
4.3.1 Trajectory Scheduling Problem . . . 97
4.3.1.1 Scheduling the tour on the user agenda . . . 99
4.4 Building the Knowledge Base . . . 100
4.4.1 Points of interest discovery . . . 100
4.4.2 Users and PoI histories . . . 101
4.4.3 Trajectories creation . . . 102
4.4.4 Traveling time estimation . . . 102
4.5 Datasets statistics . . . 103
4.6 Experiments. . . 105
4.6.1 Effectiveness –TRIPCOVER . . . 106
4.6.1.1 Random Selection . . . 107
4.6.1.2 Profile-based Selection . . . 110
4.6.2 Effectiveness –TRAJSP . . . 111
4.6.2.1 Efficiency . . . 112
4.7 Discussion . . . 114
5 TRIPBUILDER PLATFORM TO CREATE PERSONALIZED SIGHT-SEEING TOURS . . . 116
5.1 Introduction . . . 116
5.2 TRIPBUILDERPlatform . . . 117
5.2.1 Data Collection . . . 118
5.2.2 Data Processing . . . 118
5.2.3 Data Storage . . . 119
5.2.4 TripBuilder Engine . . . 119
5.4.2 Batch Layer with Apache Spark . . . 125
5.4.3 Distributed Data Storage . . . 126
5.5 Discussion . . . 126
6 GROUPFINDER FRAMEWORK FOR GROUP FORMATION PRO-BLEM . . . 127
6.1 Introduction . . . 127
6.2 The User-Item Group Formation problem . . . 129
6.3 Addressing the UI-GF Problem . . . 131
6.3.1 GREEDYalgorithm . . . 132
6.3.2 Nearest Neighbor Densek-Subgraph (k-NN) . . . 133
6.4 GROUPFINDERFramework . . . 134
6.4.0.1 Recommender System . . . 135
6.4.0.2 Social Network Manager . . . 135
6.4.0.3 Group Finder Engine . . . 136
6.5 Experimental Settings . . . 137
6.5.1 Datasets . . . 137
6.5.2 Computing the relevance scores . . . 138
6.5.3 Ground-truth groups . . . 139
6.5.4 Performance Metrics . . . 140
6.5.5 Baselines. . . 140
6.5.5.1 Densest k-Subgraph (DkSP) . . . 140
6.5.5.2 Topk-Nodes(k-Top) . . . 141
6.6 Experiments. . . 141
6.6.1 Effectiveness . . . 141
6.6.1.1 Weighted Pairwise Satisfaction Density . . . 141
6.6.1.2 Precision and Recall . . . 142
6.6.2 Efficiency . . . 146
6.7 Discussion . . . 147
7 CONCLUSIONS AND FUTURE WORKS . . . 149
7.1 Conclusions . . . 149
7.2 Future Works . . . 150
7.2.0.1 Recommendation of personalized sightseeing tours . . . 150
7.2.0.2 Advances in User-Item Group Formation . . . 152
PUBLICATIONS AND AWARDS Publications
Journals
1. Igo Ramalho Brilhante, José Antônio Fernandes de Macêdo, Franco Maria Nardini, Raffa-ele Perego, Chiara Renso: On planning sightseeing tours with TripBuilder. Information Processing & Management(IPM) 51(2): 1-15 (2015)
Conferences
1. Igo Ramalho Brilhante, Michele Berlingerio, Roberto Trasarti, Chiara Renso, José Antônio Fernandes de Macêdo, Marco Antonio Casanova: ComeTogether: Discovering Communi-ties of Places. Mobility Data Management(MDM) 2012: 268-273
2. Igo Ramalho Brilhante, José Antônio Fernandes de Macêdo, Franco Maria Nardini, Raf-faele Perego, Chiara Renso: Where shall we go today?: planning touristic tours with TripBuilder. Conference on Information and Knowledge Management (CIKM) 2013:
757-762
3. Igo Ramalho Brilhante, José Antônio Fernandes de Macêdo, Franco Maria Nardini, Raf-faele Perego, Chiara Renso: TripBuilder: A Tool for Recommending Sightseeing Tours.
European Conference on Information Retrieval(ECIR) 2014: 771-774
4. Igo Ramalho Brilhante, José Antônio Fernandes de Macêdo, Franco Maria Nardini, Raffa-ele Perego, Chiara Renso: Group Finder: an Item-driven Group Formation Framework.
Mobility Data Management(MDM) (2016) Workshops
1. Igo Ramalho Brilhante, José Antônio Fernandes de Macêdo, Franco Maria Nardini, Raffa-ele Perego, Chiara Renso: Scaling up the Mining of Semantically-enriched Trajectories: TripBuilder at the World Level.Italian Information Retrieval Workshop(IIR) 2015
1. Igo Ramalho Brilhante, José Antônio Fernandes de Macêdo, Franco Maria Nardini, Raf-faele Perego, Chiara Renso: User-Item Group Formation with GROUPFINDER. Italian Information Retrieval Workshop(IIR) 2016
Special Tracks
SIGSPATIAL Special7(1): 59-66 (2015)
Awards
Best demo award
1. TripBuilder: A Tool for Recommending Sightseeing Tours Igo Ramalho Brilhante, Jose Antonio Macedo, Franco Maria Nardini, Raffaele Perego, Chiara Renso. European Conference on Information Retrieval (ECIR) 2014 participants elected the winner of the
1 INTRODUCTION
1.1 Context and Challenges
The collective opinion of a great number of users, popularly known aswisdom of the crowd, has been seen as powerful tool for solving problems. As suggested by Surowiecki
in his books (SUROWIECKI, 2004), large groups of people are now considered smarter than an elite few, regardless of how brilliant at solving problems or coming to wise decisions they are. This phenomenon together with the availability of a huge amount of data on the Web has propitiated the development of solutions which employ the wisdom-of-the-crowd to solve a variety of problems in different domains, such as recommender systems (SHANGet al., 2011),
social networks (LUet al., 2014) and combinatorial problems (YIet al., 2012; YIet al., 2010).
The vast majority of data on the Web has been generated in the last few years by billions of users around the globe using their mobile devices and web applications, mainly on social networks. This information carries striking details of daily activities ranging from urban mobility and tourism behavior, to emotions and interests. The largest social network nowadays is Facebook, which in December 2015 had incredible 1.31 billion mobile active users, 4.5 billion
“likes” generated daily. In addition, every 60 seconds 510 comments are posted, 293,000 statuses
are updated, and 136,000 photos are uploaded1. This flood of data has brought great opportunities to discover individual and collective preferences, and use this information to offer services to meet people’s needs, such as recommending relevant and interesting items (e.g. news, places, movies). Furthermore, it is now possible to exploit the experiences of groups of people as a collective behavior so as to augment the experience of other. This latter illustrates the important scenario where the discovery of collective behavioral patterns, the wisdom-of-the-crowd, may enrich the experience of individual users. We strongly believe that the collective opinion and experience is better than individual ones: Vox populi, vox Deli.
These opportunities, therefore, bring several challenges on exploiting the wisdom-of-the-crowd to augment and develop new services to support users. First of all, the collection process and the mining of crucial information concerning the users’ behavior can be remarkably noisy. Secondly, there is a need to develop methodologies able to encompass all the elements, such as user preferences and interests, spatial-temporal data, points of interest features, and so on.
Motivated by the challenges and the identified directions in the presented context, this thesis focuses on the problem of recommending personalized sightseeing tours for tourists that are visiting a new destination. This research topic has been receiving much attention in the last few years due to the enormous potential in the tourism environment for both industrial
and scientific communities. According toWorld Travel Tourism Council2, travel and tourism
generated two trillion dollars directly in the global GDP and by 2025, international tourist arrivals are forecast to total 1,796,210,000, generating expenditure of USD2,140.1bn, an increase of 4.2% pa3. These statistics therefore highlight the potential of tourism and the need to provide
new solutions for the problems inherent in this area.
These facts combined with availability of a huge amount of data on the Web relating to millions of users has inspired us to exploit the benefits and peculiarities of the phenomenon of the wisdom-of-the-crowd in the context of studying previous tourist behavior in order to provide recommendations for personalized sightseeing tours for future tourists. Several key tasks are involved: (i) collecting data to represent the wisdom-of-the-crowd; (ii) integrating the wisdom-of-the-crowd with data sources about tourism available on the Web, like points of interest and their categories (e.g. museums, natural world); (iii) mining and discovery of essential information about the points of interest and tourist behavior; (iv) considering the nature of the tours, i.e. if they are based on individuals or groups of users; (v) dealing with spatio-temporal data that can represent the displacement of tourists in the city.
In front of these tasks, the proposal of this thesis is to investigate how to exploit the wisdom-of-the-crowd as the collective behavioral pattern to support individual users in “finding” the most suitable sightseeing tour based on their needs and preferences. In the next section, we describe the hypothesis and research questions investigated in this thesis.
1.2 Hypotheses and Research Questions
Complex challenges are posed when dealing with data about millions of people both for industry (e.g. tourism and e-commerce) and for the scientific community. Understanding in such a way as to identify implicit laws in order to build new business models or leverage existing ones is certainly a big issue to deal with. A second issue is the mining and discovery of patterns hidden in the data in order to explain some phenomena that govern our society. Several studies have been conducted in order to create theoretical frameworks to explain some phenomena. We can cite the paper by Gonzálezet al. (GONZÁLEZet al., 2008) reporting a study of 100,000 anonymized mobile phone users which revealed that human trajectories show a high degree of temporal and spatial regularity and that individual travel patterns collapse into a single spatial probability distribution. Interestingly, this indicates that, despite the diversity of their travel history, humans follow simple reproducible patterns. These results show important considerations regarding the impact on phenomena driven by human mobility, such as epidemic prevention, emergency response and urban planning. It is also worthwhile citing the astonishing studies
2 <http://www.wttc.org/>
3 Source: <https://www.wttc.org/-/media/files/reports/economic%20impact%20research/regional%202015/
about the spread of epidemic diseases on complex systems organized asnetworks(NEWMAN,
2002; NEWMAN, 2003; PASTOR-SATORRASet al., 2015; LEVENTHALet al., 2015).
Considering these observations and the objective of this thesis, the main hypotheses that guided our work are presented below:
1. The mobility of users (e.g. people) can characterize points of interest, thus the movement of people between points of interest in their daily activities can lead to a different approach to group them together, based on the movements;
2. The wisdom-of-the-crowd based on both location-based social networking services and user-generated description of points of interest can leverage the development of a tourism knowledge base to favor the creation of personalized sightseeing tours for tourists thinking of visiting a new destination;
3. The wisdom-of-the-crowd produced from social network data combined with recommender system frameworks can contribute to identify meaningful groups of users who can enjoy a given item (e.g. city, music) together.
The first hypothesis motivated us to raise the following research question:
RQ1. Can we study urban mobility on a global scale from the perspective of places, instead of users?
This question led us to conduct a study of human mobility using datasets collected from enabled-GPS cars in three Italian cities. The resulting development of an analytical framework offers a methodology to understand how the points of interest of a city are related to each other from the displacement of people, on the basis of important and useful features of the points of interest.
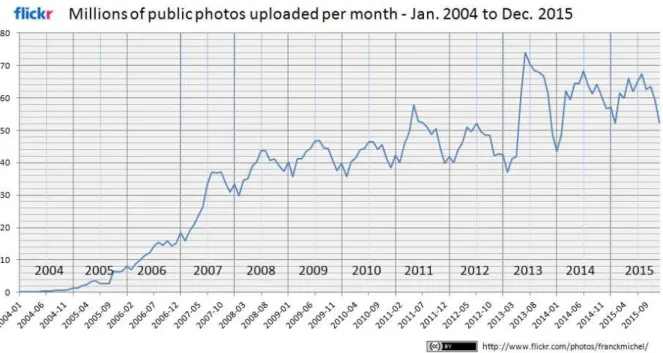
Our first results gave us some insights stating that discovered patterns of people movement between points of interest in a city can contribute to generating new knowledge useful in several applications. As we have seen earlier, users tend to share data about their daily activities, and this happens especially when on holiday, or when visiting new places. The latter is the reason behind the second hypothesis, which guided us to investigate the possibility of exploiting geo-tagged photos from Flickr. This approach can leverage a knowledge based construction to support the creation of personalized sightseeing tours. An empirical study, illustrated in Figure 14, shows remarkable behavior by Flickr users when uploading photos. The
number of publicly uploaded photos is significant, since they represent users who share their photos for access by other users. An interesting finding relates to the peaks of each year. It is worthwhile noting that the peaks take place around the months of July and August, implying that users tend to upload more photos during their vacations. These results indicate that the large collection of Flickr photos could be useful to our task: taking advantage of the wisdom-of-the-crowd as a knowledge base to support users (e.g. tourists) visiting a new place. However, we
Figura 1 – Empirical analysis of a dataset of public available on Flickr. Figure from (MICHEL, 2014).
Figura 2 – Representative photos found from 33,393,835 photos from 307,448 Flickr users.
Figure from (CRANDALLet al., 2009).
still need some insights that could demonstrate, even empirically, that the uploaded photos could (in some way) represent interesting points of interest in the city, instead of just random objects found by the users.
a large collection of geo-tagged photos collected from Flickr. The interesting result is that representative photos of the given area (e.g. clustering area) are usually related to the tourist attractions as shown in Figure 2. These results highlight the powerful data available that can represent the typical tourist behavior in the cities which could provide essential information for new tourists. Inspired by these results, we raised the following research question:
RQ2.Can we take advantage of the data provided by millions of users, also called wisdom-of-the-crowd, to support users (e.g. tourists) in planning their vacations to a new
destination?
As we have seen, the growth of available data about user activities may provide uncountable outcomes once we know how to appropriately deal with and manage it. On this basis, a second contribution we propose in this thesis is an unsupervised framework, called TRIPBUILDER, which leverages large collections of Flickr photos and points of interest from Wikipedia to support tourists in those cities. More specifically, our framework creates a tourist knowledge base capturing the tourists’ movement behaviors from Flickr photos combined with points of interest from Wikipedia to create personalized sightseeing tours in a given city considering the time allowance of the user and preferences. Based on this theoretical framework, we designed and developed a platform encompassing the main features required to create personalized sightseeing tours. This platform has been crucial to understanding tourists’ needs when they are planning a visit to a new city. The designed system has been mentioned in the Brazilian news5and Communications of the ACM6.
The third hypothesis motivated us to investigate how to exploit social ties between users in order to form meaningful groups of users to enjoy a given item, like a city, restaurant, etc.
It is worth noting that some application services may not be appropriate for individual users. In some situations, recommendations to groups of users are more relevant than individual ones. Consider for example, a day-trip, when people usually go with companions to share the travel experience. Other examples may be going to restaurant with a group of friends, or watching a certain film in the cinema. Social networks represent and highlight friendship networks and the high level of interaction between groups of users who are friends. Then, some works have been carried out in the literature to provide services for groups of users. In particular, the problem of recommending items (e.g. movies, books, etc) to a group of users (JAMESON; SMYTH, 2007; RICCIet al., 2011; BOBADILLAet al., 2013) has been investigated. However, in some
situations the group is not known a priori, in which case the user could be recommended an activity for a group of friends to enjoy (e.g. restaurant).
Considering the scenario of TRIPBUILDER, some people usually go on their va-cations with friends who are also interested in the destination. Therefore, we investigate the following research question:
RQ3.How can we find out the best groups of users (e.g. friends) who can enjoy a given item together?
In this thesis we investigate this problem by exploiting social networks jointly with recommender systems. In particular, we take advantage of the recommendations of items for users and how friends are linked to each other in order to find out the “best” groups of friends to enjoy a specific item. In this thesis, we present our framework GROUPFINDERthat aims to deal with this issue.
1.3 Thesis Contribution
The main contributions of this thesis are the following.
• We conducted a study on human mobility considering points of interest as the central objective from the perspective of complex networks. We presented a framework that encompasses useful features for points of interest that can be mined from GPS data. We ex-perimented the methodology in three Italian cities highlighting the most important findings and comparing the results for each city. The results were published in (BRILHANTEet al., 2012).
• We proposed TRIPBUILDER, an unsupervised framework for planning personalized sight-seeing tours in cities. To this purpose we use: i) Flickr, to gather public photos (and their meta data), ii), Wikipedia to gather information regarding PoIs in the given city, iii) Google maps to estimate the time needed to move from one PoI to the next one in the sightseeing itinerary. The resulting knowledge base stores PoIs, their popularity, the time needed on average to visit them, the categories for which each PoI is relevant, and the patterns of movement of tourists that visited them in the past. In order to assess our system, we report on the building of a knowledge base covering three Italian cities which are important for tourism and guarantee variety and diversity in terms of size and the wealth of public user-generated content available: Rome, Florence, and Pisa. The resulting knowledge base, available for download to favor the reproducibility of results, is analyzed and its characte-ristics are here discussed. Finally, we report on several new experiments to evaluate the effectiveness and efficiency of all the components of our system and show that our solution outperforms competitive baselines. In particular, we assess TRIPBUILDER’s performance in providing budgeted sightseeing itineraries made up of actual PoI patterns tailored to the specific preferences of the tourist. The results were published in (BRILHANTEet al.,
• We design and develop a platform built upon TRIPBUILDER to evaluate the proposed algorithms and the methodology to create the tourism knowledge base. In this platform, the user is able to create their personalized sightseeing tour considering the amount of time available and their preferences. The user can also balance personalization and popularity to modify the suggested tour. In addition, the platform has some social capabilities allowing the users to share the tours in such a way that the new user can re-use them as they need. The results of this chapter were published in (BRILHANTEet al., 2014).
• We formalize the user-item group formation problem aimed at recommending the best group of friends for a<user,item>pair. We address this novel problem by combining user-item relevance information with the user social network (ego network), trying to balance the satisfaction of all the members of the group for theitemwith the intra-group
relationships. We propose two different solutions that are accommodated into a framework called GroupFinder, which integrates the needed components and information sources. We instantiate the problem in the location-based recommendation domain and we experiment GroupFinder on four publicly available Location-Based Social Network (LBSN) datasets, showing that our solution is effective and outperforms strong baselines. The results were published in (BRILHANTEet al., 2016; BRILHANTEet al., 2016).
1.4 Thesis Organization
The remainder of this thesis is organized as follows. In Chapter 2 we present the state of the arts related to this thesis. In particular, we present works related to mobility data analysis and complex networks. Then we go through recommender systems and location-based recommender systems. Later, the works involving group recommendation are introduced. Finally, we present a recent research regarding the group formation problem.
2 RELATED WORKS
This chapter presents the works related to this thesis. First, we present works concer-ning analysis of mobility data in Section 2.1. Then, we give basic foundations in Recommender Systems in Section 2.2 to support Section 2.3 which presents the important results in location-based recommender system. Finally, the works in group recommendation research fields are discussed in Section 2.4 and Section 2.5.
2.1 Mobility Data Analysis, Mining and Networks
2.1.1 Trajectories
Human mobility is a complex phenomena witnessed by a huge amount of interdisci-plinary research in this topic, ranging from Physics to Sociology, Transportation Research and Computer Science (GIANNOTTI; PEDRESCHI, 2008; GIANNOTTIet al., 2011; ZHENGet al.,
2010). In this sense, many efforts in the community have been done to develop new techniques to support better understanding of human mobility. The main object considered in this study is usually atrajectoryof amoving object(e.g. person).
A trajectory is usually defined as the spatio-temporal evolution of a moving object (e.g. person). This evolution is typically represented as a sequence of positional observations represented byx andycoordinates of time-stamped sample points as collected by a tracking
device, such as GPS tools or WI-FI sensors. However, many applications require more than coordinates, i.e., there is the need for semantic information inherent to the trajectories, which is usually done by means of annotations. A trajectory that has been enhanced withannotations
is the definition of semantic trajectory as proposed by Parent et al. (PARENTet al., 2013).
These annotations include the common case of "stop and moves"where segments of a trajectory representing the absence of movement are called "stops"while the parts representing the actual movement are called "moves"(SPACCAPIETRAet al., 2008). Depending on the application,
stops and moves can be annotated in several ways, but it is common to associate stops to the visited points of interest (RENSO STEFANO SPACCAPIETRA, 2013). In this thesis, we exploit semantic trajectory as the basis of the presented approach where the trajectories are seen as sequence of points of interest visited by the users.
become a hot research topic since several methods on data mining and statistical techniques, tailored to trajectory data, have been proposed in the literature, like (GIANNOTTI; PEDRESCHI, 2008; GIANNOTTIet al., 2011; ZHENGet al., 2010).
The task of analyzing large trajectory datasets can be carried out towards different directions. Basic statistics may be applied to trajectory data mainly to discover the distributions of people presence and origin-destination matrices (CALABRESEet al., 2010); other studies
focus on trajectory data mining aiming at finding correlations in large datasets of positioning data (GIANNOTTI; PEDRESCHI, 2008). Techniques to extract movement patterns include: (1)clustering discovery- finding groups of objects moving together – the authors in (NANNI;
PEDRESCHI, 2006) propose a time-focused clustering of trajectories based on OPTICS algo-rithm (ANKERST et al., 1999); (2) sequential pattern discovery- finding the most frequent
sequences of places visited – the authors in (NANNI et al., 2007) propose an algorithm to
discoveryT-Patternfrom a trajectory dataset; (3)flock detection- extracting the convergence
of people moving together for a certain amount of time (DODGEet al., 2008; GIANNOTTI;
PEDRESCHI, 2008; WACHOWICZ et al., 2011). From the analytics frameworks and data
mining algorithms, software tools have been developed to encompass state-of-the-arts algorithms to deal with mobility data and to develop new algorithms with a core framework for testing and validating the results (TRASARTIet al., 2010). These previous techniques are mainly based on
the geometric properties of trajectories thus trying to extract similarities or common behavior from the spatio-temporal dimension of the data. However, the semantic information is still missing and it is an important feature to be considering in this scope. This is the reason why a new research trend is growing to exploit these semantic rich information.
2.1.2 Networks
Besides the methods previously presented, some interesting works have envisioned how the objects interact with each other at a global scale. This perspective is usually associated to the paradigm ofcomplex networks. The study of networks, or Network Science, is broadly
interdisciplinary and important developments have occurred in many fields, including mathema-tics, physics, computer and information sciences, biology, and the social sciences (NEWMAN, 2010) and have been receiving increasing attention by the scientific community, also due to the availability of massive network data from diverse domains, and the outbreak of novel analytical paradigms, which pose relations and links among entities, or people, at the center of investigation.
Networks are usually modeled as a graph G = (V,E), where the set of nodes V represent the involved entities and the set of edges E stand for any relationship between the
of notes are connected via more than one type of connection, such as living organisms, human society and transportation system and critical infrastructure (BERLINGERIOet al., 2011b; LEE et al., 2015) (see Figure 3).
(a) (b)
Figura 3 – Two multiplex/multidimensional networks illustations: (a) network of nine nodes with two layers, the red (solid) and the blue (dashed) layer from (LEEet al., 2015); (b) two
social networks with different types of links between the users from (BERLINGERIO
et al., 2011b).
Inspired by real-world scenarios such as social networks (AIELLO et al., 2000;
CASTRO; GROSSMAN, 1999), technology networks (ADAMICet al., 2001), the World Wide
Web (LESKOVECet al., 2010; DONATO, 2010), biological networks (JEONGet al., 2001;
JEONGet al., 2000), and human movement (GONZÁLEZet al., 2008),(WANGet al., 2009)
the last few years have seen a wide, multidisciplinary, and extensive research devoted to the extraction of non-trivial knowledge from such networks. Predicting future links among the actors of a network (NOWELL; KLEINBERG, 2003; BRINGMANN et al., 2010), detecting
and studying the diffusion of information among them (GOMEZ-RODRIGUEZ et al., 2010;
YANG; LESKOVEC, 2010), mining frequent patterns of users’ behaviors ((BENEVENUTOet al., 2009; YAN; HAN, 2002; COOKet al., 2010)), are only a few examples of problems studied
in Complex Network Analysis. In this way, interesting researches are focused on the interplay between complex network and mobility data. A typical example is the study of spreading of cell phone viruses thru GSM phone calls (WANGet al., 2009; BARABÁSI; ALBERT, 1999).
Besides of statistical analytics of the network as a whole, how densely connected nodes form groups is another important field in complex networks. These groups are calledcommunities.
Community discovery in complex networks is a topic that is gaining more and more interest in the literature (COSCIAet al., 2011; NARASIMHAMURTHYet al., 2010; SOUAM et al., 2013; B.et al., 2010; LOE; JENSEN, 2015; Zhana Kuncheva; Giovanni Montana, 2015).
Although a few measures of the quality of the results have been proposed so far (among which, the modularity), their definitions are still questionable (the modularity, for example, has a well known problem of resolution, and approaches that try to maximize it tend to create very large communities). A classification of community discovery methods is proposed in (COSCIAet al.,
2011). The authors classify the methods based on the different definitions of communities in the literature. Communities may involve several features likeoverlapping,weightedand/ordirected links, anddynamics. Figure 6 illustrates two networks with the corresponding communities
found using different methods.
Consequently, some works have taken advantage of community discovery techniques to understand mobility data. In (El Mahrsi; ROSSI, 2012), the authors propose a methodology to cluster trajectories by building a network of trajectories, where the links represent the similarity between two trajectories considering some constraints. Then, they apply a community algorithm based on modularity optimization in order to discover groups of trajectories that behaved similarly and that moved along the same portions of the road network.
The authors in (BROWNet al., 2012) propose an approach to extract place-focused
communities from social graphs by annotating the edges with check-in information from location-based social network like Foursquare (thru users’ check-ins) to show the possibility to extract groups of friends who meet face-to-face for benefiting on-line social services. The authors propose a collection of co-location measures to evaluate the effectiveness of the approach. The main results suggest that the approach can find place-focused groups where users are often co-located. Yet, in (BROWN et al., 2013) an interesting study over social and
place-focused communities is presented. The authors investigate the evolution of tie structure within communities, concluding that the time period over which location data are aggregated has a substantial impact on stability of place-focused communities (communities of users that visit the same places). In particular, the authors investigate communities found in co-located networks of users that checked in at the same places and the on-line social network. In conclusion, local communities may be more useful than social communities for providing friend or points of interest recommendation when geographic information is considered.
2.2 Recommender Systems
(a) (b)
Figura 4 – Example of communities found in two networks: (a) three communities found using modularity by Newmanet al. (Figure from (NEWMAN, 2006)); (b) communities
found using the link community algorithm by Ahnet al. (Figure from (AHNet al.,
2010)).
they need, making them give up from the search and, in the case of e-commerce, give up of the purchase. This problematic scenario leveraged the necessity for better strategies to help the users in finding the most relevant items to them from a huge collection of available items. This scenario led to the development of one of the most important topics in the last decade:
Recommender Systems(RS).
Recommender systems are tools to support individuals in finding items from a large number of alternatives that a system, e.g e-commerce, may offer to them. The first idea of recommendation is likely the suggestion of the most popular items for the users under the assumption that most users are fine with the popular ones. As popular items were not enough anymore, new and sophisticated recommender systems have been developed to generate personalized and novel suggestions to the users, where these suggestions are highly relevant to the user preferences. Therefore, representing the the typical behavior and preferences of the user about the items in the systems became a key task to design effective recommender systems.
The common term to represent the entities in recommender systems is item. The
items are defined according to the domain of the recommender system, for instance books, musics, movies, events, venues, foods and cities, to name a few. Indeed, recommender system is a multidisciplinary topic that can be incorporate into different applications and problems. Recommendation of movies (Netflix), music and artists (Spotify and LastFM), venues (Fours-quare), news (Yahoo News) are examples of different applications and domains implementing recommender systems as mechanism to help users in finding the most relevant items to them.
Formally, recommender system has basis in an utility function that evaluates the importance or relevance of an item for a user. Let us denoteI ={i1, . . . ,im}the set of items, andU ={u1, . . . ,un}the set of users, the utility function is usually represented by a function
R:U×I→R.
integer values (e.g. [1,5]), instead of real ones. This objective function is then used to evaluate the items for each user in order to generate a subset or a sorted list of items to the user. In the literature we find the recommendation problem treated as a prediction problem whose goal is to predict a score of the itemifor the useru.
A taxonomy of recommender systems is provided in (BURKE, 2007) that has become a classical way of distinguishing between recommender systems (RICCI et al., 2011). This
taxonomy includes: Content-basedwhere item content is used to match up against the user profile; Collaborative Filtering where ratings patterns are discovered to generate recommendations; Demographicwhose recommendations are generated taking into consideration the demographic
profile of the user, such as age, language and country;Knowledge-based, where the goal is to
measure the utility of the recommendation for user by estimating how much the user needs match the recommendations; Community-based which recommends items based on the preferences
of users friends; andHybridrecommender systems that combine other RS techniques together
using the advantages of one to fix the limitation of the other one.
In this thesis we discuss two of those classes of recommender systems that are most used: content-basedrecommender systems, where item content (e.g. movie year, actors)
is taken into consideration to represent the items and to create user profile that are matched up against the item attributes in order to measure the relevance of the item for the user as a result of the recommendation process; andcollaborative filteringrecommender systems, where
rating patterns based on the historical data of the users are analyzed over the items to generate suggestions through similarities between users or items, or they are used to learn a predictive model that is able to effectively predict or estimate the relevance of an item for the user.
2.2.1 Content-based Recommender Systems
A content-based recommender system (CBRS) has basis on the items’ content to recommend similar items to those ones that the user has already liked before. The similarity of items is calculated based on the features associated with the compared items. CBRS approaches analyze the features of the items previously rated by a user to build a profile of user interests based on the features of the items rated by that user. The recommendation processing, then, consists in matching up the attributes of the user profile against the features of the item to be recommended. The result is a relevance score/ judgment that represents the user’s level of interest in that item. The more accurate the profile is, the more effective the recommendations will be. Therefore, an important step in the content-based recommender systems is the technique used for item representation.
The items are represented by a set of features, also called attributesorproperties
(LOPSet al., 2011). In movie applications, for example, the year of the movie, actors, directors,
use keywords-based profiles. This approach is especially suitable when each item is described by the same set of attributes and the possible values for each feature is known. In the case of textual description, keywords-based profiles are not effective as item representation, since simple string matching operation can not deal withpolysemy, the presence of multiple meanings for one word,
andsynonymy, where multiples words have the same meaning (LOPSet al., 2011).
A simple and very used model for representing the items is the Vector Space Model (VSM) broadly used in Information Retrieval (IR). In particular, VSM is used to spatially represent text documents, where each document can be seen as a vector in a m-dimensional
space. Then, each dimension in the document vector corresponds to a term from the overall vocabulary of the document collection, which is weighted to indicate the degree of relevance between the document and the term. In content-based recommender system, this model can be used in such a way the items and users correspond to the documents, while the items’ features are the terms of the overall vocabulary.
Let T ={t1, . . . ,tm}be the set of terms in our vocabulary andD={d1, . . . ,dn}be the set of documents. Therefore, each documentdiis represented by itsm-dimensional vector spaced~i={w1i, . . . ,wmi}such thatwk j is the relevance of thetk for documentdj.
To evaluate how relevant a termt is to a documentk,wtk, we first need to point out important observations that help us to design the adequate weight function. As discussed in (LOPSet al., 2011; SALTON, 1989): (i) frequent terms are not necessary more relevant than
rare terms; single occurrences of a term in a document are not more important than multiple occurrences; and documents with many terms are not more suitable than documents with less terms. TF-IDF (Term Frequency-Inverse Document Frequency) was developed based on these observations regarding text being the most commonly used term weighting framework. The intuition behind TF-IDF is that terms that occur frequently in one document and are not frequently found in many other documents are more likely to be relevant to the document, while frequent items that occur in several documents are not representative for a specific document. To compute TF-IDF, we need first to compute the term frequency of a termtk in a documentdigiven by
TF(tk,di) =
fk,i maxz fz,i
,
where fk,iis the number of occurrence of termtkin the documentdi, and maxz fz,istands for the maximum occurrence of any termzin any documenti. With term frequency computed, we can
calculate TF-IDF as
wk,i=TF-IDF(tk,di) =TF(tk,di)·log
N nk,
wherenis the number of documents in the collection andnkis the number of documents that have the termtk. Analyzing the inverse term frequency componentlog
n nk
final score for TF-IDF is higher whennkis lower, and lower for largenk. This means that the term frequency of a termtk in the documentdiis penalized iftk occurs in many other documents.
Once we have computed the document vectord~i, we can rely on a similarity function
to find similar documentsdiwith respect to a given vector (e.g. user profile vector) in the same
m-dimensional space. Cosine similarity is broadly used to compute the similarity between two
vector of an inner product space to measure the cosine of the angle between them given by:
cosine(d~i, ~dj) =
~
di·d~j ||d~i|| · ||d~j||
.
Therefore, for a user profile vector~uin the same m-dimensional space, we can compute the
cosine similarity to find out documents that are relevant or similar to the user profile. The vector space model jointly with a vector-based similarity function are simple and very efficient ways for recommending items, mostly due to its simplicity and flexibility to be applied in different domains, such as music, movies, books, venues, etc.
Lopset al.in (LOPSet al., 2011) highlight that keyword-based representations for
the items and user profiles can give accurate performance, when the sufficient number of evidence of the user interests is available. However, this approach is not suitable for all applications. As previously discussed, keyword-based methods have some problems regarding polysemyand synonymy, what can lead to inaccurate results by the recommender system. To deal with this
problem, an ontology-based representation might be used to integrate the recommender system with external knowledge bases to provide more semantic in the user profiles.
The Space Vector Model can then be used as a framework for the content-based recommender system. In the case of CBRS, the documents are the items and users, while the terms are the features associated with the items. In this way, we represent items and users as feature vectors in such a way similar items to the user profile can be found as recommendations to the user.
The content-based recommender systems have the advantage of: (i)User Indepen-dence, since the RS exploits the ratings provided by the user to build her own profile, and it does
not need to compute the other users ratings as done in collaborative approaches; (ii) explaining how the recommender system works can be provided by explicitly listing the item features that caused the recommendation of that item -Transparency; (iii) overcoming the new item problem
(item not rated by any user), once the item features can be match up against the user profile even when no user has rated that item.
have the drawback of over specialization, where only items similar to those items previously rated by the user will be recommended, thus it does not favor for serendipity recommendations (unexpected recommendations); (iii) new users do not have enough ratings or feedbacks to create their profile, thus the system will not be able to provide reliable recommendations.
Not all of the item contents are available, which forces us to design different recom-mendation techniques from the content-based ones. In particular, when the ratings of users are present in the system, these can be used to discover patterns to support the recommendations of the items. These patterns may indicate users having similar preferences or behaviors and thus items of one could be used as a recommendation to the other; or they may be used to learn model that are capable of assisting the recommendations. In the next section we discuss the recommen-dation systems based collaborative filtering which uses the patterns on the recommenrecommen-dations of the items.
2.2.2 Collaborative Filtering Recommender Systems
This class of recommender systems relies on past user behavior to analyze rela-tionships between users according to their interests in the items to find out new user-item associations corresponding to the recommendations to the users. The termcollaborative filtering
was devised by the developers of Tapestry, the first collaborative filtering recommender system (KORENet al., 2009a). This approach is an alternative to content-based methods when item
contents are not available, and the user past behaviors (e.g. ratings, interactions with the system) can be taken into account to generate the recommendations. User past behavior is can be seen as
feedbacksof the users that represent important information to boost the recommender systems: explicit feedbacksare associated with the explicit interest of the user about certain items usually
given in the form of ratings (stars, like, dislike); andimplicit feedbacksare indirect representation
of the interests of the user by observing past behaviors such as the interaction of the user with the RS, browsing history and purchase, for instance.
The collaborative filtering recommender systems are mainly divided into two areas:
neighborhood-based andmodel-based collaborative filtering techniques. In the
neighborhood-based CF algorithms, similar users to the active user are identified to find out relevant items from these similar users. In the model-based CF algorithms, on the other hand, the ratings are used to learn a predictive model to produce recommendations for new items. In the following we discuss with more details each of these approaches.
2.2.2.1 Neighborhood-based Collaborative Filtering
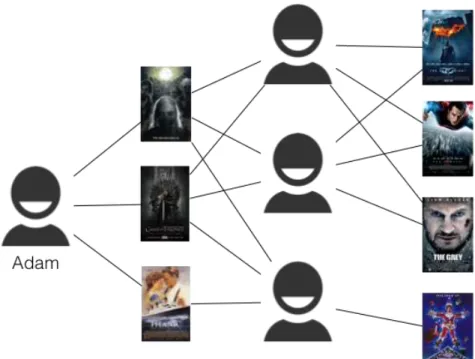
Neighborhood-based methods, known also asknearest neighbors (kNN), are inspired
the opinion of like-minded people or other trusted sources to evaluate the value of an item (movie,
book, articles, album, etc.) according to his own preferences”. Let us consider the example
illustrated in Figure 5. Adam has enjoyed three movies that were also enjoyed by other users. These in turn experienced other films that might be interesting to Adam. Therefore, the system might identify these users to somehow recommend the items.
Based on this observation, neighborhood-based techniques exploit the user-item ratings stored in the system to device groups of users, calledneighbors, for the active user that
have similar preferences in order to predict ratings for the new items. The neighborhood-based methods are approached in two ways: user-basedoritem-basedrecommendations. In user-based
systems, the interest of a user ufor a given item i is evaluated by the other users ratings for
this item, the neighbors, that have similar rating patterns (DESROSIERS; KARYPIS, 2011). Item-based approaches (LEMIRE; MACLACHLAN, 2007), on the other hand, evaluate the relevance of an itemito a userubased on the ratings ofufor items similar toi. In this case, two
items are similar if users of the system tend to similarly rate them.
Letru,ibe the rating of userufor itemi. The general framework for neighborhood-based methods consists of finding similar users by accomplishing a similarity computation between users (user-based) or items (item-based). The objective of this process is to find out the neighbors of each user in order to recommend items from a group of users with similar taste (user-based), and items that are similarly rated by the same set of users for a given item (item-based). Then, the ratings of the group for the item are somehow aggregated as a prediction score of the item. When the task is to generate a top-N recommendation, it is needed to select
the kmost similar users or items based on the similarity computation, and then aggregate the
neighbors to get the top-N most relevant or scored items as the recommendation or prediction
computation (SU; KHOSHGOFTAAR, 2009). Each step is discussed as follows.
Similarity Computation. In the case of user-based, given two users u and v, we need to
compute the similarity between these two users according to their rating patterns. A common way to accomplish it is to compute thePearson correlationbetween the two users, but other
correlation-based similarities can also be used (e.g. Spearman rank correlation), as well as vector cosine-based similarity.
LetIu,v⊆I is the item set summarizing the items that both the usersuandvhave rated, and ¯ru,r¯uare the average rating for the co-rated items inI of the useruandv, respectively. Considering the Pearson correlation as our measure, the similarity between two usersuandvis
given by
wu,v=
∑i∈Iu,v(ru,i−r¯u)(rv,i−r¯v)
q
∑i∈Iu,v(ru,i−r¯u)
2q∑
i∈Iu,v(rv,i−r¯v)
2, (2.1)
For item-based, we need to compute the similarity between two itemsiand jthat were rated