Urban Development in Ariyalur District, Using Remote Sensing
and Geographical Information System (Gis)
1
R.Vasanthi ,
1R. Baskaran, and
2G.Vanaraju.
1 Department of Industries and Earth sciences, Tamil University, Thanjavur – 613010, TamilNadu, India 2 Department of Geology, School of Geosciences, Bharathidasan University, Tiruchirappalli – 620024, Tamil Nadu, India
Abstract
The study is mainly based on visual interpretation of satellite imageries by studying the standard recognition elements such as color, tone, texture, Pattern etc., for the delineation of urban land use of the study area. After the visual interpretation of Satellite imageries direct field checks have been made. The primary data were acquired from the LANDSAT satellite imagery. The supplementary data were generated from the survey of India SOI topographical maps. A base map was prepared using survey of India toposheets having the index of numbers, 58M/4, 7, 8, 11, 12 and 58N/1 on a scale of 1:50,000 as an understanding of this study. Totally 6 toposheets have covered the study area. The geographical features like major road, railway, and drainage system, and elevation information, nature of River, tank, settlements and relevant information were incorporated in the base map. Arc GIS used to integrate the available data sources. LANDSAT MSS (1976), IRS P6-LISS III (2010) satellite data the urban land use classification were attempted. The classification followed here is based on unsupervised classification and interpretation; the data interpreted from the imagery were cross-checked in the field. The change detection in urban land use, between the years 1976, 2010 and for an overall period of 34 years, was made using statistical methods. The entire study area has been many changes in the urban land use. There has been a pronounced decrease in agriculture land, forest land, Fallow land, sandy area are gradually decreased. Water bodies, Residential area, industrial, mining area, road, and water bodies and barren land are increased. The town wise urban land use has been analyzed in this thesis. Finally the total Ariyalur district urban land use studies have been analyzed.
I.
INTRODUCTION
Urbanization is an integral part of economic development. As the economy develops, there is an increase in the per capita income and also in the demand for non-farm goods in the economy. These goods are not heavily land-dependent and use more of other factors of production, especially labour and capital. They are cheaper if produced in the urban sector of the economy, since urban settlements enjoy economies of agglomeration in manufacturing, services and provision of infrastructure. Economic growth influences the rate of urbanization, while urbanization in turn, affects the rate at which the economy grows. As the country urbanizes, the share of national income that originates in the urban sector also increases.
It is an index of transformation from traditional rural economies to modern industrial one. It is progressive concentration (Davis, 1965) of population in urban unit. Quantification of urbanization is very difficult. It is a long term process. Kingsley Davis has explained urbanization as process (Davis, 1962) of switch from spread out pattern of human settlements to one of concentration
in urban centers. It is a finite process, a cycle through which a nation passes as they evolve from agrarian to industrial society (Davis and Golden, 1954). He has mentioned three stages in the process of urbanization. Stage one is the initial stage characterized by rural traditional society with predominance in agriculture and dispersed pattern of settlements. Stage two refers to acceleration stage where basic restructuring of the economy and investments in social overhead capitals including transportation, communication take place. Proportion of urban population gradually increases from 25% to 40%, 50%, 60% and so on. Dependence on primary sector gradually dwindles. Third stage is known as terminal stage where urban population exceeds 70% or more. At this stage level of urbanization (Davis, 1965) remains more or less same or constant. Rate of growth of urban population and total population becomes same at this terminal stage.
II.
LOACTION OF THE STUDY
AREA
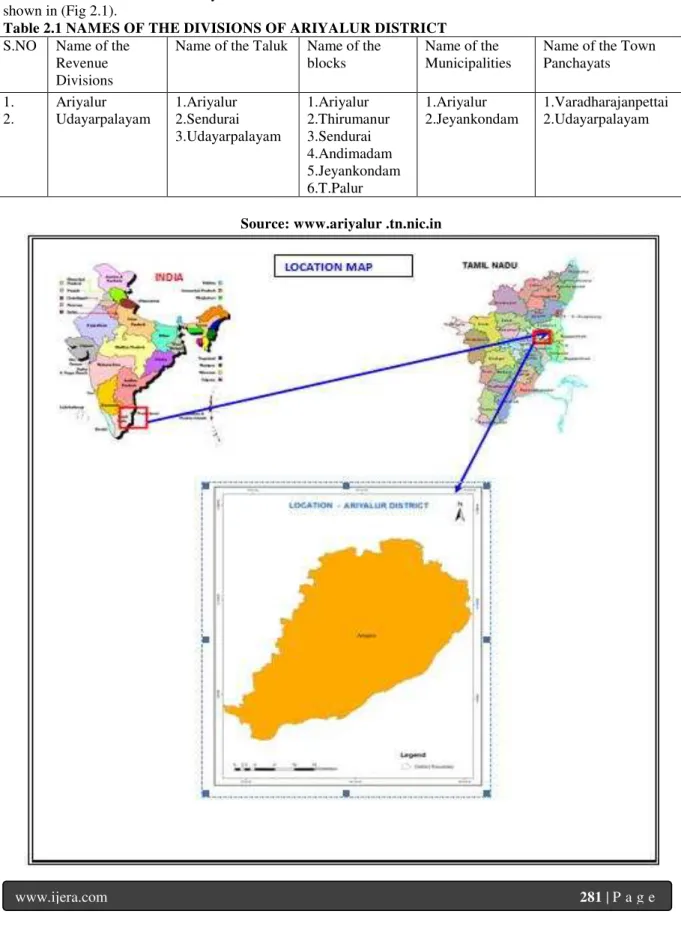
10o.50’0”N to 110.30’0” of the Northern Latitude and 790.0’0” and 790.30’0” of the Eastern Longitude. It extends to an area of 1961 sq.km. The district is bound on the North by Cuddalore districts, South by Thanjavur districts, East by Cuddalore and Thanjavur districts and West by Perambalur and Tiruchirapalli district. The location of the study areas have been shown in (Fig 2.1).
Ariyalur district consist of 2 Revenue Divisions and contains 3 Taluks and 6 Blocks as detailed below in Table 2.1 and Fig
Table 2.1 NAMES OF THE DIVISIONS OF ARIYALUR DISTRICT S.NO Name of the
Revenue Divisions
Name of the Taluk Name of the blocks
Name of the Municipalities
Name of the Town Panchayats
1. 2.
Ariyalur Udayarpalayam
1.Ariyalur 2.Sendurai 3.Udayarpalayam
1.Ariyalur 2.Thirumanur 3.Sendurai 4.Andimadam 5.Jeyankondam 6.T.Palur
1.Ariyalur 2.Jeyankondam
1.Varadharajanpettai 2.Udayarpalayam
Fig2.1
Fig 2.2 The above table illustrates two Revenue divisions such as Ariyalur and Udayarpalayam in Ariyalur District .15 Firkas,195 Revenue villages, 2Municipalities, 2 Town panchayats and 201 village panchayats come under this district.
Besides, three assembly constituencies come under Ariyalur District.I n the district most of the villages depend upon agriculture sector. In this regard the following table shows thus the block wise geographical area of Ariyalur district. (Table 2.2).
TABLE 2.2 BLOCKWISE GEOGRAPHICAL AREA OF ARIYALUR DISTRICT
S.NO Block Area (In Ha)
1 2 3 4 5 6
Andimadam Jeyankondam T.Palur Ariyalur Sendurai Thirumanur Total
28943.000 (15) 34381.000 (17.7) 31745.370 (16) 33481.875 (17) 31482.400 (16.3) 34964.505 (18) 194998.16 (100)
Source: “G” Return, District Statistical Office, Ariyalur.
Note: Parentheses indicate the percent of total value. The above table points out that the highest (18 percent) geographical area is Thirumanur Block
Ariyalur District. The main Reason for this is that the Kollidam River is flowing in this area. The second largest geographical area in the district is Jeyankondam block. Only 15 percent of the geographical area comes under the Andimadam Block.
III.
METHODOLGY
The study is to understand the state of the present, past and future urban land use in Ariyalur district. The methodology adopted here is based on a hybrid approach of visual and digital techniques and analysis with GIS. The study is mainly based on the five sets of satellite imageries taken, comparison of the urban land use and urban development changes and change detection of the details and future trend, approach and involving an analysis of the remotely sensed data and validation by ground truth verification . In the following few pages various stages of methods adopted in this research work have been given.
The urban land use and urban development studies involve mapping of different types of urban
development features from the satellite imagery. The overall methodology adopted for the preparation of urban land use, growth and development map and change analysis is shown with the help of a flow chart. Digital image processing techniques have been used for preparation of urban land use and urban development map from the multi-data satellite data. The NRSA classification system has been adopted ERDAS IMAGINE image processing software and its GIS analysis capabilities (VECTOR module) have been used for the preparation of multi- temporal data urban land use, growth and development maps.
IV.
POPULATION
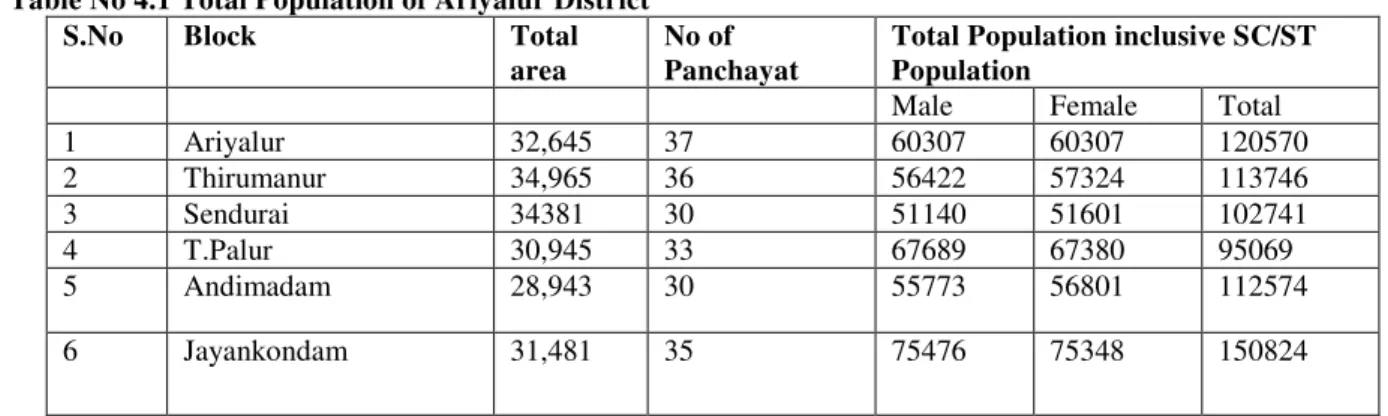
As of the 2001 India census constitute 51% of the population and females 49%. Ariyalur has an average literacy rate of 73%, higher than the national average of 59.5%; with 55% of the males and 45% of females literate. 12% of the population is under 6 years of age. It is the smallest district in Tamil Nadu. Cement manufacture is one of the features of this town. The population data shown in Table (4.1) and maps shown in Fig 4.1
Table No 4.1 Total Population of Ariyalur District
S.No Block Total
area
No of Panchayat
Total Population inclusive SC/ST Population
Male Female Total
1 Ariyalur 32,645 37 60307 60307 120570
2 Thirumanur 34,965 36 56422 57324 113746
3 Sendurai 34381 30 51140 51601 102741
4 T.Palur 30,945 33 67689 67380 95069
5 Andimadam 28,943 30 55773 56801 112574
6 Jayankondam 31,481 35 75476 75348 150824
The population of the Ariyalur district contain six taluk ariyalur(32645), Thirumanur(34965), Sendurai(34381), T.Palur(30945), Andimadam(28943) and Jayankondam (31481) of the total in 2001 census. Among the Taluk of the Ariyalur District Jayankondam is high ration of the population. The SC/ST Population, Literate/Illiterate Population,
Fig 4.1
V.
IMAGE ANALYSIS
5.1 URBAN LAND USE LAND COVER URBAN LAND USE AND LAND COVER 1976
The urban development with land use aspects in 1976, showing table No 5.1 the given the sq.km of the Land use and land cover of the study area. The Residential area 5.53 sq.km( 0.28%), Commercial 0.12 sq.km(0.006%), villages 62.34 sq.km(3.17%), Agricultural area 1112.41 sq.km(56.71%), Fallow land 125.79 sq.km(6.41), Forest land 369.97sq.km(18.86%), water bodies
31.52sq.km(1.60%), Barren land
176.72sq.km(9.51%), sandy area
46.09sq.km(2.49%). Industrial 5.32 sq.km (0.27%), road 19.83 sq.km(1.01%), mining area 5.77sq.km(0.29%). In 1976 year the only the agricultural activities dominated In the land use classes, secondly the forest land are cover in high. The total area of the ariyalur in 1961.45 sq.km of net sown area.
Table No 5.1 Urban Land use and Land cover 1976
S.no CLASSES
AREA SQ.KM
AREA %
1 RESIDENTIAL 5.53 0.28
2 COMMERCIAL 0.12 0.006
3 VILLAGES 62.34 3.17
4 AGRICULTURE 112.41 56.71
5
FALLOW
LAND 125.79 6.41
6 FOREST LAND 369.97 18.86
7
WATER
BODIES 31.52 1.6
8 BARREN LAND 176.72 9
9 SANDY AREA 46.09 2.34
10 INDUSTRIAL 5.32 0.27
11 ROAD 19.83 1.01
12 MINING 5.77 0.29
TOTAL 1961.45 100
Dig. No 5.1 Urban Land use and Land cover 1976
The visual interpretation of the Urban Land use of the Ariyalur, the Fig No.5.1showing details various urban activities in the study area. Residential use from the four urban zone like Ariyalur,
Jayankondam, Udaiyarpalayam and
Varatharajanpettai, seen in the map brown tone. The intial stage of the new residential area of the towns in Ariyalur district. Transportation line interconnected nearby towns. The commercial activities parallel to the roads and residential areas. The commercial area
seen in the yellow tone. The main commercial zone identify at Ariyalur and jayankondam towns. The mining activities with waste along the Industrial area seen in the red tone in the map. It is distributed N-W , N-E of the study area. The forest land is occupied along the river course and mean centre of the district. The thirumanur, T.Palur and Ariyalur are occupied forest land area. Water bodies like river and tank were appeared in blue tone and seen randomly distributed in the District.
0 500 1000 1500 2000 2500
RE
SIDE
N
T
IAL
COMME
RC
IAL
VILL
AG
E
S
AG
RICU
LT
U
RE
FALLOW
L
AN
D
FO
REST
L
AND
WAT
E
R BODIE
S
BAR
RE
N
LAN
D
SANDY ARE
A
IN
DU
ST
RIAL
ROAD
MIN
IN
G
T
OT
AL
1 2 3 4 5 6 7 8 9 10 11 12
AREA SQ.KM
Fig 5.1 URBAN LAND USE AND LAND COVER 2010
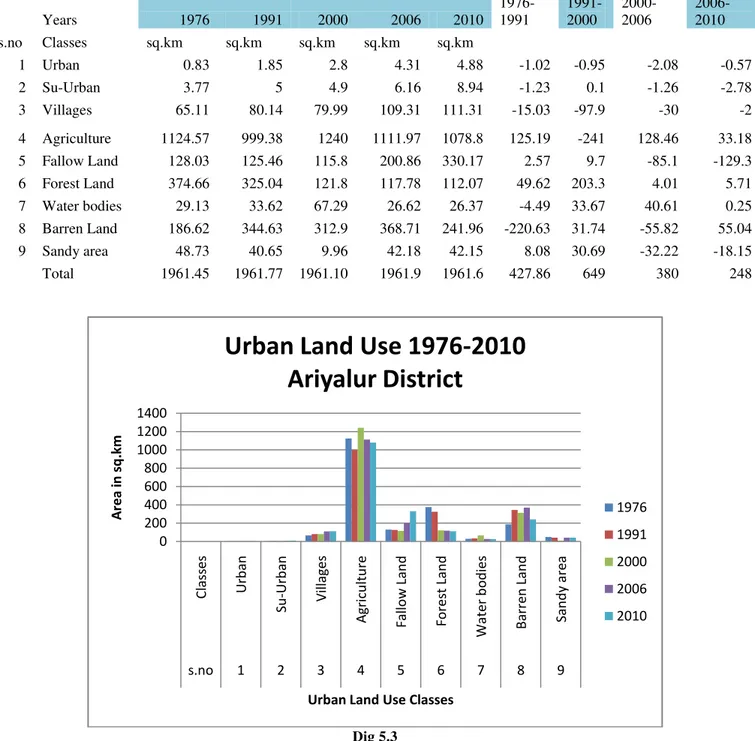
The urban development with land use aspects in 2010, showing table No 5.2 the given the sq.km of the Land use and land cover of the study area. The residential area10.47 sq.km(0.53%), commercial1.04 sq.km(0.05%),villages 107.53
sq.km(5.48%), Agricultural area
1061.44sq.km(54.11%), Fallow land 325.81sq.km(16.61%), Forest land 109.96sq.km(5.6%), water bodies26.23 sq.km(1.33%), Barren land 219.13sq.km(11.17%), sandy area 42.10sq.km(2.14%) ,industrial 17.01sq.km(0.86%), road 32.98sq.km(0.86%),mining 17.01sq.km(0.86%). In 2010 year the only the agricultural activities dominated in the land use classes, secondly the forest land are cover in high. The total area of the ariyalur in 1961.45 sq.km of net sown area.
Table No 5.2 Urban Land use and Land cover 2010
S.no CLASSES
AREA SQ.KM
AREA %
1 RESIDENTIAL 10.47 0.53
2 COMMERCIAL 1.04 0.05
3 VILLAGES 107.53 5.48
4 AGRICULTURE 1061.44 54.11
5 FALLOW LAND 325.81 16.61
6 FOREST LAND 109.96 5.6
7
WATER
BODIES 26.23 1.33
8 BARREN LAND 219.13 11.17
9 SANDY AREA 42.1 2.14
10 INDUSTRIAL 7.73 0.39
11 ROAD 32.98 1.68
12 MINING 17.01 0.86
TOTAL 1961.45 100
The Dig No 5.2 showing the land use classes Agricultural, Fallow land and barren land are only major land use classes. The other villages, Forest land and sandy area are slightly covered in the ariyalur district.
Table No 5.2 Urban Land use and Land cover 2010
The visual interpretation of the Urban Land use of the Ariyalur, the Fig No.5.2 showing details various urban activities in the study area. The agricultural land use was rapidly decreased and it was converted as residential use from the four urban zones like Ariyalur, Jayankondam, Udaiyarpalayam and Varatharajanpettai, seen in the map brown tone. The occupied of the new residential area of the towns in Ariyalur district due to the transportation line interconnected near by towns. The commercial activities parallel to the roads and residential areas. The commercial area seen in the yellow tone. The
main commercial zone identify at Ariyalur and jayankondam towns with increased due the overpopulation concentrated in the study area. The mining activities with waste along the Industrial area seen in the red tone in the map. It is distributed N-W , N-E of the study area.The most of the fallow lands are converted from the agricultural land area and some of the fallow land seen along the river course with blocks like Ariyalur, T.Palur sendurai and jayankondam. The forest land are decreased gradually along the river course and mean centre of the district. Water bodies like river and tank were 0 200 400 600 800 1000 1200 A re a in sq .km
Urban Land Use
Urban Land Use 2010,
Ariyalur District
2010 sq.km
appeared in blue tone and seen randomly distributed in the District.
Fig 5.2 5.2 URBAN AREA CHANGE DETECTION OF THE ARIYALUR
Recording land cover change over time is perhaps one of the most important of digital remote sensing data. For example, the conversion of non-built up area to non-built up area, conversion of rural to urban land cover can be detected using a temporal comparison of spatial change determined from satellite or airborne data. The value of utilizing remote sensing data for change detection studies is limited only by the imagination of the investigators and potential users.Irshad Husain.M and
Siddiq.A(1982) refer to the urban encroachment is acquisition and occupation of lands for the expansion of existing urban function of town limited in shananampur city, in which agricultural rural land has been used for non-agricultural purpose viz, installation of factories, building of public utility, play grounds, residential accommodation, and so on; extension of the town limit does take place as a result of encroachment. The urban Land use studies of the Ariyalur District were described change detection since 1971-2010.(Plate.3,4)
Plate- 4 Residential use of Ariylaur Town
OVERLAY OF BUILT UP LAND CHANGE DETECTION IN ARIYALUR DISTRICT1976-2010
The visual Interpretation of the satellite imagery, urban Land use classes, the residential zone well developed in the Ariyalur District. The red tone indicate urban development of 1976 and yellow tone indicate 2010 year urban development.(Fig No.5.3) From the Ariyalur Distrcit, have four urban zones like Ariyalur, Jayankondam, Udaiyarpalayam and Varatharajanpettai etc. The residential development were in high ratio of 2010 compare to 1976, 1991 , 2000, 2006 years. The Ariyalur town have high concentration of the population and as well as
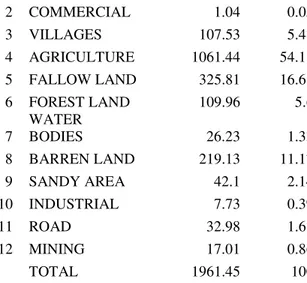
Fig 5.3 URBAN LAND USE CHANGE DETECTION PERCENTAGE WISE 1976-2010 YEARS
Land use and Land cover studies were analyzed in various classes with in the Ariyalur District. The district have four urban zone like Ariyalur, Jayankondan, Udaiyarpalayam and Varatharajanpettai etc. From the urban centre Ariyalur town have potential population growth compare to others. In the year 1976-2010 there was no rapid changes of the urban and sub-urban was gradually changed. The 1976 0.83 sq.km and 1991 1.85 sq.km are gradually changed. In overall percentage wise 1.02 were changed. The agricultural
Table No.5.3 Urban Land Use Change Detection in Percentage wise
Years 1976 1991 2000 2006 2010
1976-1991 1991-2000 2000-2006 2006-2010
s.no Classes sq.km sq.km sq.km sq.km sq.km
1 Urban 0.83 1.85 2.8 4.31 4.88 -1.02 -0.95 -2.08 -0.57
2 Su-Urban 3.77 5 4.9 6.16 8.94 -1.23 0.1 -1.26 -2.78
3 Villages 65.11 80.14 79.99 109.31 111.31 -15.03 -97.9 -30 -2
4 Agriculture 1124.57 999.38 1240 1111.97 1078.8 125.19 -241 128.46 33.18 5 Fallow Land 128.03 125.46 115.8 200.86 330.17 2.57 9.7 -85.1 -129.3 6 Forest Land 374.66 325.04 121.8 117.78 112.07 49.62 203.3 4.01 5.71 7 Water bodies 29.13 33.62 67.29 26.62 26.37 -4.49 33.67 40.61 0.25 8 Barren Land 186.62 344.63 312.9 368.71 241.96 -220.63 31.74 -55.82 55.04
9 Sandy area 48.73 40.65 9.96 42.18 42.15 8.08 30.69 -32.22 -18.15
Total 1961.45 1961.77 1961.10 1961.9 1961.6 427.86 649 380 248
Dig 5.3
VI.
Summary and Conclusion
Urban Land use is a subset of urban form. Thus, indicators of urban form can aid in describing the characteristics of land use. Detailed information on urban land use is essential from the perspective of urban management and planning. As urban life has expanded the form which the cities have acquired are not only based on its spatial form but also its social form
The growth of an urban centre also leads to changes in infrastructure which in turn further effects regional development, industrialization,
transportation linkages, population distribution and the entire rural-urban continuum. At the same time, the dynamics of economics, population growth, increases employment. In the tertiary sector and the continuation of these processes over a long period of time and over an increasing dimension of space are signs of regional development.
Finding of the study: The following are the major findings of the present study.
(1) Ariyalur was originally a dry point settlement. It can be generalized with reference to the original location of the hamlet very near to the tank. 0 200 400 600 800 1000 1200 1400 Cl ass e s U rb an Su -U rb an Vi ll ages Agri cu ltu re Fal low L an d Fores t La n d Wa ter b o d ie s Barren La n d San d y ar e a
s.no 1 2 3 4 5 6 7 8 9
A re a in sq .km
Urban Land Use Classes
Later the expansion of the city took place towards elevated dry land. Thus at present, it is a dry point settlement surrounded by an irrigated tract.
(2) The ariyalur urban centers, which were only a tiny villages
(3) Rapid urbanization took place after the district status; it is also evident that the establishment of various cement industries has given impetus to growth of the city.
(4) The Ariyalur district is conveniently located in between the largest cities of Tamilnadu viz, Tiruchirappalli and Thanjauvr.
(5) During 1976-2010, the urban spread of Ariyalur district was chiefly characterized by the transport facilities.
(6) During 1976-2010 expansion took place due to inclusion of five villages within corporation limit.
(7) Ariyalur urban towns have developed in three distinctive phases over a long period of time stretching from prehistory up to 1990.
(8) An analysis of the map representing the spatial expansion of the city revealed three distinct stages of villages, town and city. It occupied an area of 1966.45 sqkm in 1976 which decreased to 2010 and 1956.7sqkm and the urban area of 0.83 sq.km in 1976 and increased in 4.88sq.km, expanded in an east-west direction. In the initial stage, Ariyalur was a grid pattern settlement, later it changed into a linear pattern as found at present.
(9) An analysis of land value shows that the rate of increase (2006-2010) is higher in the commercial and business area, fairly or moderately increasing in the residential area, and gradually increasing in the residential area as well as in the periphery of the city.
(10)Ariyalur is a center of cement industry which is attracting many buyers and sellers form the surrounding region. The surrounding region in its turn provides the city with the articles of daily uses.
(11)An analysis or functional zones reveals the internal structure of the city in terms of different land uses and inter-related aspects of urban morphology. Different city, spatial pattern of functional zones and their morphological variations are caused by the spatial expansion of the city.
(12)Ariyalur is a center of cement industry which is attracting many buyers and sellers form the surrounding region. The surrounding region in its turn provides the city with the articles of daily uses.
(13)An analysis or functional zones reveals the internal structure of the city in terms of different
land uses and inter-related aspects of urban morphology. Different city, spatial pattern of functional zones and their morphological variations are caused by the spatial expansion of the city.
REFERENCES
[1] Davis (1965): The Suburbs of Greater Bombay, Centre For Urban Research, Osmania University,Hyderabad
[2] Davis (1962): Geography of Population: The Indian Experience, New Delhi, Oxford University press.
[3] Golden (1962) “Sydney’s metropolitan
fringe: A case study in rural urban relations”