Using MALDI-TOF-MS
Raquel Branquinho1, Clara Sousa1,2, Joa˜o Lopes3,4, Manuela E. Pintado5, Luı´sa V. Peixe1, Hugo Oso´rio6,7*
1REQUIMTE, Laborato´rio de Microbiologia, Departamento de Cieˆncias Biolo´gicas, Faculdade de Farma´cia, Universidade do Porto, Porto, Portugal,2CEB, Centro de Engenharia Biolo´gica, Universidade do Minho, Braga, Portugal,3REQUIMTE, Laborato´rio de Quı´mica Aplicada, Departamento de Cieˆncias Quı´micas, Faculdade de Farma´cia, Universidade do Porto, Porto, Portugal,4CBQF, Centro de Biotecnologia e Quı´mica Fina, Escola Superior de Biotecnologia, Universidade Cato´lica Portuguesa, Porto, Portugal,5Departmento de Tecnologia Farmaceˆutica, Faculdade Farma´cia, Universidade de Lisboa, Lisboa, Portugal, 6IPATIMUP, Instituto de Patologia e Imunologia Molecular da Universidade do Porto, Porto, Portugal,7Faculdade de Medicina, Universidade do Porto, Porto, Portugal
Abstract
Matrix-assisted laser desorption/ionization time-of-flight mass spectrometry (MALDI-TOF-MS) despite being increasingly used as a method for microbial identification, still present limitations in which concerns the differentiation of closely related species.Bacillus pumillusandBacillus safensis,are species of biotechnological and pharmaceutical significance, difficult to differentiate by conventional methodologies. In this study, using a well-characterized collection ofB. pumillusandB. safensis isolates, we demonstrated the suitability of MALDI-TOF-MS combined with chemometrics to accurately and rapidly identify them. Moreover, characteristic species-specific ion masses were tentatively assigned, using UniProtKB/Swiss-Prot and UniProtKB/TrEMBL databases and primary literature. Delineation ofB. pumilus(ions atm/z5271 and 6122) andB. safensis (ions atm/z5288, 5568 and 6413) species were supported by a congruent characteristic protein pattern. Moreover, using a chemometric approach, the score plot created by partial least square discriminant analysis (PLSDA) of mass spectra demonstrated the presence of two individualized clusters, each one enclosing isolates belonging to a species-specific spectral group. The generated pool of species-specific proteins comprised mostly ribosomal and SASPs proteins. Therefore, inB. pumilusthe specific ion atm/z5271 was associated with a small acid-soluble spore protein (SASP O) or with 50S protein L35, whereas inB. safensisspecific ions atm/z5288 and 5568 were associated with SASP J and P, respectively, and an ion at m/z6413 with 50S protein L32. Thus, the resulting unique protein profile combined with chemometric analysis, proved to be valuable tools forB. pumilusandB. safensisdiscrimination, allowing their reliable, reproducible and rapid identification.
Citation:Branquinho R, Sousa C, Lopes J, Pintado ME, Peixe LV, et al. (2014) Differentiation ofBacillus pumilusandBacillus safensisUsing MALDI-TOF-MS. PLoS ONE 9(10): e110127. doi:10.1371/journal.pone.0110127
Editor:Mickae¨l Desvaux, INRA Clermont-Ferrand Research Center, France
ReceivedApril 17, 2014;AcceptedSeptember 17, 2014;PublishedOctober 14, 2014
Copyright:ß2014 Branquinho et al. This is an open-access article distributed under the terms of the Creative Commons Attribution License, which permits unrestricted use, distribution, and reproduction in any medium, provided the original author and source are credited.
Data Availability:The authors confirm that all data underlying the findings are fully available without restriction. All relevant data are within the paper and its Supporting Information files.
Funding:Dr. Kasthuri Venkateswaran, Dr. Ire`ne Ouoba, Dr. Joseph W. Kloepper, Dr. Cecilie From and Dr. Maria Morea are gratefully acknowledged for providing isolates FO-36bT, SAFN-027, SAFN-037, KL-052, 51-3C and 82-2C; Bs31; SE 49 (AP3) and SE 52 (AP7); FEL 55, UNG22 and MIL46, respectively. Raquel Branquinho was supported by a PhD fellowship (Ref. SFRH/BD/61410/2009) and Clara Sousa by a post-doctoral fellowship (Ref. SFRH/BPD/70548/2010), from FCT (Fundac¸a˜o para a Cieˆncia e Tecnologia, Portugal). Hugo Oso´rio acknowledges the funding from QREN-FEDER through the Operational Program ON. 2 – O Novo Norte. IPATIMUP is an Associate Laboratory of the Portuguese Ministry of Science, Technology and Higher Education and is partially supported by the Portuguese Foundation for Science and Technology. The funders had no role in study design, data collection and analysis, decision to publish, or preparation of the manuscript.
Competing Interests:The authors have declared that no competing interests exist. * Email: [email protected]
Introduction
Bacillus pumilusandBacillus safensisrepresent one of the most significant and widespread terrestrial species within theBacillus pumilusgroup [1,2,3,4,5]. A wide range of biotechnological and pharmaceutical applications has been attributed to these species, including human and animal probiotics [6] or phytosanitary-based products [7]. Moreover, they are important contaminant agents found in industrial settings, namely in food and/or pharmaceutical facilities, posing a serious problem to the quality assurance of these industrial segments [2,4]. More rarely,B. pumilus isolates have also been involved in foodborne poisoning [8,9] and in human infections including anthrax-like cutaneous lesions [10,11,12,13].
Studying a collection of previously identifiedB. pumilusisolates we have realized the difficulty to their differentiation from closely related species based on phenotypic and biochemical
character-istics and on 16S rRNA gene sequences [4]. Sequencing housekeeping genes, such as gyrB (b-subunit of DNA gyrase) andrpoB(b-subunit of RNA polymerase) has proven to be useful for taxonomic resolution of closely related species, including
Bacillus species. Nevertheless, are already recognized its imple-mentation difficulties in the routine of microbiology laboratories [4,5].
Using vegetativeB. pumilusandB. safensiscells Farfour et al. [18] unsuccessfully attempted to discriminate these closely related species. Differentiation of these species using spore cells was proposed by Dickinson et al. [19], by MALDI-TOF-MS using a single ion atm/z 7620. Nevertheless, there is a need for further studies in order to assess the validity of this discriminatory tool. Moreover, Lash et al. [20,21] suggested that bacterial vegetative cells when submitted to a protein enrichment process, could provide a more informative mass spectra pattern than that obtained with bacterial spores [20,21].
In addition, the species-specific protein fingerprint constitutes a valuable approach for the assignment of species biomarkers, which usually comprise cell structure and housekeeping proteins [22]. In
Bacillus spp., ribosomal proteins and small acid-soluble spore proteins (SASPs) have been reported as potential species-specific biomarkers [21]. Nevertheless and despite this successful charac-terization of Bacillus cereus group species [21], this was not applied to the members of theB. pumilusgroup.
In this work, through the implementation of a protocol that enhances proteins extraction [21] combined with chemometric tools, we assessed the potential of MALDI-TOF-MS fingerprinting to discriminate a comprehensive collection ofB. safensis andB. pumilus isolates. Moreover, the tentative assignment of their species-specific protein biomarkers was also performed.
Materials and Methods
Isolates collection and identification
FiveB. pumilus and twenty-twoB. safensisisolates that were previously identified by phenotypic and genotypic (16S rRNA,
gyrB and rpoBgene sequences) methods were studied [5,23]. They comprised diverse pulsed-field gel electrophoresis (PFGE)-types and were recovered from different geographic terrestrial locations and sources, including food samples (Norway, Italy and Africa) (n = 4), plants (USA) (n = 2), gastropods (Portugal) (n = 3), health (n = 6) and cosmetic (n = 4) products (Portugal), and clean room environments from Mars Odyssey (USA) (n = 5). Additionally, type and reference strains, B. safensis FO-36bT, B. pumilus ATCC 7061Tand ATCC 14884 were included (Table 1).
Sample preparation
For MALDI-TOF-MS analysis, soluble proteins were extracted from a pure single colony of Bacillus spp. grown on LB agar (Merck, Darmstadt, Germany), which were subsequently cultured on the same medium, under aerobic conditions, for 24 h at 37uC. Bacterial cells were harvested by transferring three full loops (ca. 30ml) from each agar plate into 20ml of sterile water and were resuspended by vortexing. Bacterial inactivation was carried out applying the modified trifluoroacetic acid (TFA) (Sigma-Aldrich, St. Louis, MO) inactivation protocol [20], with some modifications previously established by Lash et al. (2008) [20] to improve the accuracy of the mass spectra. Briefly, 80ml of pure TFA was added to 20ml of each bacterial suspension. After gentle shaking (100 rpm) for 5 min at room temperature, the solution was centrifuged for 20 min at 28960 g21 at 4
uC. Subsequently, the supernatant was10-folddiluted with HPLC grade water(Millipore
Corp., Bedford, MA),filtered throughout a 0.22mm pore size filter
(Millipore) and stored at220uC until further analysis.
Mass spectrometry methods
Snapshots of different protein composition were detected and acquired by a MALDI-TOF/TOF mass spectrometer (4800 Plus MALDI TOF/TOF Analyzer, AB SCIEX, Framingham, MA), equipped with a 200-Hz frequency Nd:YAG laser, operating at a
wavelength of 355 nm. Pulse ion extraction with a 1300 ns delay time was used for collecting spectra. Measurements were carried out in linear positive mode using an acceleration voltage of 19.4 kV (Grid 1), and a lens 1 voltage of 8 kV. Each spectrum was the accumulated sum of at least 2000 laser shots within the ion range atm/z2000–12000, due to the good reproducibility of the spectral profile in this interval. All the spectra were externally calibrated using a commercial mixture of angiotensin I, ACTH (adrenocor-ticotropic hormone) and insulin (AB SCIEX, Framingham, MA) and analyzed with the Data Explorer software (Version 4.6, AB SCIEX, Framingham, MA).
For MALDI-TOF-MS experiments, 2ml of the filtrated microbial dilution were mixed with 2ml of a 12-mg/mla -cyano-4-hydroxycinnamic acid (CHCA) (Sigma-Aldrich, St. Louis, MO) solution, prepared in 100% ACN (Acetonitrile, Sigma-Aldrich) and 0.3% TFA. 1ml of the mixture was spotted onto a 123681 mm stainless steel MALDI sample plate (Opti-TOF 384- Well insert, AB SCIEX, Framingham, MA) and allowed to dry at room temperature. For each isolate, two biological replicates (obtained from two different agar plates) were carried out, and the mean spectra were considered for the analysis. Mass spectra were analyzed with the Data Explorer software (v3.7, build 126, AB SCIEX, Framingham, MA). Ion masses were extracted from the raw experimental mass spectra that included all the ion peaks with a relative signal to noise (S/N) ratio intensity above 2.
Chemometric methods
MALDI-TOF-MS spectra were mean-centred and analysed by partial least squares discriminant analysis (PLSDA) [24]. The PLSDA model were developed and validated based on a cross-validation strategy leave-one-out [25] where 70% of the strains were randomly selected to calibrate the model and 30% to test the model (the procedure was repeated 100 times). The PLSDA scores were the source for hierarchical cluster analysis (HCA). The purpose of HCA was the generation of dendrograms highlighting the association between isolates. Dendrograms were performed directly on unprocessed PLSDA scores using the Euclidean distance and the Median’s algorithm [26]. All chemometric models were performed in Matlab version 6.5 release 13 (MathWorks, Natick, MA) and the PLS Toolbox version 3.5 for Matlab (Eigenvector Research, Manson, WA).
Biomarker identification
Results and Discussion
One of the current challenges in bacterial taxonomy is to integrate timely and accurate typing methods for a meaningful identification of microorganisms [14], which is particularly problematic for closely related species such asB. pumilusandB. safensis [2,5]. Moreover, because of the medical, industrial and biotechnological relevance of these species, reliable, easy and rapid methodologies for their correct differentiation are needed. Discrimination of B. pumilus and B. safensis by molecular markers sequencing (e.g.gyrB), a time demanding and expensive methodology, which is not readily available for routine laborato-ries, was recently demonstrated [4,5]. In fact, there are no comprehensive studies assessing its potential onB. pumilusandB.
safensis discrimination despite the importance of the MALDI-TOF-MS application in bacterial differentiation. Moreover, combining accurate MALDI-TOF mass ion signals with the information available at a protein sequence database, such as UniProt, species-specific candidate protein biomarkers can be tentatively assigned, supporting the interest of this methodology for species identification.
Sample preparation conditions
Bacterial species identification using MALDI-TOF-MS is based on mass profiles obtained from whole bacterial cell suspensions considering proteins with low mass weight (less than 20 kDa). Additionally, for MS applications it is imperative to define a standardized protocol, including the establishment of rigorous
Table 1.Origins ofBacillusspp. isolates (n = 27) included in this study.
Isolate Origin Year/Location References
Bacillus pumilus
Bp ATCC14884 Reference strain
Bp ATCC 7061T Type Strain
Bp7 2005/Portugal1
Bp11 Health products (n = 3) 2005/Portugal1 [37]
Bp15 2005/Portugal1
Bacillus safensis
Bs1 2004/Portugal1
Bs2 Animals Gastropods (n = 3) 2005/Portugal1
Bs3 2007/Portugal1
Bs13 2005/Portugal1
Bs16 Health products (n = 3) 2005/Portugal1
Bs17 2005/Portugal1 [37]
Bs5 2002/Portugal1
Bs18 Cosmetic products (n = 4) 2002/Portugal1
Bs19 2002/Portugal1
Bs27 2002/Portugal1
Bs24 2004/Italy2
Bs25 Foods/salame (n = 3) 2004/Italy2 [38]
Bs33 2004/Italy2
Bs22 Plant Growth-Promoting
Rhizobacteria (PGPR) (n = 2)
1997/USA3 [39]
Bs23 1997/USA3
Bs31 Food/beans (n = 1) 2003/Africa4 [40]
Bs FO-36bT Clean-room/air particulate (n = 1) 1999/USA5 Type Strain, [2]
Bs35 Clean-room/floor (n = 1) 2001/USA5
Bs36 Clean-room/cabinet top (n = 1) 2001/USA5
Bs37 Clean-room/Mars Odyssey spacecraft surface (n = 2) 2001/USA5 [2]
Bs38
Bs42 Clean-room/anteroom (n = 1) 2001/USA5
TType Strain.
1Isolates obtained from the Quality Control Department (INFARMED), Lisbon, Portugal.
2Isolates FEL 55 from salame felino, UNG22 from salame ungherese and MIL46 from salame milano obtained from the Istituto di Scienze delle Produzioni Alimentari (ISPA), Bari, Italy.
3Isolates SE 49 (AP3) and SE 52 (AP7) from cucumber roots obtained from the Culture collection of the Department of Entomology and Plant Pathology, Auburn University, Alabama, USA.
4Isolates Bs31 from African locust beans forSoumbala productionobtained from Ouagadougou, Africa.
5Isolates FO-36b, SAFN-027, SAFN-037, KL-052, 51-3C and 82-2C from spacecraft and assembly-facility surfaces obtained from California Institute of Technology, California, USA.
sample preparation and cultivation conditions, including culture medium, temperature and time. Therefore, an adequate number of ion masses should be obtained to allow the identification and discrimination of closely related bacterial species. Moreover, the definition of strict parameters for spectral data acquisition is also required.
The protein enrichment protocol, reported by Lash et al. [20], forB. cereusgroup members, using a combined TFA treatment, centrifugation and filtration steps, is of relevance in the case of
Bacillusspecies, since it promoted an efficient extraction of soluble microbial proteins presented in the core spore and other morphological structures [20]. The described sample preparation procedure was successfully applied toB. pumilusand B. safensis
isolates, clonally diverse and collected from different terrestrial origins [4], demonstrating its suitability to generate reproducible mass spectra data with a sufficient number of ion masses and reinforcing the potential for the successful application of the MS technique for their identification in routine laboratories.
Mass spectrometry analysis
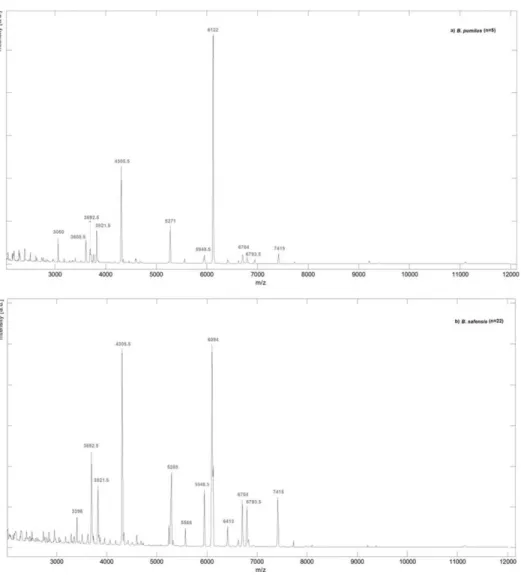
The Figure 1 displayed the average mass spectra obtained from MALDI-TOF-MS analysis for the two Bacillus species under study: (a)B. pumilus(5 spectra) and (b)B. safensis(22 spectra), in the ion range atm/z 2000 to 12000. In fact, MALDI-TOF-MS profile analysis revealed the presence of species-specific ion signals.
Table 2.Species-specific ionm/zvalues (average) ofB. pumilusandB. safensisisolates.
Experimental average ionm/zvaluesa
B. pumilus B. safensis
3692.5
3060 (BP1)b 3821.5
B. pumilus 3608.5 (BP2) 4305.5
5271 (BP3) 5948.5
6122 (BP4) 6704
6793.5
7415
3692.5
3821.5 3396 (BS1)b
4305.5 5288 (BS2)
B. safensis 5948.5 5568 (BS3)
6704 6094 (BS4)
6793.5 6413 (BS5)
7415
aaverage ionm/zvalues (
62Da).
bIn brackets were named candidate species-specific ion masses. doi:10.1371/journal.pone.0110127.t002
Figure 1. Average mass spectra obtained by MALDI-TOF-MS analysis ofB. pumilusandB. safensisisolates.(a)B. pumilus(5 spectra) and (b)B. safensis(22 spectra) in the ion range atm/z2000 to 12000. Spectra were obtained by averaging the respective experimental ion signals from all isolates.
Table 2 compiled the characteristic ion masses for each spectral group and those presented in both species.
As expected, similar fingerprints could be observed for isolates belonging to the same species, exhibiting several common ion peaks (Figure 1). For instance, the ions havingm/zvalues at 3060, 3608.5, 5271 and 6122 were consistently observed inB. pumilus
isolates, while the ions having them/zvalues at 3396, 5288, 5568, 6094 and 6413 were related toB. safensis. Moreover,B. pumilus
andB. safensisisolates demonstrated common ions atm/z3692.5, 3821.5, 4305.5, 5948.5, 6704, 6793.5 and 7415 (Table 2), which could be considered characteristic ion peaks for both species. Therefore, the protein fingerprint similarities achieved amongB. pumilus and B. safensis corroborated the closeness similarity previously verified among them [4,5].
Interestingly, some spectral variability was observed within isolates belonging to the same spectral group, including the presence or absence of some ion peaks beyond those listed in table 2 (data not shown). This observation was not surprising, since we had previously demonstrated that both species comprised a clonally diverse population [4]. Therefore, the specific peptide profile probably reflects their evolution towards an adaptation to different niches [4].
Indeed, few studies have explored the potential of MALDI-TOF-MS to properly identifyB. pumilus orB. safensis isolates [18,19,29,30].
Farfour et al. attempted unsuccessfully to discriminate between
B. pumilusandB. safensisvegetative cells by MALDI-TOF-MS using the Andromas database [18]. This discrepancy highlighted the need for the improvement and enlargement of this database and led eventually to the prior enrichment of the protein before MS analysis. Moreover, Bo¨hme et al. [29], usingB. pumilustype and reference strains (ATCC 7061T and 14884) that were subjected to an extraction procedure previously to the MS analysis, suggested the presence of a series of ions atm/z 3620, 5297, 6617 and 7237, which were specific for this species, when compared with other B. subtilis group members (B. subtilis,
Bacillus amyloliquefaciens and Bacillus licheniformis) and with members ofBacillus cereusgroup (B. cereus,Bacillus megaterium
andBacillus thuringiensis). In addition, the presence of this same series of ions atm/z3620, 6617 and 7238 were also detected by Ferna´ndez-No et al. [30] in the same reference strains. Analysis of our MALDI-TOF-MS profiles did not reveal these ion peaks asB. pumilusspecies-specific discriminatory, when compared with B. safensis. Nevertheless, a closer inspection of the mass spectra ofB.
Figure 2. Score plot obtained by PLSDA regression model and the corresponding dendrogram.Score plot of the PLSDA regression model (a) and respective dendrogram (b), ofB. pumilusandB. safensisisolates. Legend:
N
B. pumilus isolatesand.B. safensis isolates. Unfilled symbols correspond to the type strains of both species.Specie(s)
Observed Mass (Da)
Predicted
Mass (Da) Error (%)
UniProt
Accession ID Protein Description Peptide sequence Organismc
3060 NA NA Unassigned NA NA
3608.5 NA NA Unassigned NA NA
5270 0.02 A8FJG4 50SbRP subunit L34 MKRTFQPNNRKRSKVHGFRSRMSSKNGRLVLKRRRSKGRKKLSA B. pumilus SAFR-032
5271
B. pumilus 5266.89 0.08 A8FDQ9 aSASP O MTKRKANHVINGMNAAKSQGNGAGYIEDDQLVLTAEQRQNNKKRKKNQ
B. pumilusSAFR-032
6114 0.2 C0H3U0 Uncharacterized membrane protein YyzG
MQTNRVILLAVMICLVSAITVFLLNGCKVDFLDIGGTIIGCFLGIFVVVRIQKKQS B. subtilissubsp.
subtilisstr. 168
6122
6126 0.08 P0C8M5 Transcriptional regulator SlrA
MKTHVKKDLDKGWHMLIQEARSIGLGIHDVRQFLESETASRKKNHKKTVRQD B. subtilissubsp.
subtilisstr. 168
3049 NA NA Unassigned NA NA
3396 NA NA Unassigned NA NA
B. safensis 5288 5299.88* 0.2 A8FHD4 aSASP J MSFFQKDKKAKSEKDHKQVDQLLEEASKELAGDPLQEAVQKKKNNDQ B. pumilusSAFR-032
5568 5544 0.5 A8FDQ8 aSASP P MTNKNTGKDIRQNSPKEHQSGQPEPLSGSKKVKNRNHTRQKHNSHHDM B. pumilusSAFR-032
6094 NA NA Unassigned NA NA
6413 6411.7* 0.03 A8FCW7 bRP subunit L32 MAVPFRRTSKMKKRLRRTHFKLQVPGMVACPECGEMKISHRVCKSCGTYKGKDVKSN B. pumilusATCC 7061T
3692.5 3698 0.1 C0H3V1 UPF0752 membrane protein YczN
MSGYSNGGGYGGISSFALIVVLFILLIIVGTAFVGGF B. subtilissubsp.
subtilisstr. 168
3821.5 NA NA Unassigned NA NA
4305.5 4305 0.01 A8F9A9 50SbRP subunit L36 MKVRPSVKPICEKCKVIRRKGKVMVICENPKHKQKQG
B. pumilusSAFR-032
B. pumilusand B. safensis
5948.5 5932 0.3 A8FF72 50SbRP subunit L33 2 MRVNITLACTECGERNYITKKNKRNNPDRVEFKKYCSRDKKQTVHRETK B. pumilusSAFR-032
6704 6691 0.3 C0H3Z1 Uncharacterized protein YjzG
MMKNGFAYKNGKLVNIFCGKEELYNELKAFLVKTFSINVKEVSRPSIYRRTKSKQLE B. subtilissubsp.
subtilisstr. 168
6793.5 6793* 0.01 B4AE40 50SbRP subunit L28 MARKCVITGRKTKAGNNRSHAMNSTKRTWGANLQKVRILVDGKPKR VYVSARALKSGKVERV
B. pumilusATCC 7061T
7415 7410.8* 0.08 B4AM90 50SbRP subunit L35 MPKMKTHRGSAKRFKKTGSGKLKRSHAYTSHLF ANKSTKQKRKLRKSAIVSAGDFKRIKQQLANIK
B. pumilusATCC 7061T
Protein identity was determined by the TagIdent software and compared with ribosomal subunit proteins developed by Hotta et al. [23] described in Materials and Methods section. aSASP - Small, acid-soluble spore protein.
bRP – Ribosomal protein.
cOrganism – bacterial strain where the protein was described.
NA – not applicable.
*Predicted molecular weight (Mw) proposed by Hotta et al. [27], considering ‘‘N-end rule’’ [28] where N-terminal methionine is cleaved from specific penultimate amino acid residues such as glycine, alanine, serine, proline, valine, threonine and cysteine.
doi:10.1371/journal.pone.0096944.t003
B.
pumilus
and
B.
safensis
Profiling
by
MALDI
ONE
|
www.ploson
e.org
6
October
2014
|
Volume
9
|
Issue
10
|
pumilusATCC 7061Tand 14884, revealed the presence of ions havingm/zvalues at 3621, 5290 and 6624, although the ion atm/z
7238 was not present. Indeed, the differences found in theseB. pumilusprofiles could be justified by the distinct growth culture medium used and the sample preparation procedure employed.
Finally, in other work, Dickinson et al. [19] presented MALDI-TOF-MS as a useful taxonomic tool for differentiating spores ofB. pumilus and B. safensis. Results revealed the presence of two groups of characteristic ion peaks, comprisingB. pumilus(ions at
m/z6860, 7230 and 9606) andB. safensis(ions atm/z6860, 7230, 7620 and 9606). The authors claimed the presence of the additional ion atm/z7620 in the spectra profile ofB. safensisas a species-specific biomarker, allowing the discrimination of these two species. Nonetheless, analysis of ourB. safensisspectral data (n = 22) did not reveal the presence of this ion peak, probably because the obtained MALDI-TOF-MS profiles were from vegetative cells. Additionally, the spectral profile obtained from spores seems to be more laborious and insufficient to discriminate appropriately among these closely related species, since spectral data with few number of ion peaks were generated. For these reasons, it was not possible to compare our study with the existing ones as we have used different cultural conditions and sample preparation procedures.
On the other hand, the species identification is limited to the bacterial species spectrum presented in a specific MS database. Therefore, bacterial identification is only possible inside the frame of bacterial reference spectrum of the database used. Indeed, few well-characterized B. pumilus isolates are available in public databases, as the SpectraBank (http://www.spectrabank.org), namely the type strain ATCC 7061T and the reference strain ATCC 14884, and no B. safensis was yet included, which constrains its identification.
Chemometric analysis
B. pumilus and B. safensis were clearly discriminated by a combined MALDI-TOF-MS and chemometric approach. The score plot generated by PLSDA of mass spectra of all isolates tested exhibited two individualized clusters, each one enclosing isolates belonging to a particular spectral group, which included reference and type strains (Fig. 2) of (a) B. pumilus and (b) B. safensis. The PLSDA scores were also presented as a dendrogram corroborating the species discrimination into two distinct clusters (Fig. 2). Moreover, this approach allowed the discrimination of the twoBacillusspecies with 100% of sensitivity and specificity.
Despite the recognized proficiency of chemometric tools for the analysis and identification of bacteria based on their fingerprint, in the case ofBacillusspp., this characterization was only previously applied inB. cereusgroup species [21]. Therefore, this is the first
successful application of this approach considering members ofB. pumilusgroup, stressing its relevance for discrimination among close related species.
Candidate molecular biomarkers assignment
The possibility of biomarkers identification is one of the most valuable aspects of the mass spectrometric-based identification techniques, being this approach successfully applied to different bacterial species [21,31,32].
The assignment of 17 mass signals diagnostic ions formed in the MALDI-TOF-MS ofB. pumilusand B. safensisrepresented the first consistent evidence of the relation between these ion m/z
signals and the specific candidate protein sequences, which were presented in Table 3. Direct bacterial discrimination by means of MALDI-TOF-MS was hampered by the absence of consistent databases supported on sufficient identified biomarkers. Indeed, only twoB. pumilusgenomes with numerous proteins defined as unknown were available in UniProtKB/Swiss-Prot and Uni-ProtKB/TrEMBL (B. pumilusSAFR-032 and ATCC 7061T) and no B. safensis were deposited, which hindered the candidate biomarkers identification. Therefore, this type of assignments can only be tentatively used to establish potential connections between protein sequences and ion m/z signals, and thus, should be prudently interpreted, although previously successfully applied in
B. cereusgroup members [21].
We found evidences of B. pumilus and B. safensis specific biomarkers, associated with a series of ions atm/z4305.5, 5948.5, 6793.5 and 7415, which was attributed to the 50S ribosomal subunits proteins, respectively, L36, L33, L28 and L35 of B. pumilus SAFR-032 (correspondent amino acidic sequences were also presented in Table 3). Moreover, the remaining ion detected at m/z of 3821.5 was not assigned, and two showed correspon-dences with membrane proteins of B. subtilis subsp. subtilis str 168, the YczN and YjzG atm/zof 3692.5 and 6704, respectively. The tentative assignment of B. pumilus specific biomarkers revealed the possible correspondence of the diagnostic ion atm/z
5271 with the 50S ribosomal subunit protein L34 or with the SASP O. In addition, the characteristic ion at m/z 6122 was diagnostic for either the uncharacterized membrane protein (YyzG) and/or the transcriptional regulator – SlrA ofB. subtilis
subsp.subtilisstr 168. Additionally, the characteristic ions atm/z
3060 and 3608.5 were not possible to assign.
Concerning B. safensis specific ions at m/z 5288, 5568 and 6413, potentially corresponding with two specific SASPs (SASP J and SASP P) and a 50S ribosomal subunit protein L32 were also found in B. pumilus SAFR-032. The remaining ion m/z peaks detected were not possible to designate. Therefore, the proposed characteristic biomarkers, which could be used to differentiate
Table 4.Candidate species-specific biomarkers assignments ofB. pumilusandB.safensis.
Species
Ion mass (m/z) B. pumilus B. safensis
5271 + 2
5288 2 +
5568 2 +
6122 + 2
6413 2 +
betweenB. pumilusandB. safensis are summarized in Table 4. Moreover, these differentiating series of ions were shown in Figure 3, which outlined the representative MALDI-TOF-MS biomarkers established forB. pumilusandB. safensis.
In fact, ribosomal proteins and small, acid-soluble spore proteins (SASPs) have been suggested to be responsible for many
ion masses detected by MALDI-TOF-MS profiles [21]. Since up to 21% of the overall cellular protein content is ribosomal and because ribosomal proteins are part of the cellular translational machinery constitutively expressed in vegetative cells, they constitute a stable ensemble of protein biomarkers suitable for use by fingerprinting techniques [33]. Moreover SASPs, a group of Figure 3. MS patterns of the candidate species-specific ion peaks (m/z) using MALDI-TOF-MS in linear mode.a)B. pumilus(average of 5 spectra) and b)B. safensis(average of 22 spectra). In brackets were named candidate species-specific ion peaks.
species-specific proteins present in large amounts in the core region of Bacillus endospores, have been also proposed as biomarkers for rapid differentiation and identification ofBacillus
spp. using mass spectrometry approaches [34,35,36].
Our results also suggested that ribosomal and spore proteins constituted most of theB. pumilusandB. safensisbiomarkers. A more detailed analysis could be carried out with MS/MS peptide fragmentation of the specific proteins assigned and subsequent comparison in protein databases or even with MS/MS peptide
de novo sequencing. Nevertheless, within the context of the present work, which aimed to establish a MALDI-TOF-MS fingerprint classification for B. pumilus and B. safensis, these results may be beneficial and improve further accuracy of MS-based detection methods in identifying these species.
Conclusion
MALDI-TOF-MS profiles combined with chemometric analysis (PLSDA) proved to be valuable tools for discrimination of B.
pumilusand B. safensis, allowing its rapid identification. These high throughput approaches should be promptly considered for
Bacillus species identification due to the inaccuracy of conven-tional techniques in the identification of closely related species of this genus. In this sense, it is imperative to standardize a sample preparation protocol, which should include a protein extraction and enrichment step, to provide informative and reproducible mass spectra. Moreover, tentative assignment ofB. pumilusandB. safensis protein biomarkers suggested that most of them are ribosomal and spore proteins.
Author Contributions
Conceived and designed the experiments: RB CS JL LP HO. Performed the experiments: RB CS HO. Analyzed the data: RB JL CS MP LP HO. Contributed reagents/materials/analysis tools: CS JL MP LP HO. Contributed to the writing of the manuscript: RB CS LP HO.
References
1. U. S. Environmental Protection Agency (USEPA) (2004) Biopesticides Registration Action Document,Bacillus pumilusstrain QST 2808 (PC Code 006485). Office of Pesticide Programs, Washington, DC: Government Printing Office.
2. Satomi M, La Duc MT, Venkateswaran K (2006)Bacillus safensissp. nov., isolated from spacecraft and assembly-facility surfaces. Int J Syst Evol Microbiol 56: 1735–1740.
3. Pe´rez-Garcia A, Romero D, de Vicente A (2011) Plant protection and growth stimulation by microorganisms: biotechnological applications of Bacilli in agriculture. Curr Opin Biotechnol 22: 187–193.
4. Branquinho R, Meirinhos-Soares L, Carric¸o JA, Pintado M, Peixe LV (2014) Phylogenetic and clonality analysis ofBacillus pumilus isolates uncovered a highly heterogeneous population of different closely related species and clones. FEMS Microb Ecol. doi:10.1111/1574-6941.12426
5. Liu Y, Lai Q, Dong C, Sun F, Wang L, et al. (2013) Phylogenetic diversity of the Bacillus pumilusgroup and the marine ecotype revealed by Multilocus Sequence Analysis. PLoS ONE 8: 1–11.
6. Hong HA, Duc le H, Cutting SM (2005) The use of bacterial spore formers as probiotics. FEMS Microbiol Rev 29: 813–835.
7. Pe´rez-Garcia A, Romero D, de Vicente A (2011) Plant protection and growth stimulation by microorganisms: biotechnological applications of Bacilli in agriculture. Curr Opin Biotechnol 22: 187–193.
8. From C, Hormazabal V, Granum P (2007) Food poisoning associated with pumilacidin-producingBacillus pumilusin rice. Int J Food Microbiol 115: 319– 324.
9. From C, Pukall R, Schumann P, Hormaza´bal V, Granum PE (2005) Toxin-producing ability amongBacillusspp. outside theBacillus cereusgroup. Appl Environ Microbiol 71: 1178–1183.
10. Haymore BR, Akers KS, Ferguson TM (2006) A case of persistentBacillus pumilusbacteremia associated with cholangitis. J Infect 52: 154–155. 11. Bentur HN, Dalzell AM, Riordan FAI (2007) Central venous catheter infection
withBacillus pumilusin an immunocompetent child: a case report. Ann Clin Microbiol Antimicrob 6: 12.
12. Tena D, Martinez-Torres JA, Perez-Pomata MT, Sa´ez-Nieto JA, Rubio V, et al. (2007) Cutaneous infection due toBacillus pumilus: report of 3 cases. Clin Infect Dis 44: 40–42.
13. Johnson BT, Shaw LN, Nelson DC, Mayo JA (2008) Extracellular proteolytic activities expressed by Bacillus pumilus isolated from endodontic and periodontal lesions. J Med Microbiol 57: 643–651.
14. Clark AE, Kaleta EJ, Arora A, Wolk DM (2013) Matrix-assisted laser desorption ionization-time of flight mass spectrometry: a fundamental shift in the routine practice of clinical microbiology. Clin Microbiol Rev 3: 547–603.
15. Keys CJ, Dare DJ, Sutton H, Wells G, Lunt M, et al. (2004) Compilation of a MALDI TOF mass spectral database for the rapid screening and characteriza-tion of bacteria implicated on human infectious diseases. Infect Genet Evol 3: 221–42.
16. Mellmann A, Bimet F, Bizet C, Borovskaya AD, Drake RR, et al. (2009) High interlaboratory reproducibility of matrix-assisted laser desorption ionization-time of flight mass spectrometry-based species identification of nonfermenting bacteria. J Clin Microbiol 47: 3732–4.
17. Emonet S, Shah HN, Cherkaoui A, Schrenzel J (2010) Application and use of various mass spectrometry methods in clinical microbiology. Clin Microbiol Infect 11: 1604–1613.
18. Farfour E, Leto J, Barritault M, Barberis C, Meyer J, et al. (2012) Evaluation of the Andromas matrix-assisted laser desorption ionization-time of flight mass
spectrometry system for identification of aerobically growing Gram-positive bacilli. J Clin Microbiol 50: 2702–7.
19. Dickinson DN, La Duc MT, Satomi M, Winefordner JD, Powell DH, et al. (2004) MALDI-TOF MS compared with other polyphasic taxonomy approach-es for the identification and classification ofBacillus pumilusspores. J Microbiol Methods 58: 1–12.
20. Lasch P, Nattermann H, Erhard M, Sta¨mmler M, Grunow R, et al. (2008) MALDI-TOF mass spectrometry compatible inactivation method for highly pathogenic microbial cells and spores. Anal Chem 80: 2026–2034.
21. Lasch P, Beyer W, Nattermann H, Sta¨mmler M, Siegbrecht E, et al. (2009) Identification ofBacillus anthracisby using matrix-assisted laser desorption ionization-time of flight mass spectrometry and artificial neural networks. Appl Environ Microbiol 75: 7229–42.
22. Welker M, Moore ER (2011) Applications of whole-cell matrix-assisted laser-desorption/ionization time-of-flight mass spectrometry in systematic microbiol-ogy. Syst Appl Microbiol 34: 2–11.
23. Wang LT, Lee FL, Tai CJ, Kasai H (2007) Comparison ofgyrBgene sequences, 16S rRNA gene sequences and DNA–DNA hybridization in theBacillus subtilis group. Int J Syst Evol Microbiol 57: 1846–1850.
24. Barker M, Rayens W (2003) Partial least squares for discrimination. J Chemom 17: 166–173.
25. Sousa C, Grosso F, Meirinhos-Soares L, Peixe L, Lopes J (2014) Identification of carbapenem-resistantAcinetobacter baumanniiclones using infrared spectros-copy. Journal of Biophotonics 7: 287–294.
26. Næs T, Isaksson T, Fearn T, Davis T (2002) A user-friendly guide to multivariate calibration and classification. NIR Publications, Chichester UK.
27. Hotta Y, Sato J, Sato H, Hosoda A, Tamura H (2011) Classification of the genus Bacillusbased on MALDI-TOF MS analysis of ribosomal proteins coded in S10 andspcoperons. J Agric Food Chem 59: 5222–30.
28. Sherman F, Stewart JW, Tsunasawa S (1985) Methionine or not methionine at the beginning of a protein. Bioessays 1: 27–31.
29. Bo¨hme K, Ferna´ndez-No IC, Barros-Vela´zquez J, Gallardo JM, Can˜as B, et al. (2011) Rapid species identification of seafood spoilage and pathogenic Gram-positive bacteria by MALDI-TOF mass fingerprinting. Electrophoresis 32: 2951–65.
30. Ferna´ndez-No IC, Bo¨hme K, Dı´az-Bao M, Cepeda A, Barros-Vela´zquez J, et al. (2013) Characterization and profiling ofBacillus subtilis,Bacillus cereusand Bacillus licheniformisby MALDI-TOF mass fingerprinting. Food Microbiol 33: 235–242.
31. Dieckmann R, Malorny B (2011) Rapid Screening of Epidemiologically ImportantSalmonella entericasubsp. enterica Serovars by Whole-Cell Matrix-Assisted Laser Desorption Ionization–Time of Flight Mass Spectrometry. Appl Environ Microbiol 77: 4136–4146.
32. Momo RA, Povey JF, Smales CM, O’Malley CJ, Montague GA, et al. (2013) MALDI-TOF mass spectrometry coupled with multivariate pattern recognition analysis for the rapid biomarker profiling ofEscherichia coliin different growth phases. Anal Bioanal Chem 25: 8251–8265.
33. Arnold RJ, Reilly JP (1999) Observation ofEscherichia coliribosomal proteins and their posttranslational modifications by mass spectrometry. Anal Biochem 269: 105–112.
34. Driks A (1999) TheBacillus subtilisspore coat. Microbiol Mol Biol Rev 63: 1–20.
36. Lai EM, Phadke ND, Kachman MT, Giorno R, Vazquez S, et al. (2003) Proteomic analysis of the spore coats ofBacillus subtilisandBacillus anthracis. J Bacteriol 185: 1443–1454.
37. Branquinho R, Pintado ME, Peixe L (2012) Clonality and protein diversity of Bacillus pumilusisolates from different sources and geographic regions. Planta Med 78: PA5, doi:10.1055/s-0032-1320320
38. Matarante A, Baruzzi F, Cocconcelli PS, Morea M (2004) Genotyping and toxigenic potential ofBacillus subtilisandBacillus pumilusstrains occurring in industrial and artisanal cured sausages. Appl Environ Microbiol 70: 5168–5176.
39. Jetiyanon K (1997) Interaction between PGPR and cucumber during induced systemic resistance: recognition and early host defense responses. Ph.D. dissertation, Auburn University, Auburn, AL, USA.