IFGI (WWU MÜNSTER, GERMANY) - UJI (CASTELLÓN, SPAIN)
Travel simulation inside
an Immersive Video
Environment (IVE)
Master Thesis Report
Erasmus Mundus Master of Science
in Geospatial Technologies
Author:
Luis Bausá López
[email protected]February 2013, Münster
Supervisor Co-Supervisors
Christian Kray Oscar Belmonte Roberto Henriques
I.
Abstract
This research study explores different methods and technologies to simulate travel inside an IVE that contains videos from several different locations. From the most adequate method and technology, a prototype is developed and evaluated. The videos are static, meaning that each video was recorded on a single location, and the orientation an coordinates doesn't change. We want to simulate the travel between two different locations. The video of a location is called a task, and the travels are called transitions. Using information gathered from previous studies and using the available technologies, this document will create a prototype of travel transition for our IVE. Finally, we are going to evaluate a tour composed of tasks and transitions on a group of test users to assess the quality and usability of the transition prototype. The prototyping and evaluation are based on the crucial quality and usability factors concerning our custom IVE system.
II.
Keywords
III.
Preface
This document is the result of my master's thesis research project, which is the last part of the Master of Science degree in Geospatial Technologies. This research project is aimed at the prototyping and evaluation of travel transitions in the immersive video environment of the Sitcom Lab, located at the Institut für Geoinformatik (IFGI) of the Westfälische Wilhelms-Universität Münster (WWU).
The master program belongs to the Erasmus Mundus Master's program and three universities participate: WWU from Münster (Germany), UJI from Castellón (Spain) and ISEGI form Lisbon(Portugal).
Here I want to state that all the research and development work performed in this thesis document is original and has been done by myself. All the information sources used and work citations are included in the bibliography, and any possible omission is unintended.
A special mention to Google's interests is needed about the transitions: Even though it was stated several times in this document, and in the video files properties, that the transitions were created using Google Earth Pro (trial version), the final transitions doesn't include the GE logo. This is completely unintentional and a side effect of the resizing of the videos, as is explained later in this document.
I would like to thank Christian Kray, for being my supervisor and for all the help he provided.
Thanks also to all my student partners, it's been a pleasure so share this journey with them and to help each other.
A special thanks to my parents and family for making this possible.
IV.
Table of contents
1. Introduction ... 1
1.1. Related work ... 1
1.1.1. Virtual Environments (VE) ... 1
1.1.2. Design and evaluation methodologies for VE ... 5
1.1.3. Other related work ... 6
1.2. Motivation ... 6
1.3. Objectives ... 7
2. Experimental Setup ... 8
2.1. Problem description... 8
2.1.1. Our IVE ... 8
2.1.2. Technologies considered ... 9
2.1.3. Evaluation methods ... 13
2.1.4. Prototype analysis ... 15
2.1.5. Technological choice ... 18
2.2. Prototype setup ... 20
2.3. Evaluation setup ... 22
2.3.1. SSQ ... 24
2.3.2. VRUSE ... 25
2.3.3. User group ... 26
3. Travel Prototype ... 27
3.1.1. Locations ... 27
3.1.2. Transitions ... 28
3.1.3. Tour ... 31
4. Evaluation ... 34
5. Results ... 36
5.1. Presentation of results ... 36
5.1.1. SSQ results ... 36
5.1.2. VRUSE results ... 39
5.2.1. SSQ - Quality Factor 1: Speed ... 41
5.2.2. VRUSE ... 46
5.3. Bias correction ... 49
6. Conclusions ... 54
6.1. Future work ... 55
7. Bibliography ... 57
7.1. Academic references ... 57
7.2. Technical references ... 61
7.3. Other references ... 62
8. Annexes ... 64
8.1. SSQ ... 64
8.1.1. URLs ... 64
8.1.2. Printable versions ... 64
8.1.3. Test results ... 67
8.2. VRUSE ... 69
8.2.1. URL ... 69
8.2.2. Printable version ... 69
8.2.3. Test results ... 73
8.3. Locations ... 75
8.3.1. URLs ... 75
8.3.2. KML ... 75
8.4. Travel transitions ... 76
8.4.1. URLs ... 76
8.4.2. KML ... 76
V.
Table of figures
Image 1 - Sharp Fully Immersive Video Environment ... 3
Image 2 - US Soldiers VR training (left). Doctors using IVE for data visualization (right) ... 4
Figure 1 - Diagram of the IVE architecture ... 9
Table 1 - Types of travel transitions ... 10
Figure 2 - Evaluation of the cognitive effects of travel technique in complex real and virtual environments ... 16
Image 3 - Snapshot of our IVE from the user perspective ... 17
Image 4 - GE Tour of a transition ... 22
Image 5 - Example of an online questionnaire created using Google Drive forms ... 23
Table 2 - SSQ weighting system ... 25
Image 6 - PlaceMarks of the visited locations ... 27
Image 7 - Map of the places visited in the tour ... 28
Image 8 - Directory tree of the transitions in GE ... 29
Image 9 - Google Earth options for the speed and quality of the tours ... 29
Image 10 - Example of Floor View of a travel transition ... 30
Image 11 - Example of Eagle View of a travel transition ... 30
Image 12 - Transition example: flying between PlaceMarks 07 and 08 ... 31
Image 13 - Conversion of the transitions videos with AVC ... 31
Image 14 - Joining the IVE videos and the transitions to create the tour using VirtualDub ... 32
Image 15 - Group of users watching the tour during one of the evaluation sessions ... 34
Table 3 - Pre-SSQ scores ... 37
Table 4 - Pre-SSQ mean and SD of the scores ... 37
Table 5 - Post-SSQ scores ... 37
Table 6 - Post-SSQ mean and SD of the scores ... 38
Table 7 - Diff. Post-Pre SSQ scores ... 38
Table 8 - Diff. Post-Pre SSQ mean and SD of the scores ... 39
Table 9 - VRUSE scores ... 39
Table 10 - VRUSE mean and SD of the general scores ... 40
Table 11 - VRUSE mean and SD of the overall scores ... 40
Figure 3 - Boxplots of the Pre-SSQ scores ... 41
Figure 4 - Histograms of the Pre-SSQ scores ... 42
Figure 5 - Boxplots of the Post-SSQ scores ... 43
Figure 6 - Histograms of the Post-SSQ scores. ... 43
VI.
Acronyms and terms used
API (Application Program Interface): It's a set of functions, procedures and/or methods that a certain library provides to be used by other software as an abstraction layer.
AR: Augmented reality.
Boxplot: It is a convenient way of graphically depicting groups of numerical data through their five-number summaries: the smallest observation (sample minimum), lower quartile (Q1), median (Q2), upper quartile (Q3), and largest observation (sample maximum).
CAVE (Cave Automatic Virtual Environment): Usually a dome or a fulldome, showing a virtual environment with which the user can interact and move around.
DEM: Digital Elevation Model
FPS (Frames per second): number of images or frames that a video file contains in each second.
GE: Google Earth.
GSV: Google Street View.
GUI (Graphical User Interface): The interface allows the user to interact with the program, providing functionality. In our case, it allows the user to select, create, edit and delete the locations and it's information (coordinates, description, video file...).
HMD (Head-Mounted Display): It is a display device worn on the head with a small optical display in front of one or both eyes, called monocular and binocular HMD respectively. HMD also stands for Helmet-mounted display when Helmet-mounted as part of a helmet.
IVE (Immersive Video Environment): In our case, it is a set of screens showing looping videos recorded at specific locations, with one purpose: to make the user feel like he/she is actually at that specific location. IVE can also stand for Immersive Virtual Environment
LOD: Level of detail.
Prototype of transition: It's a rudimentary implementation of a way to show the user what lies between the existing locations. It may also provide the user with some new functionality.
RW (Real walking): Travel technique simulating movement from the point of view of a person walking.
SBSOD (also SBSODS): Santa Barbara sense of direction scale, intended as a tool to self-report the spatial ability of users.
State or Location: It is one of the points for which there is a long static video recorded, simulating the environment in a specific location, also called place or Placemark. Along with the georeference and the video, it can also contain some other information.
Transition: Is the change between two locations or states, also called travel transition or travel simulation. It provides the user with information about what lies between the locations.
UI: User Interface
VE: Virtual Environment
VR: Virtual reality.
VRUSE: Virtual Reality Systems Usability diagnostic tool
1.
Introduction
Nowadays, the use of virtual reality and augmented reality systems is growing at a very fast rate, as very different fields find multiple uses for it. During its evolution, the virtual reality technologies have subdivided in many branches. The branch we are going to focus on are the immersive environments, which are artificial and interactive simulations of a world, real or imaginary, in which a user feels immersed, meaning that he gets a "feeling" of really being there, and he can interact with it.
In this document we are going to focus on simulating travel inside an IVE, which is a specific kind of immersive environment focused on playing videos of the real world at certain locations. When we go from one location to another, our IVE just changes the video file. We are going to simulate the travel between the current location and the destination.
1.1.
Related work
There is extensive work related to virtual environments and their applications to many different fields. To better understand it, we will start by introducing the diverse types of virtual environments, finally focusing on the immersive environments. After we will focus on the design and evaluation methodologies upon which we have based our study, or have guided it through the right way.
1.1.1.
Virtual Environments (VE)
support and standardize these technologies, many non-profit organization like ImTech [O02] have born.
Many authors associate the term "Virtual Environment" and "Virtual Reality" as being the same thing, while VR is just a kind of VE. There are also differences of opinion whether the definition of VR entails that users must be able to interact among themselves, but that would leave out single-user systems. This leads us to one way of classification: single- and multi-user VEs.
To deal with this "inaccuracy" issue, some authors chose to focus on key differences between the different types of virtual environments. One of them is R. Schroeder in [A25], where he explains the differences between virtual environments and virtual worlds. But there is a common line to most definitions: a focus on the sensorial experience provided to the user.
It is much simpler to classify them by their purposes and capabilities. In this case, the two main groups would be Desktop VR and Immersive VR. Other important types are shared spaces, mixed reality and augmented reality environments. Some of these VE subgroups do entail being multiuser and providing interaction capabilities between the users, such as the collaborative environments. But one thing is for sure: the definition for each of these kinds of VE always overlaps at some point(s) with the others'. This means that, if you pick up one specific VE system, it will be possible to classify it in several of these groups. As an example a MMORPG, like the famous World of Warcraft, can be classified as a Desktop Virtual Environment, but also as a Virtual World and as a shared space.
1.1.1.1.
Immersive environments (IE)
To some extent, all the VE must provide a sense of immersion, usually meaning "engaging" the user into the VE, but to be able to call it "immersive" it has to go beyond engaging the user: it must fool his senses into really "believing" or "feeling" he is there. Here we have again two different groups: the immersive and the fully immersive environments. The difference between them is that the fully immersive environments are designed to provide responses to the 5 senses (sight, sound, touch, taste and smell) using different technologies to achieve that effect. As it is very hard and expensive to do that, and sometimes completely unnecessary, in most cases only sight and sound, and sometimes touch, are simulated and they are called immersive environments.
head-mounted displays (HDM), but not the only one. Another type of IE are the CAVE systems, consisting in a dome where the simulation is projected. Finally, the immersive video environment (IVE from now on will stand for Immersive Video Environment, IE to refer to the generic Immersive virtual Environments) are a special type of IE where the simulation of the world is carried out using panoramic videos recorded from the real world. The panoramic videos can be obtained using specialized equipment or joining videos obtained from several cameras with different angles, as is our case. The reason to use panoramic videos is to increase the field of view. [A28] describes in detail the process followed to generate these videos and applies it to a wide variety of situations, like a football game, a rock concert and an outdoor mall.
A variation of these kind of environments are the Video-based Immersive environments, consisting on IE where the virtual world is rendered from videos taken from the real world to achieve a higher degree of realism [A27].
As a curiosity, Sharp developed a fully immersive video environment for the Huis Ten Bosch thematic park in Nagasaki, Japan, back in April 2011 [O12]. It was intended as a public attraction, called 5D Miracle Tour, composed of 156 LCD panels of 60 inches each.
1.1.1.2.
Uses and benefits of VE in the real world
The VR systems, and specifically the Immersive Environments, have been applied to many different fields. One of the initial uses of IE is training: it provides the chance to prepare the subjects before the real situations, providing a safe environment and, in many cases, great money savings in resources, personnel and equipment. The US government has developed a pioneer program for soldier training using HMD (Image 2 left) [O14], but it has been a long time since IE are being used to train pilots, drivers and even miners [O01]. There is a whole business sector dedicated to these simulators.
Another field where IE are causing a revolution is the medicine and health care [A18], where these systems are being applied for robot-assisted surgery, medical data visualization [O15], medical training [O14] and rehabilitation.
A third major field to which IE are being applied is the education sector, where platforms are being developed to monitor and stimulate [A30] learning, and enable interaction and collaboration among the users.
Of course, we cannot forget about the entertainment industry, which is making use of this technological revolution to embed IVE systems into gaming consoles [O03] and entertainment setups [O12].
A minor field of application of the immersive environments is performing user-based field studies through the use of IVE systems to simulate the field environment instead of performing the studies directly on the field. This small, but growing, field it the one our IVE system is applied to.
1.1.2.
Design and evaluation methodologies for VE
One of the most prolific authors researching the design, evaluation and interaction techniques for immersive virtual environments is Doug A. Bowman. A great part of this thesis report is based and/or guided by his work starting by [A10], where he provides an evaluation of the different motion techniques used to travel inside IE and introduces the taxonomy of these travel techniques, and the quality factors upon which the travel techniques are compared. While [A31] is centered solely on the taxonomy and QF introduced earlier, [A01] is more focused on defining the methodology to evaluate the different travel techniques. [A04] is a testbed evaluation of the common use interaction techniques, where the taxonomy of the interaction techniques is introduced, and formalized later at [A03] along with their design and evaluation methods. Most of the content published in these papers is thoroughly extended and explained at his doctoral dissertation [A32]. In [A02] he provides a detailed report of things to take into account when evaluating the VE system usability. Finally, [A29] is a very helpful and detailed investigation on the effects of the different travel techniques focused on the spatial orientation of the users, while [A30] is focused on the benefits that information-rich VE can provide to stimulate learning and comprehension through the use of symbolic and experimental information.
Evan A. Suma [A11] provides a different evaluation of the different travel techniques, focusing on the cognitive effects of real walking and virtual travel. Part of the evaluation process involves the SSQ, introduced by Robert Kennedy in 1993 [A13] and complemented with metrics in 1997 [A15]. A research summary of the SSQ was published in 2007 [A14]. In 2004, a revised and extended version of the SSQ was created: the RSSQ [A17], but though we revised it, finally we did not use it. Some other publications to extend our knowledge about the relations between virtual environments, speed and simulator sickness [A07, A08, A16, A34, A37, A39], but there is not much to say here about them.
About the user studies, [A35] and [A36] provided an overview from different focuses about the methods and good practices to follow when conducting user-based studies on VE, such as different methods to analyze and evaluate the results and the meaning of them.
Other evaluation methods considered for our testing were the Santa Barbara Sense Of Direction scale [A21], designed as a spatial ability self-reporting tool, the NASA-TLX [A22], which measures task-load effort, VEPAB [A06], a battery of tests designed to measure usability of VR systems, and VET [A24] designed to measure the user experience of VE.
1.1.3.
Other related work
Aside from the mentioned sources, some similar studies were revised and used to help us design our experimental setup. The first of them is a study of the application of VE to a vase museum [O16]. The second one is a study of the behavior of users inside a VE designed as a digital library [A40].
1.2.
Motivation
The use of immersive environments for user-based tests is a very useful alternative answer to the eternal question: Should I run my tests on the lab or on the field? In many cases it is possible to do better.
The field tests are closer to reality, but it might be very difficult to avoid the influence of outside factors. Besides, in most cases it is a more expensive choice than lab testing.
The laboratory tests are almost always the cheapest and fastest choice, there is a higher control of the conditions, and the influence of outside factors can be avoided. Still, conducting test in labs has the drawback that it's still a laboratory, and not the real world, and some important factors may be impossible or too difficult/expensive to reproduce them in the lab.
The usage of immersive environments for user testing allows the researcher to control the environmental conditions and recreate the real world. This way it is possible to get the best out of both choices: field and lab testing.
Our IVE was originally created with that specific aim: testing real world situations inside the lab. It was created by the Sitcom Lab at IFGI. Here (http://sitcom.uni-muenster.de/research) it is possible to find information about some of the research projects carried out there.
1.3.
Objectives
To successfully achieve our goal of simulating the travels between locations inside our custom IVE, we have several objectives to complete.
The first of them is to describe different methods to simulate the travel, and the available technologies that can be used for each method.
Secondly, we have to specify the desired characteristics that our travel transitions should have and choose the method and technology that fits them better.
Third, we need to determine a way to assess the usefulness of our travel transitions. We will search for different evaluation methods and select the one that fits better our needs. In the case that one is not sufficient, we will use a combination of them.
2.
Experimental Setup
In this section we are going to describe the kind of problem we are facing. To do so, we have to analyze our IVE, research for available technologies that could be used for our purpose and find the adequate evaluation methods to assess the usefulness of the travel movement simulation.
Once we have our problem fully defined, decided which technology we are going to use and selected the most adequate evaluation method, we will establish the steps we have to follow to build a prototype of the travel and to evaluate it.
2.1.
Problem description
In this section we will start by introducing the IVE system we are going to work with. After it we will see the different types of travel transitions we can create and the technologies available that we can use to implement them and the various evaluation methods that we can use to test our implementation. Finally the last two subsections are dedicated to analyze the travel prototype that we want to build and to decide the technology and evaluation methodology that suits our needs better.
2.1.1.
Our IVE
currently reproducing, but we are not going to need or use it for our experiment, so from now on we will omit any information about it.
The architecture of the system is notably fragmented, and in the diagram we only show the part of the system we are interested in. Each part of it has been built at different moments, by several different persons, without generating any documentation and using very different technologies for each part.
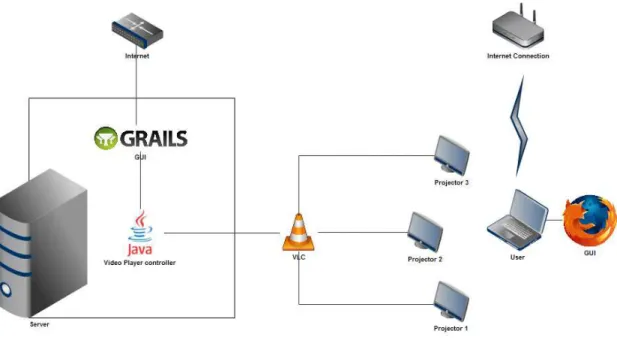
Figure 1 - Diagram of the IVE architecture
This custom IVE (Image 3) was designed with the purpose of conducting user studies as an alternative to the field providing a hybrid solution between field and lab, but it's functionality and uses have been extended when needed to match the requirements of the different investigations that have made use of it. More information about the Sitcom Lab and some of the investigations conducted using this IVE can be found at [O04].
2.1.2.
Technologies considered
using them. At Table 1 we can see the different kinds of travel transition that have been considered for our specific environment, along with a representation of the technologies that can be used to bring them alive and the pros and cons of each transition type.
The technologies chosen are not the only ones that can be used, in most cases these are plenty of similar technologies available, but the most representative. Also, only technologies with global coverage have been selected, and the technologies with limitations to one or just a few countries have been discarded completely. Finally, we have given top priority to the free and/or open technologies to minimize costs.
Table 1 - Types of travel transitions
Description Technology Benefits Drawbacks
Map
Displaying a map showing both the origin and destination of the travel
and some contextual information Google Maps, Open Street Maps, Bing Maps, Yahoo Maps
Simple and easy to implement.
Can be automatically generated. Can be
created on the go or previously
stored.
Non realistic. Only an abstraction of the world is shown
(map). Reduces presence Image slideshow Display a slideshow of images of the path between the origin and the destination. Panoramio, Flickr, Google Street View Relatively simple to implement. A temporal frame for
the images can be selected (day/night,
winter...)
Images might not be available. Path selected might not
be the user's choice. Time frames, resolution, luminosity... usually differ between images Real video
Display a video, or pieces of video, of the path between origin and destination 3-Camera system mounted to record the original videos of the
locations
Most realistic. If created specifically
for this purpose we can control
quality and consistency.
Most expensive solution. Long travels take very
long. Video files really huge. Virtual travel Virtual simulation of the travel between origin and destination. Different travel techniques can be used, like RW or flying.
Google Earth, Google Street View
Multiple travel techniques can be
simulated at speeds of our
choice. Information LOD easily adjusted. High realism capabilities. Automatic creation highly complex (yet). GE: places
with few or nonexistent 3D buildings produce
For the Map transition type, the most important technology is Google Maps. If we are looking for an open license, then OSM is the best representative.
Google Maps: The GM API [T05] provides a wild amount of functionality. It is possible to choose among different types of basemaps, zoom and orientation can be easily adjusted, same as the LOD of the displayed information, and the KML language can be used to import/export data from it. Among all the web map services available, it provides the vastest amount of functionality, language support, embedding options and geo-data available. Another advantage is the enormous community of users and developers behind it. Its services are managed under a proprietary license.
OpenStreetMaps: it runs under an open license, and all the information it provides has been created by volunteers. Several kinds of basemaps are available. The functionality provided by the API [T06] is limited compared to GM, and for some places the information is obsolete or nonexistent. Also, satellite imagery is not available from OSM.
Bing Maps [T14] and Yahoo Maps [T15] run also under a proprietary license. The functionality provided by their respective APIs is mostly if not completely covered by GM. Also, Yahoo Maps is about to be shut down soon after making partnership with Nokia.
For the Image Slideshow transition type, GSV provides a different approach than Panoramio or Flickr.
Google Street View contains a database of high quality georeferenced images that can be retrieved through its API [T07]. This images are obtained using specialized hardware with the purpose of picturing every street of every city. There are many emerging technologies similar to GSV, i.e. earthmine [O05], MapJack [O06], CycloMedia [O07], driveme.in [O08] and Bing Maps [T14]. Some of them provide an even better quality service than GSV, but most of them have severe coverage limitations (from just one city to a few countries), their services are paid-for, or no API is offered at all. GSV also has limitations and some streets are not covered, but still its coverage is far ahead of the rest.
of them is that those pictures, being freely uploaded by users, have different qualities, people are usually the main object, the georeferences can be inaccurate, no orientation is provided, and there many places without any picture.
The Real Video transition type has the potential to produce the best results, or at least the best image quality, for our specific problem, but at the expenses of very high costs and amount of resources. A great amount of hours and work would be needed to record and process the videos of every path we want to simulate, using very expensive specialized equipment and software. Also, the size of the video files is something to take into account, with an average size of 3 gigabytes per minute of processed footage. A very interesting Swiss technology, most appropriate for our purposes, was considered as an alternative, VideoStreetView [O09], but its coverage was very limited and it is no longer online, only to be found at the Internet Archives [O10].
The Virtual Travel transition type is a simulation of the travel in a virtual environment. For our case, the virtual environment is a representation of the real world.
Google Street View: as the API in its current state can only provide static imagery, one way to skip over this limitation is to perform the travels manually and use a desktop recording tool to save them as video files. Of course, this raises a whole new set of problems and limitations: the video output is limited to the display resolution, each travel must be recorded separately, it takes time to load and render the online data, routes for each travel must be planned in advance... And, as each new travel must be planned and manually recorded, this method implies spending a vast amount of time to generate them. Also, long-distance travels can take a lot of time or be utterly unfeasible.
choice. In the case of the tours, we will "fly" between locations at a SISO speed adjusted indirectly: we establish the time it should take to go from one location to another, and GE adapts the speed internally. The API in its current state doesn't provide an easy way to create those tours (we would have to create the camera movement by ourselves), and no way to save them as video files, but the Pro and Enterprise versions have a Movie Maker plug-in to save tours as video files.
Other: There are some other tools similar to GE, like OssimPlanet [T16] and NASA World Wind [T17], but none of them provide as much functionality (useful to us) as its rival.
Finally, we can enhance our prototype by using a combination of the presented technologies and/or adding textual information, maps, images, sounds, video effects (fades, overlays...), etc.
2.1.3.
Evaluation methods
From the wide variety of existing evaluation methodologies available, none was found that was specifically intended for immersive video environments and that could be applied to our case. Nonetheless, we could find some evaluation methods intended for virtual environments or for general/diverse purposes that we could directly use or adapt to suit our needs. A brief definition of the most important methods considered is provided next:
SSQ (Simulator Sickness Questionnaire): Developed by Kennedy et al. in 1993 [A13]. this method quantifies simulator sickness based on a list of 16 symptoms, rated using four levels of severity (none, slight, moderate, severe), divided in three subscales: nausea-, oculomotor- and disorientation-related symptoms. The total severity score is composed from these three subscales [A15]. The SSQ is currently the gold standard for measuring [Simulator Sickness] [A14].
RSSQ (Revised Simulator Sickness Questionnaire): Developed in 2004 by Do Hoe Kim, Donald E. Parker and Min Young Park [A17], it is based on the SSQ to measure simulator sickness. The list of symptoms is extended to 24 and distributed in 4 factors. The new factor added is Strain/Confusion. Instead of the 4-point scale used in the SSQ, a new 11-points (0=none, 11=very severe) scale is used for scoring.
SBSODS (Santa Barbara Sense Of Direction Scale): Developed in 2002 by Mary Hegarty, Anthony E. Richardson, Daniel R. Montello, Kristin Lovelace and Ilavanil Subbiah [A21]. It is a self-reporting method to quantify environmental spatial skills, commonly called sense of direction (SOD). The questionnaire consists of 15 questions, rated from 1 (strongly agree) to 7 (strongly disagree), about various environmental everyday tasks, like giving directions and estimating distances, and the sense of direction.
VRUSE (Virtual Reality Usability assessment tool): Developed in 1999 by Roy S. Kalawsky, [it] has been [specifically] designed to measure the usability of a VR system according to the attitude and perception of its users [A09]. It identifies 10 key usability factors of VR environments. It can be used both as an evaluation and a diagnostic tool for virtual environments, and produces great results when used in conjunction with other evaluation methods. The questionnaire has 100 questions divided in 10 sections, one per usability factor, and it can be adapted to suit the needs of specific environments.
VEPAB (Virtual Environments Performance Assessment Battery): Developed in 1995 by Donald R. Lampton et al.. [It consists] of an integrated battery of tasks to measure human performance in immersive virtual environments [A06]. It is one of the first methods published to evaluate human performance in IVE's, and it was initially intended [...] to determine those technologies that produce cost-effective transfer of training from VE practice to real-world performance, and practices for the effective use of these technologies [A06].
2.1.4.
Prototype analysis
According to Bowman [A10], the quality factors of travel in virtual environments are: speed, spatial awareness, information gathering and
presence. All these four factors are closely related to each other. Knowing this, we are going to analyze the nature of our travelling technique to set the importance of each of the factors. In [A10] 7 different quality factors are stated, but we have ruled out accuracy, ease of learning and ease of use from our factor list because they are unimportant to us, as we travel directly to specific locations, we have a 100% accuracy, also there is nothing to learn or to use in our travel technique because the user has no control over it.
If we review the taxonomy [A01] of travel techniques for virtual environments, the target selection would be a discrete selection from a list, but made by the evaluator, not by the user; the velocity/acceleration can be either constant or automatic (SISO); and the input conditions are automatic start and stop. We have selected these options among those we could use to be able to rule the existing system out of the evaluation as much as possible.
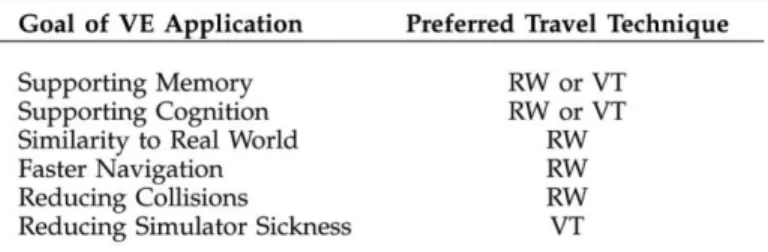
About the speed, Bowman [A10] demonstrated that jumping between locations produces disorientation. Also in the same study, we realize that constant speeds reduce disorientation, and that slower speeds increase spatial awareness and presence, but with the drawback that they may take a too long time. It also points out that the reason for the bad marks obtained, in that same investigation, in the SISO (slow-in slow-out) speed may have been in the implementation.
the RW is the equivalent of the low speed travel mentioned in [A10] and that the SISO travel is a version of VT. With this information, and taking another look at the mentioned table, we can see that both options are fine for our VE, but the slow speed (RW) has the drawback that it takes too long, so the virtual travel is better suited to our needs.
In [A10] we can also observe that the way of measuring the spatial awareness is to measure
the opposite: the
disorientation. One way we
can measure the
disorientation is by measuring the simulator sickness, and the virtual travel is also better at reducing it.
To increase the spatial awareness we will have to provide the information about where the user is and where he/she is travelling to. This is closely related to the information gathering factor: we have to provide the user with some information in a way that he is able to quickly understand that information. The information that should be provided to the user is the location of the origin and the destination and the orientation of the view in each of them. Providing information about the surroundings of both places and what lies between them can also help enhance the spatial awareness.
As for the presence, that means providing a travelling effect as close as possible to the real world. It doesn't mean that the travel has to be simulated as a real travel, but that it should provide the user with the "feeling" [A10] that he/she is going from some place to another. This rules out completely jumping between locations and leaves us with the choice of following a path between those locations or flying from the current one to the destination. If we travel the path at a slow speed, we would be using an equivalent of real walking, while in any other case it would be a virtual travel.
The aim of our IVE is to make you "feel" you are in a certain location, so the travel cannot take long because the user might get bored while waiting to arrive from one place to another in long travels. This fact discards the RW or slow speeds. The fast speeds produce disorientation and reduce presence [A01], so we have only left the SISO speed or a medium constant speed. In Figure 2 - Evaluation of the cognitive effects of travel
the case of a medium constant speed we face again the drawback of time: a long distance travel may take a too long time. This means that, for our purpose, we will have to settle for the SISO speed, and choose a good implementation of it that doesn't disrupt the sense of immersion or reduce spatial awareness.
Image 3 - Snapshot of our IVE from the user perspective
Summarizing, the characteristics (functional requirements) identified for our travel transition prototype are the following:
Speed: SISO (Slow-In Slow-Out).
Presence: provide a very realistic simulation of the travel.
Spatial awareness: provide the user with the location and orientation information.
Information gathering: provide the sufficient information in a meaningful way and at the right time.
If we include the system requirements, we add a few characteristics:
It must be an AVI video file
2.1.5.
Technological choice
Taking into account the previous description of the travel transition we want to prototype, from the previous list of transition types we can only use three of them: the video of the path, the Google Street View path, and the Google Earth path or flight (of course they can be combined with the map or the textual information).
The video of the path is ruled out because we have not enough resources for it in the long run: we cannot (meaning it would be an unnecessary waste of resources) take all the videos of the paths between each 2 locations manually (the number of videos has exponential growth) and nowadays there is no framework of georeferenced videos that would allow us to retrieve volunteered georeferenced that can be useful to us.
As for the Google Street View solution, the main drawback is that the current API does not yet allow the user to automate the creation of the transitions or even to program them, so far you can only get pictures from it and make a slideshow out of them. Also, there are many places that the GSV cannot or have not reached.
In Google Earth [T10] we have a different problem, which is also a problem in the GSV solution: we cannot create the videos automatically, only manually. In the case of GSV it can only be done with a desktop recording tool, while in GE we can use the movie maker plug-in in the pro version or use the desktop recording tool. An advantage of the GE approach is that the effect of the camera when flying from one place to another is SISO, and apart from the fact that we can tweak it in the preferences, it has been used and tested by all the millions of users of GE with a general satisfaction.
As stated earlier, in GE we can choose either to follow a path between locations, or fly directly from one point to another. In both cases the user can see the compass (orientation) and the location of the origin and destination, along with their surroundings and what lies between them. Knowing all this, we are left with two options that would suite our needs: GE flight or GE path. As the aim of our IVE is to reproduce the videos recorded for the locations, we can assume that the user is not so much interested in following a path from the origin to the destination as he is on arriving to the targeted location, so
the best technological choice in our case is the GE flying.
functionality to choose for him/herself. And as GE and GSV current APIs cannot provide this functionality yet, the path choice is again ruled out. And this problem exists also in the option of the video of the path: we cannot take videos of every possible path, and we cannot yet use VGI to retrieve them.
As a conclusion of this, we have decided to use the GE flying method to create the travel transitions, both because other choices have been discarded and because it provides the most efficient and promising method to generate the adequate travel transitions for our IVE. This means using Google Earth Pro and its Movie Maker plug-in.
Using Google Earth Pro for our purposes has its benefits: it grants a very realistic simulation of the world, it has a Movie Maker plug-in to save tours to video files, the amount of information displayed can be controlled and adjusted to match our needs and we can control the speed of the travel. Another reason to choose GE is that it has millions of users of all kinds, and thus it is permanently growing, so it is important to consider that future revisions of the API may provide sufficient functionality to create a program to automatically generate the travel simulations instead of having to do it manually. But another great benefit that will be of great importance to us is that it has one of the most, if not the most, used and tested implementations of the SISO speed, making it ideal for our system. Finally, the way that GE handles the SISO speed is ideal for our purposes: we decide how much time should be spent to fly between places and GE automatically adjusts the speed, meaning that all travel transitions will have the same time length regardless of the distance covered in the travel.
It's also important to mention that the simulation of the travel must be really close to the real world, because they will take place between videos of the real world and a non-realistic simulation would completely disrupt the sense of immersion by distracting the user and focusing his attention in the differences between the real and the simulated scenes.
There are several reasons why we have chosen this methods among all the considered methods. In the case of the SSQ and its competitor, the RSSQ, we chose the SSQ over the newer method because the RSSQ added unnecessary complexity to our evaluation, but mostly because the SSQ has already been used in plenty of user studies, of a very wide variety, with published results that could be used as a reference to know what outcomes we should be expecting.
The reasons to select the VRUSE among the rest is that most of the remaining methods were mostly oriented to the UI (user interface) capabilities and the user behavior and responses when interacting with it. As we wanted to isolate the already existing system as much as possible from our evaluation and focus on the travel prototypes, we are not interested in testing the GUI. The only method remaining still capable of testing the rest of the quality factors identified was the VRUSE.
To evaluate our travels we are going to create a tour video containing a shortened version of some of the videos of the locations and, between them, a simulation of the travel from each location to the next one. A group of users will be selected and evaluated.
2.2.
Prototype setup
To build our prototype we are going to need several software packages. The first and most important is the Google Earth Pro with its Movie Maker plug-in. This plug-in will let us save the tours of the transitions as video files. The output format is WMV 11 (Windows Media Video version 11). The maximum resolution we can use is 1920x1080px, so we will have to resize them to match the IVE videos. We can select a frame rate up to 50fps, but as the IVE videos are 25fps we will choose the same. We could choose a higher frame rate and downsample the videos later, but the result would be the same with the difference that it would take much longer to obtain the original video files from GE and to convert them to AVI. As we are not owners of a GE Pro license, we will order a free trial license that will work for 7 days, time enough to save the transitions to video files.
But the most important reason is that, among all the similar software, it was the only one that could handle the resolutions of our videos. In most of the similar tools, the output resolution is limited or can only be selected from a list of presets.
The last piece of software we will use is VirtualDub 1.9.11 [T12]. We will use this tool to paste together all the video files of the locations and the transitions into a single video file.
Apart from the software packages, we will also need the videos of the locations and their coordinates.
We have selected 9 places for our tour. That means creating 8 transitions to travel between the places, plus 2 extra transitions: the initial and final transitions. These two transitions differ from the rest in one key aspect: while all the regular transitions are related to two locations, these initial and final transitions are only related to one location. The initial transition will start with a view of the world, and zoom in until it arrives to the first place visited by our tour. The reason to include them is to introduce the user to that place's location, because if we started directly with the video of the first location, the user would not know where it is unless he already knew the place and recognized it, and the spatial awareness would be considerably reduced. The final transition is a similar but reversed version of the initial one: it starts at the last place visited and zooms out until we have a view of the world.
Now we will briefly explain the process of creating the transitions, but we can see a more detailed explanation in section 3.
To create the travel transitions we will first create, in GE, a placemark for each of the places we will visit and manually fix the orientation to match the videos' orientation. After that we will rename the transitions using the template NN - STREETNAME, where NN is a number corresponding to the order in which we will visit the places and STREETNAME is the name of the street(s) where the placemark is located. We will also change the icon of the location to the
numbered icons , each one with the number corresponding to their order.
Image 4 - GE Tour of a transition
2.3.
Evaluation setup
To properly evaluate our work, we have to make the user unaware of the system interface, architecture and usage. To achieve our goals we are going to select a set of places out of those contained in the system and create a video tour with a shortened version of the videos of the selected locations and the travel transitions in those locations. By doing this, we are isolating the transitions from the system so the knowledge of the user about the IVE becomes irrelevant.
As stated earlier in this document, the quality factors affecting our selected travel technique are the speed, the spatial awareness, the information gathering, and the sense of immersion or presence.
The first questionnaire (SSQ) measures the simulator sickness. It consists of two parts, one right before taking the tour and one before. It has been extracted from previous investigations [A07, A12] that demonstrated that people exposed to simulated motion can suffer from it. With this questionnaire we will evaluate the chosen speed.
The second questionnaire measures the system output, the simulation fidelity and the sense of immersion factors, corresponding to the information gathering, the spatial awareness and the presence respectively. The test takes place after the second part of the simulator sickness questionnaire. This test has been extracted from the VRUSE questionnaire, removing those parts that were irrelevant for our purposes.
Finally, a brief talk with the users after the experiment can provide some different feedback about their point of view and opinion.
To ensure that users answer all questions contained in the tests and that there is no human error while collecting the data (entering the results in the computer for further analysis), we are going to create an online version of the questionnaires (Pre-SSQ, Post-SSQ and VRUSE) using the forms of the Google Drive [T13] technology. This technology provides a very simple and fast way to create forms and share them online, collecting automatically all results in a spreadsheet that can be easily exported to many formats. Our interest is to export them to CSV text documents that can be opened both with R and with MS Excel to manipulate and analyze the data and create diagrams to present and interpret our results.
2.3.1.
SSQ
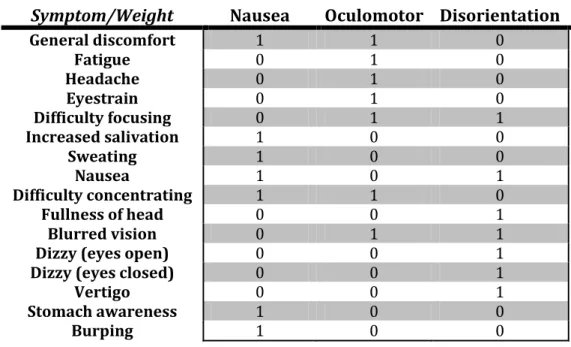
The SSQ [A13] evaluates a list of symptoms commonly experienced by users of VR systems. The reason to choose this questionnaire above any other is because it's considered the gold standard for measuring simulator sickness [A14]. They are evaluated with the scale from none, slight, moderated to severe (0-3). It is based on three components: nausea, oculomotor problems and disorientation, and they can be combined to produce a total SSQ score. All scores have their lowest level at 0, and they increase as the reported symptoms increase.
According to [A15], in VE the total scores usually average above 20, sometimes up to 50. For our system we are expecting scores around 25. Scores below 25 will indicate that the chosen speed is very good, scores between 25 and 50 indicate that the speed should be slightly reduced, and scores above 50 means either that the SISO speed is a bad choice or that the speed should be reduced considerably.
The list of symptoms and their weightings can be found at Table 2. To calculate the scores, we will use the table and the equations. First we calculate the total score for each of the three factors by multiplying the symptom scores by the weight and then calculating the sum for each column. The total score and the weighted scale scores for each of the column can be calculated using the following formulas:
𝑁𝑎𝑢𝑠𝑒𝑎𝑆𝑐𝑜𝑟𝑒=𝑁𝑎𝑢𝑠𝑒𝑎𝑡𝑜𝑡𝑎𝑙 ∗9.54
𝑂𝑐𝑢𝑙𝑜𝑚𝑜𝑡𝑜𝑟𝑆𝑐𝑜𝑟𝑒 = 𝑂𝑐𝑢𝑙𝑜𝑚𝑜𝑡𝑜𝑟𝑡𝑜𝑡𝑎𝑙 ∗ 7.58
𝐷𝑖𝑠𝑜𝑟𝑖𝑒𝑛𝑡𝑎𝑡𝑖𝑜𝑛𝑆𝑐𝑜𝑟𝑒 = 𝐷𝑖𝑠𝑜𝑟𝑖𝑒𝑛𝑡𝑎𝑡𝑖𝑜𝑛𝑡𝑜𝑡𝑎𝑙 ∗ 13.92
Table 2 - SSQ weighting system
Symptom/Weight
Nausea
Oculomotor Disorientation
General discomfort 1 1 0
Fatigue 0 1 0
Headache 0 1 0
Eyestrain 0 1 0
Difficulty focusing 0 1 1
Increased salivation 1 0 0
Sweating 1 0 0
Nausea 1 0 1
Difficulty concentrating 1 1 0
Fullness of head 0 0 1
Blurred vision 0 1 1
Dizzy (eyes open) 0 0 1
Dizzy (eyes closed) 0 0 1
Vertigo 0 0 1
Stomach awareness 1 0 0
Burping 1 0 0
Both questionnaires (pre and post exposure) contain the same set of questions. A printable version and the links to the online questionnaires are available in section 8.1.
Based on the profiled researched at [A14], the VE tend to produce more disorientation than nausea, and keeping the oculomotor scores as the lowest (D>N>O), while the profiles found for other environments were different: space sickness profile is O>D>N, and simulator sickness profile matches O>N>D.
2.3.2.
VRUSE
The second questionnaire is a subset of questions extracted from the VRUSE [A09] questionnaire. As there is no interface between the user and the system, we have removed from the original test those questions about the interface, the error handling, the user input… and used the remaining 36 questions for our test.
All questions are rated from 1 to 5, being 1 the worst and 5 the best score. This is called the Likert scale. As there are both positive and negative questions, we need to fix the scores later to obtain the real scores by subtracting the score of the negative questions from 6.
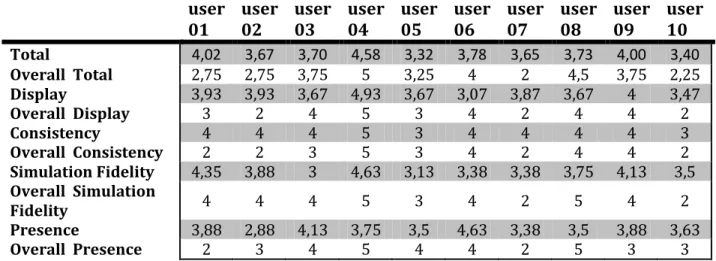
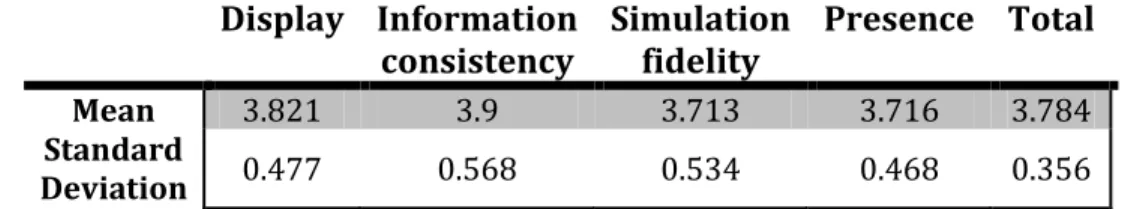
The extracted questions are divided in 4 different sections: System output (Display), Information consistency, Simulation fidelity and Sense of immersion (Presence). The last question of each section allows the user to provide an overall rating of the section, from 1 (best) to 5 (worst). The first two sections evaluate the spatial awareness, the third one evaluates the information gathering and the fourth section evaluates the sense of immersion, also called presence. From each section we will obtain 2 different scores: the average and the overall scores. Ideally they should be the same, or at least very similar, for each user.
The average and overall scores are useful to get a general overview of the evaluation of each section, but to identify specific problems or flaws we have to check the answers to each question, starting by those with the lowest scores.
As our scores are based on the Likert scale, we are considering all scores above 3 as good. The scores below 3 are bad scores, and are indicators of a problem.
2.3.3.
User group
To obtain significant results from the questionnaires we need a group of at least 4 persons, but to get better results (more homogeneous) we are going to test our prototype on 10 users.
The users selected are students from very different backgrounds (urban planning, social education, geography, computer science, institute…) and ages between 20 and 40. Most of them have never experienced any kind of IVE before.
The selection criteria was to call friends, fellow students and people working at IFGI in turns and ask them to volunteer as a test user.
3.
Travel Prototype
As we have previously stated, we are going to create a prototype of travel transition for our IVE, and we are going to evaluate our results. To evaluate our results we need the final user to appreciate the transitions in a context, so we are going to create a video tour containing both the transitions between places and the videos of those places in one single video file.
As the final size of the video would be around 200GB using the uncompressed video format of the original videos of the locations, we are going to use the Xvid codec to compress them without losing quality, but saving a huge amount of space, as the final size of the tour video is less than 1 GB.
3.1.1.
Locations
As our IVE contains a set of videos of locations in Münster, we have selected 9 of them to make our tour. These places are
all inside the Münster Zentrum (the center of Münster) and not far from each other. We can see a map of them in Image 7 (created in GE). The length of these videos is around 5 minutes, but we are going to shorten them to 90 seconds each to shorten the total length of the tour using AVC [T11]. There are two reasons to reduce the length of the videos to 90 seconds: the first reason is that they are too long for our purpose, and we want to center the attention in the transitions. The second reason is the reason why the videos aren't even shorter, which is that if we made them shorter the users would not have time to feel immersed. One and a half minutes is time enough for the user to watch around the simulated location and see a few people, cars, bicycles, etc. go by.
Each of the videos was recorded in a single spot, its coordinates were recorded using a high quality GPS, and the camera doesn't move at all during the video recording.
An example of one of these videos can be watched online at YouTube:
http://youtu.be/bf0rFYW77xc. The links to the rest of the videos used can be found at section 8.3, along with the URL of the KML file with the PlaceMarks of the locations. These sample videos are the 40" version, not the 90" version used in the tour, as the 90" videos would unnecessarily take a bigger amount of space. It is also possible that the videos will not work (you will only see a green screen during all video) when selecting the highest resolution. The most likely reason is that YouTube cannot handle such a big width (5760px), as it's three times the FullHD width (1920px).
Image 7 - Map of the places visited in the tour
3.1.2.
Transitions
each of them with a different view. One of the views resembles that of the video: the floor view (Image 10). The other view is the eagle view (Image 11), where you can see the Placemark from further away to give the user a better understanding of the surroundings.
Once we had both PlaceMarks for each place, we are going to create two more PlaceMarks: one with a view of the world and other with a view of Münster. They will be used for the initial and final transitions.
Now that we have all the PlaceMarks, we created a folder in GE for each of the 10 transitions, in which we pasted the PlaceMarks that will appear in each transition. All transitions contain 4 PlaceMarks. The first one starts with the world view, then Münster view, then the eagle view of the first place and finishes with the floor view. The last one is the same but in reverse order (floor view - eagle view - Münster - world). The rest of the transitions have a common structure: first the floor view of the origin place, second the eagle view of that same place, third the eagle view of the destination place, and finally the floor view of the destination place. The Image 8 shows an example of the directory tree created.
Once we have created all folders with the PlaceMarks ordered, we have to create a tour of each transition. To do so, first we tweak the GE touring options to adjust the speed, the total length of each travel between PlaceMarks and the time stopped on each one. With this we are making sure that the travel speed is neither too fast nor too slow. Also, the quality of the touring is raised to max quality to avoid jumps and get a smooth tour. With all this done, we can start creating the
Image 8 - Directory tree of the transitions in GE
tours in Google Earth. To adjust the speed, we selected a 10 seconds travel between features (meaning PlaceMarks) and 5 second waiting at them, as we can see in Image 9.
To display some textual information of the surroundings, we will have activated the following layers in GE: Borders and Labels, Places, Roads, 3D Buildings and Local Place Names. The remaining layers are kept deactivated, as their information is unimportant for our purposes.
Image 10 - Example of Floor View of a travel transition
Image 11 - Example of Eagle View of a travel transition
To create the videos of the transition tours, we need GE Pro Movie Maker, and select the highest resolution possible: HD+ (1920x1080 px).
As the average resolution of the videos of the places is 5760x1080, we had to trim and resize the transition videos to match this resolution. To resize and trim the transitions, the Any Video Converter free version program [T11] was used. An undesired, but unavoidable, side effect of this operation is the loss of the upper and lower parts of the videos, where the compass, GE logo and copyright information were displayed.
Image 12 - Transition example: flying between PlaceMarks 07 and 08
3.1.3.
Tour
The final result is a video tour containing the transitions and locations all in a single video file. What you can see in the video is a travel from a view of the world to Münster, and then to the first place we are going to visit (Schlossplatz). Then we can see the video of the first place. After 3 minutes, we see the transition travelling to the second place and the video of the second place after it and so on. After the last video of the locations is finished, the last transition zooms out to Münster and then to the Earth view, and there the tour ends.
Previous to creating the final video, we will first process the videos of the locations and the transitions with AVC [T11]. The videos of the locations have similar but different resolutions, they are raw video (uncompressed) in AVI format, the resolutions range from 5760x1080 to 4948x904 @ 25fps, their duration ranges from 5'10" to 2'48" and they have audio track. Their size ranges from 7 to 16 gigabytes. The videos of the transitions are in WMV format, 1920x1080 @ 25 fps and no audio track. The duration is 52" and the size is close to 100 megabytes.
To create one video file containing all the pieces, first we need to have these pieces in the same format. We are going to convert all the videos to AVI files compressed in Xvid with a bit rate of 12k, to keep as much quality as possible, with a resolution of 5760x1080 @ 25 fps and no audio track. The videos of the locations will be cut down to 1'30". From the transitions we will remove the first and last 4 seconds. The final size of the IVE videos is around 67 megabytes, and the transitions' size is around 30 megabytes.
After converting all the pieces, we will join them together with the VirtualDub [T12] software.
The characteristics of the video tour file obtained as a result of this process are the following:
Resolution: 5760x1080 pixels
Frame rate: 25 FPS
Size: 0.9 Gigabytes
Length: 20 minutes
File format: AVI
Codec: Xvid
On the following URL we can watch an online version of the tour:
4.
Evaluation
The evaluation of the prototype is very important to assess its quality. As stated earlier in this document, we are going to measure four quality factors: speed, spatial awareness, information gathering and presence. The speed is measured with the SSQ, and the rest are measured with the VRUSE.
A group of 10 users were selected for the evaluation process. The people selected belong to very different backgrounds (urban planning, social education, geography, computer science, high school…) and their ages range between 20 and 40. Most of them have never experienced any kind of IVE before. The selection criteria was to call friends, fellow students and people working at IFGI, and ask them to volunteer as a test user.
Image 15 - Group of users watching the tour during one of the evaluation sessions
The first questionnaire to be filled in by the test users is the SSQ, one time before (Pre-SSQ) and again after the exposition (Post-SSQ) to the IVE has finished. The questions are related to the symptoms the user feel at the precise moment the questionnaire is taken. Both questionnaires contains 16 questions. Each one takes 2-5 minutes to be completed. The URL to the online tests and a printable version can be found at section 8.1.
The second questionnaire is the VRUSE. It contains 36 questions, and takes from 10 to 20 minutes to be completed. It is the last questionnaire the users have to answer, right after the Post-SSQ. The questions in this questionnaire are technical questions related to the system and the simulation, and some users needed some help to understand the questions and fulfill it correctly. A printable version of the questionnaire and the URL to the online form can be found at section 8.2.
5.
Results
This section is divided in two parts. The first part is dedicated to the presentation of the results obtained in the questionnaires. The second part contains the analysis and interpretation of the obtained results.
5.1.
Presentation of results
The results obtained on the questionnaires will be presented by the use of tables, and the explanatory diagrams will be presented in the next section. We will show the scores already transformed and weighted per user and factor. The scores per user and question can be found in the annexes at the end of the document.
5.1.1.
SSQ results
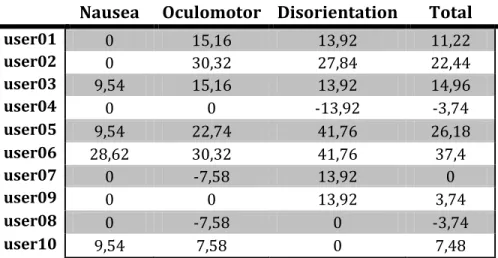
First we will see the mean results per user and total mean results of the Pre-SSQ questionnaire, then the Post-Pre-SSQ results, and after it the results of the difference between the post and the pre SSQ results. As a reminder, these tests are evaluating the adequateness of the speed technique used (SISO) and the speed itself. We are expecting a total score around 25, hopefully below it, and inside the range [0,50].
5.1.1.1.
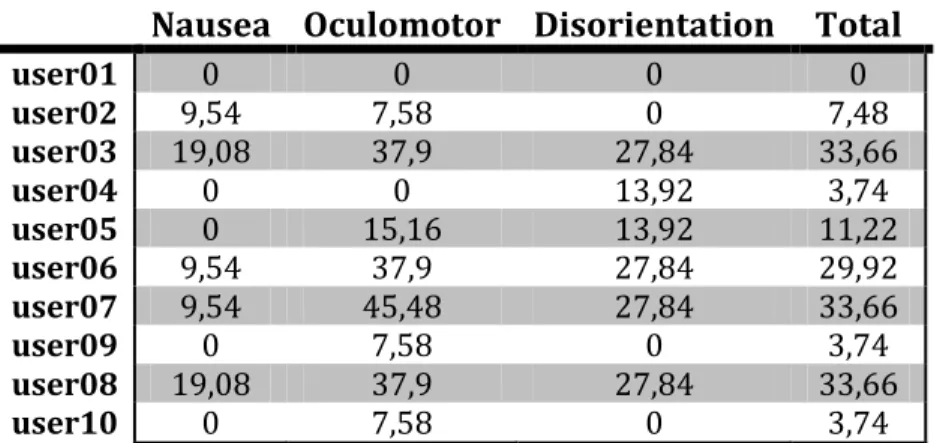
Pre-SSQ results
Below, at Table 3 we can see the scoring of each participant on the different factors measured by the SSQ and the total score. This test measures the state of the participants previous to the test. After it, Table 4 shows the mean and standard deviation of the scores of each factor and total.
It is usual to obtain very low scores in the Pre-SSQ (very close to 0), unless some external factor is affecting them, i.e. disease, tiredness...