Satellyptus: Analysis and database of microsatellites
from ESTs of
Eucalyptus
Paulo Cezar Ceresini
1, Cristina Lacerda Soares Petrarolha Silva
1,2, Robson Fernando Missio
3,
Elaine Costa Souza
1, Carlos Norberto Fischer
4, Ivan Rizzo Guillherme
4, Ivo Gregorio
4,
Eloiza Helena Tajara da Silva
5, Regina Maria Barreto Cicarelli
6, Marco Túlio Alves da Silva
6,
José Fernando Garcia
7, Gustavo Arbex Avelar
7, Laercio Ribeiro Porto Neto
7, André Ricardo Marçon
7,
Maurício Bacci Junior
8, Danyelle Cristine Marini
81
Institute of Plant Sciences/Phytopathology, Swiss Federal Institute of Technology, ETH-Zentrum, Zurich,
Switzerland / Universidade Estadual Paulista ‘Júlio de Mesquita Filho’ (UNESP), Departamento de
Fitossanidade, Eng. Rural e Solos, Ilha Solteira, SP, Brazil.
2
Faculdades Integradas Stella Maris, Fundação Educacional de Andradina, Andradina, SP, Brazil.
3UNESP, Departamento de Fitotectnia, Sócio-Economia e Tecnol. de Alimentos, Ilha Solteira, SP, Brazil.
4UNESP, Departamento de Estatística, Matemática Aplicada e Computação, Rio Claro, SP, Brazil.
5
UNESP, Departamento de Biologia, S.J. Rio Preto, SP, Brazil.
6
UNESP, Departamento de Ciências Biológicas, Araraquara, SP, Brazil.
7
UNESP, Departamento de Apoio, Produção e Saúde Animal, Araçatuba, SP, Brazil.
8UNESP, Centro de Estudos de Insetos Sociais, Rio Claro, SP, Brazil.
Abstract
The main goal of our research was to search for SSRs in theEucalyptus EST FORESTs database (using a software
for mining SSR-motifs). With this objective, we created a database for catalogingEucalyptus EST-derived SSRs,
and developed a bioinformatics tool, named Satellyptus, for finding and analyzing microsatellites in theEucalyptus
EST database. The search for microsatellites in the FORESTs database containing 71,115 Eucalyptus EST
sequences (52.09 Mb) revealed 20,530 SSRs in 15,621 ESTs. The SSR abundance detected on theEucalyptus
ESTs database (29% or one microsatellite every four sequences) is considered very high for plants.Amongst the
categories of SSR motifs, the dimeric (37%) and trimeric ones (33%) predominated. The AG/CT motif was the most frequent (35.15%) followed by the trimeric CCG/CGG (12.81%). From a random sample of 1,217 sequences, 343 microsatellites in 265 SSR-containing sequences were identified. Approximately 48% of these ESTs containing microsatellites were homologous to proteins with known biological function. Most of the microsatellites detected in Eucalyptus ESTs were positioned at either the 5’ or 3’ end. Our next priority involves the design of flanking primers for codominant SSR loci, which could lead to the development of a set of microsatellite-based markers suitable for
marker-assistedEucalyptus breeding programs.
Key words: bioinformatics tool, genetic markers, gene ontology, small sequence repeats, SSR.
Received: May 28, 2004; Accepted: June 21, 2005.
Introduction
Microsatellites, also described as polymorphic sim-ple sequence repeats (SSRs), are widely distributed, short, tandemly repeated sequences of 1-6 nucleotides. The uniqueness and importance of SSRs arise from their multiallelic nature, codominant inheritance, relative
abun-dance, extensive genome coverage and ease of detection by PCR using unique primers that flank and define the repeat (Powellet al., 1996). As a result of these characteristics, microsatellites have become the markers of choice for con-structing framework genetic maps in plants.
The standard method for the development of SSR markers involves the creation of a small insert genomic li-brary, a subsequent DNA hybridization selection and clone sequencing. Several hundreds of SSR markers in cultivated plants were developed with this methodology (Struss and Genetics and Molecular Biology, 28, 3 (suppl), 589-600 (2005)
Copyright by the Brazilian Society of Genetics. Printed in Brazil www.sbg.org.br
Send correspondence to Paulo Cezar Ceresini. Institute of Plant Science/Phytopathology, Swiss Federal Institute of Technology ETH, Zentrum, Universitaetstr. 2 / LFW-B28, CH-8092, Zurich, Switzerland. E-mail: [email protected].
Plieske, 1998; Ramsayet al., 2000). The growing body of genetic knowledge available in DNA and expressed se-quence tag (EST) databases has provided an alternative ap-proach for microsatellite detection. SSRs can be directly sourced in such databases, reducing the time and costs of microsatellite development. So far, identification of EST-derived microsatellites has been performed for some plant species, including grape (Scott et al., 2000), sugar cane (Cordeiro et al., 2001), wheat (Eujayl et al., 2002), rye
(Hackauf and Wehling, 2002) and barley (Thiel et al.,
2003).
A comparison of the repeat lengths of SSRs in clones from enriched librariesvs. SSRs derived from databases showed that the repeats found in libraries were significantly
longer (Ramsay et al., 2000). However, EST-derived
microsatellites offer the potential of more cost-effective data acquisition than standard libraries and other markers, such as single nucleotide polymorphisms (SNPs), restric-tion fragment length polymorphism (RFLP) and amplified fragment length polymorphism (AFLP). Because of their codominant inheritance, ESTs-derived SSRs are extremely useful as markers for genomic diversity and phylogenetic analyses in collections of clones presenting traits of agro-nomic interest as well as for genetic improvements and in building genetic linkage maps for localizing ESTs associ-ated with genes of putative functions.
Considering the availability of increasing amounts of genetic information generated by EST sequencing in the FORESTs Project (sponsored by FAPESP - Fundação de Amparo à Pesquisa do Estado de São Paulo), the
develop-ment of Eucalyptus microsatellite markers derived from
EST database becomes an attractive approach. The main objective of this research was to search, characterize and catalog theEucalyptusEST-derived SSR-motifs according to their abundance, information content, and genomic dis-tribution. The task of finding and analyzing microsatellites in a database of sequences requires specialized knowledge and laborious human effort. This task is greatly facilitated with the utilization of bioinformatics tools for accelerating information recovery from databases. For this purpose, a
database was created for cataloging Eucalyptus
EST-derived SSRs, and a bioinformatics tool, named
Satellyptus, was developed to help in the task of finding and analyzing microsatellites in theEucalyptusEST data-base. To our knowledge, this is the first time such a broad search for microsatellites in EST-databases and subsequent characterization and cataloging of potential SSR-based markers forEucalyptushas been attempted.
Materials and Methods
Data from EST libraries representing different spe-cies ofEucalyptus, originating from several tissues, devel-opmental stages and environmental conditions, were analyzed for the presence of SSRs. Preliminarily, poly-A and poly-T sequences corresponding to poly-A tail from
Eukaryotes were removed from EST libraries, observing the inexistence of any remaining (A)5or (T)5in a 50 bp win-dow, both in 3’ and 5’ ends respectively.
In order to align and group the reads in clusters, CAP3 script (Huang and Madan, 1999) was applied to the EST li-braries. The average size of sequences was around 700 bp, excluding 3’ extremities of longer sequences in order to in-crease the quality of analysis.
SSR search was performed in a complete data bank
including 71,115 EST consensus sequences from
Eucalyp-tus(representing a total of 52.09 Mb) grouped by library. MISA (MIcroSAtellite identification tool) software was used in the present study (http://pgrc.ipk-gatersleben.de /misa/) (Thielet al., 2003). This software allows the local-ization and identification of both perfect and composed microsatellites, the latter, in general, interrupted by mis-matched bases. Sequences were considered microsatellites if they showed repeated motifs ranging from one to six nu-cleotides. Using this approach, to be considered a micro-satellite, a sequence must present a minimum of 10 repeat units for mononucleotide motifs, 6 repeat units for dinu-cleotide motifs and 5 repeat units for all the motifs of larger size.
A random sample of 265 SSR-containing EST se-quences was characterized according to their gene function, considering previous information on automatic BLASTX homology comparisons, available at the FORESTs data-base. This random sample was obtained from the complete
Eucalyptus EST database by analyzing 1,217 sequences (862 kb) for SSR content in a partial backup dataset depos-ited at http://www.esalq.usp.br/ciagri (password-restricted access), which represented approximately 1.70% of the to-tal available data. Known protein sequences producing sig-nificantly high score hits withEucalyptusEST sequences were checked for their function against UniProt and Inter-Pro databanks deposited at the European Bioinformatics Institute - EBI (http://srs.ebi.ac.uk/) and grouped by their gene ontology using QuickGO, a fast web-based browser of Gene Ontology data information, also available at EBI (http://www.ebi.ac.uk/ego/).
The development of the Satellyptus system
A computational system named Satellyptus was con-ceived and developed to aid in the task of finding and
ana-lyzing microsatellites in the Eucalyptus EST database,
providing a way to integrate some bioinformatics tools and data generated along the mining and data analysis phases. The process for finding the microsatellites of interest utiliz-ing Satellyptus is accomplished in two stages: first, a data-base of microsatellites is generated; the second stage consists of the analysis of this database.
The bioinformatics tool named MISA, which is a PERL5 script (Thielet al., 2003), was utilized for identify-ing microsatellites in a large set of Eucalyptus EST se-quences. MISA processing generates two text files: one,
containing information relating to the microsatellites found in the sequences, and another containing statistics referring to the data analyzed.
Due to the difficulties in analyzing the great volume of data in text format generated by MISA, we developed a computational tool, called MSAT, which imports data from the MISA files to a relational database, created by our team as well. Some additional information was integrated into the microsatellite database. As the MISA script was indi-vidually run on subsets of data hierarchically grouped into distinctEucalyptusEST libraries, extra classification fields were incorporated into the microsatellite database by which
the data can be sorted by EST library and/orEucalyptus
species.
With the help of Satellyptus, it was possible to per-form several types of data recovery in order to obtain more specific information. Satellyptus also includes normaliza-tion procedures that aid in the understanding of the occur-rence and distribution of microsatellites in theEucalyptus
EST sequence database. For example, by using filters and classification for a givenEucalyptusEST library or species one can check for the occurrence of microsatellites in the database concerning the main motif categories detected, their nature (perfect or compound), and their size (repeat number). Other extremely useful information for selection of a particular microsatellite for genetic marker develop-ment is the relative position of microsatellites within an EST sequence (from 5’ to 3’ end). Therefore, by incorpo-rating both MISA information on the location of a particu-lar microsatellite in a given sequence and information from the EucalyptusESTs concerning the size (bp) of this se-quence, the microsatellites were categorized and labeled as I (initial), M (middle) or E (end) to incorporate data on their relative positions within the given sequence.
Satellyptus also allows for easy and fast integration, in the relational database, of data from annotation. For ex-ample, a function table option will provide information on known protein sequences, producing significantly high
score hits with Eucalyptus EST sequences containing
microsatellites. This function table option contains infor-mation on the putative protein functions (which were checked against UniProt and InterPro databanks deposited at EBI) and their gene ontology (which was determined us-ing QuickGO, also available at EBI). Figure 1 shows the steps for generation of theEucalyptusEST-derived micro-satellites database.
Results
The search for microsatellites in the complete
FOR-ESTs database containing 71,115 Eucalyptus EST
se-quences (representing a total of 52.09 Mb) revealed 20,530 SSRs in 15,621 ESTs (Table 1.A). This corresponded, on average, to one SSR-containing sequence every 3.9 ± 1.0 EST, or an average distance between two SSRs of approxi-mately 2,702 ± 365 bp. The average size of EST sequences
examined was 714 ± 85 bp. Approximately 3,799 EST se-quences contained more than one microsatellite, while in 2,784 sequences SSRs were present in compound forma-tion.
Similar results were observed with a random sample from the total database (Table 1.B). This random sample
was obtained from the completeEucalyptusEST database
Eucalyptusmicrosatellites 591
Figure 1- The generation of theEucalyptusEST-derived microsatellites database. (EST = expressed sequence tag, BLASTX = homology compar-ison tool, MISA = microsatellite identification tool, MSAT = computation tool which imports data from the MISA).
Table 1- MISA statistics of both complete and random sampling from the EucalyptusEST FORESTs database.
Sampling Observed values
A. CompleteEucalyptusEST database
Total number of sequences examined 71,115
Total size of examined sequences (thousands of bp) 52,094
Average size of examined EST sequences (bp) 714 ± 85
Total number of identified SSRs 20,530
Ratio of identified SSR: sequences examined 3.9 ± 1.00
Average distance between SSRs (bp) 2,702 ± 365
Number of SSR containing sequences (A) 15,621
Number of sequences containing more than 1 SSR 3,799
Number of SSRs present in compound formation 2,784
B. Random sample from the total database
Total number of sequences examined 1,217
Total size of examined sequences (thousands of bp) 862
Average size of examined EST sequences (bp) 741 ± 112
Total number of identified SSRs 343
Ratio of identified SSR: sequences examined 4.0 ± 3.0
Average distance between SSRs (bp) 2,759 ± 141
Number of SSR containing sequences (B) 265
Number of sequences containing more than 1 SSR 59
Number of SSRs present in compound formation 43
Percentage of the total sequences containing SSR sampled [(B/A)X100]
by analyzing 1,217 sequences (862 kb) for SSR content in a partial backup dataset deposited at http://mastin.ciagri.usp. br/genoma/ (USP/ESALQ/CIAGRI - Informatics Center), which represented approximately 1.70% of the total avail-able data. A total of 265 SSR-containing sequences were identified in this sample. Fifty-nine of these sequences con-tained more than one SSR, whereas 43 SSRs were present in compound formation. A total of 343 microsatellites were identified. This corresponded to an average of one SSR-containing sequence every 4.0 ± 3.0 EST, or a distance be-tween two SSRs of approximately 2,759 ± 141. The aver-age size of EST sequences examined from this random sample was 741 ± 112 bp.
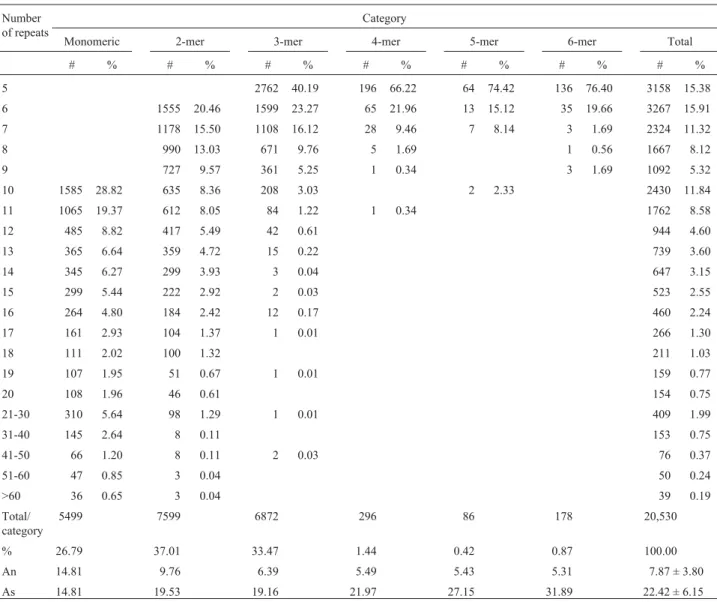
The proportion of SSR unit sizes observed in the complete FORESTs database was not evenly distributed: 5,499 (26.79%) were mononucleotide; 7,599 (37.01%) dinucleotide; 6,872 (33.47%) trinucleotide; 296 (1.44%)
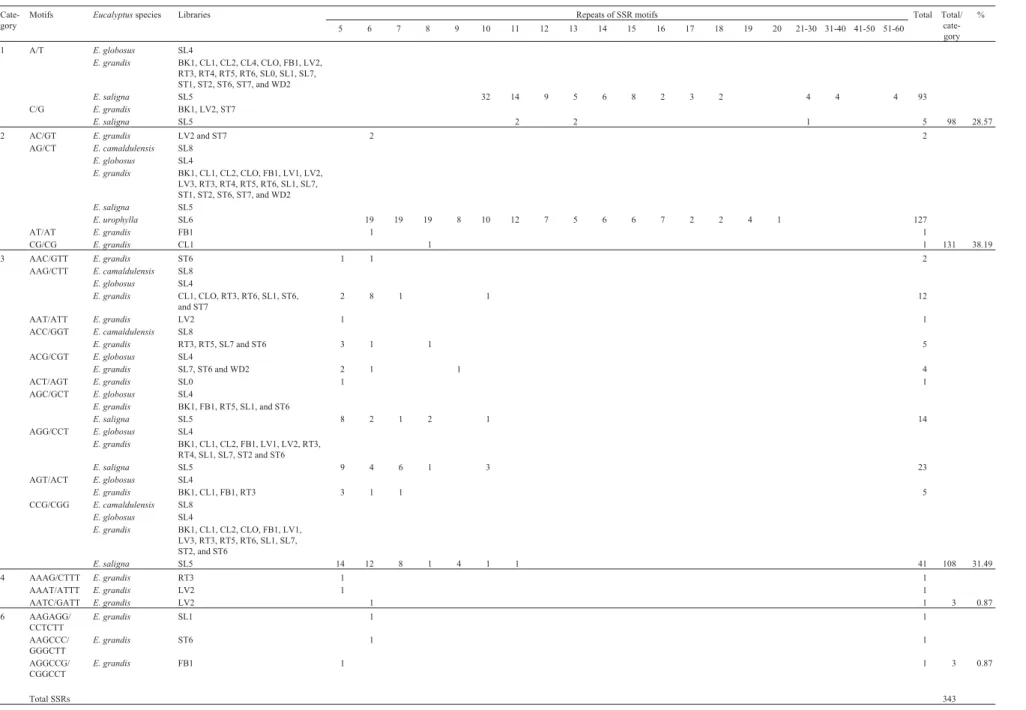
tetranucleotide; 86 (0.42%) pentanucleotide; and 178 (0.87%) hexanucleotide (Table 2; Appendix Table, avail-able upon request or at the site https://forests.esalq.usp.br; password-restricted access). A similar trend in SSR unit size abundance was observed with the random sample from the total database (Table 3). From a total of 343 micro-satellites sampled, 98 (28.57%) were mononucleotide, 131 (38.19%) dinucleotide, 108 (31.49%) trinucleotide, and 6 (1.74%) either tetra or hexanucleotide. No pentanucleotide motifs were detected.
The distribution of the number of repeats across the SSR motif categories analyzed is presented in Figure 2 and Table 2. In general, for any of the SSR motif categories, the peak of the distribution was at the lowest number of repeats. Approximately 48% of monomeric microsatellites were of 10 to 11 repeats, whereas 59% of dimeric microsatellites were between 6 and 9 repeats, and 89.6% of trimeric
592 Ceresiniet al.
Table 2- Occurrence of individual motif categories among the set of 20,530 microsatellites from the totalEucalyptusEST FORESTs database*.
Number of repeats
Category
Monomeric 2-mer 3-mer 4-mer 5-mer 6-mer Total
# % # % # % # % # % # % # %
5 2762 40.19 196 66.22 64 74.42 136 76.40 3158 15.38
6 1555 20.46 1599 23.27 65 21.96 13 15.12 35 19.66 3267 15.91
7 1178 15.50 1108 16.12 28 9.46 7 8.14 3 1.69 2324 11.32
8 990 13.03 671 9.76 5 1.69 1 0.56 1667 8.12
9 727 9.57 361 5.25 1 0.34 3 1.69 1092 5.32
10 1585 28.82 635 8.36 208 3.03 2 2.33 2430 11.84
11 1065 19.37 612 8.05 84 1.22 1 0.34 1762 8.58
12 485 8.82 417 5.49 42 0.61 944 4.60
13 365 6.64 359 4.72 15 0.22 739 3.60
14 345 6.27 299 3.93 3 0.04 647 3.15
15 299 5.44 222 2.92 2 0.03 523 2.55
16 264 4.80 184 2.42 12 0.17 460 2.24
17 161 2.93 104 1.37 1 0.01 266 1.30
18 111 2.02 100 1.32 211 1.03
19 107 1.95 51 0.67 1 0.01 159 0.77
20 108 1.96 46 0.61 154 0.75
21-30 310 5.64 98 1.29 1 0.01 409 1.99
31-40 145 2.64 8 0.11 153 0.75
41-50 66 1.20 8 0.11 2 0.03 76 0.37
51-60 47 0.85 3 0.04 50 0.24
>60 36 0.65 3 0.04 39 0.19
Total/ category
5499 7599 6872 296 86 178 20,530
% 26.79 37.01 33.47 1.44 0.42 0.87 100.00
An 14.81 9.76 6.39 5.49 5.43 5.31 7.87 ± 3.80
As 14.81 19.53 19.16 21.97 27.15 31.89 22.42 ± 6.15
Eucalyptus
microsatellites
593
Table 3- Occurrence of individual SSR motifs among the set of 343 microsatellites from the random sampling of theEucalyptusEST FORESTs database.
Cate-gory
Motifs Eucalyptusspecies Libraries Repeats of SSR motifs Total Total/
cate-gory
%
5 6 7 8 9 10 11 12 13 14 15 16 17 18 19 20 21-30 31-40 41-50 51-60
1 A/T E. globosus SL4
E. grandis BK1, CL1, CL2, CL4, CLO, FB1, LV2, RT3, RT4, RT5, RT6, SL0, SL1, SL7, ST1, ST2, ST6, ST7, and WD2
E. saligna SL5 32 14 9 5 6 8 2 3 2 4 4 4 93
C/G E. grandis BK1, LV2, ST7
E. saligna SL5 2 2 1 5 98 28.57
2 AC/GT E. grandis LV2 and ST7 2 2
AG/CT E. camaldulensis SL8
E. globosus SL4
E. grandis BK1, CL1, CL2, CLO, FB1, LV1, LV2, LV3, RT3, RT4, RT5, RT6, SL1, SL7, ST1, ST2, ST6, ST7, and WD2
E. saligna SL5
E. urophylla SL6 19 19 19 8 10 12 7 5 6 6 7 2 2 4 1 127
AT/AT E. grandis FB1 1 1
CG/CG E. grandis CL1 1 1 131 38.19
3 AAC/GTT E. grandis ST6 1 1 2
AAG/CTT E. camaldulensis SL8
E. globosus SL4
E. grandis CL1, CLO, RT3, RT6, SL1, ST6, and ST7
2 8 1 1 12
AAT/ATT E. grandis LV2 1 1
ACC/GGT E. camaldulensis SL8
E. grandis RT3, RT5, SL7 and ST6 3 1 1 5
ACG/CGT E. globosus SL4
E. grandis SL7, ST6 and WD2 2 1 1 4
ACT/AGT E. grandis SL0 1 1
AGC/GCT E. globosus SL4
E. grandis BK1, FB1, RT5, SL1, and ST6
E. saligna SL5 8 2 1 2 1 14
AGG/CCT E. globosus SL4
E. grandis BK1, CL1, CL2, FB1, LV1, LV2, RT3, RT4, SL1, SL7, ST2 and ST6
E. saligna SL5 9 4 6 1 3 23
AGT/ACT E. globosus SL4
E. grandis BK1, CL1, FB1, RT3 3 1 1 5
CCG/CGG E. camaldulensis SL8
E. globosus SL4
E. grandis BK1, CL1, CL2, CLO, FB1, LV1, LV3, RT3, RT5, RT6, SL1, SL7, ST2, and ST6
E. saligna SL5 14 12 8 1 4 1 1 41 108 31.49
4 AAAG/CTTT E. grandis RT3 1 1
AAAT/ATTT E. grandis LV2 1 1
AATC/GATT E. grandis LV2 1 1 3 0.87
6 AAGAGG/
CCTCTT
E. grandis SL1 1 1
AAGCCC/ GGGCTT
E. grandis ST6 1 1
AGGCCG/ CGGCCT
E. grandis FB1 1 1 3 0.87
microsatellites were of 5, 6 or 7 repeats. Eighty-eight to 96% of the tetra, penta or hexameric SSRs were of 5 to 6 re-peats. The greater the complexity of the microsatellite mo-tifs analyzed, the smaller the number of repeats found. The average number of repeats varied from 14.81 for monomeric, 9.76 for dimeric, 6.39 for trimeric, to 5.41 ± 0.09 for tetra, penta or hexameric SSRs. The average num-ber of repeats across all motifs analyzed was 7.87 ± 3.80. This has led to rather small microsatellites sizes within the
Eucalyptus EST sequences. The average size of a microsatellite across all categories of SSR motifs was 22.42 ± 6.15 bp. However, the microsatellite sizes varied from 14.8 (monomeric), 19.4 (dimeric and trimeric), 22.0 (tetrameric), 27.2 (pentameric) to 31.9 bp (hexameric SSRs).
The occurrence of individual SSR motifs among the set of 20,530 microsatellites, which were found in the 71,115EucalyptusEST sequences (hierarchically grouped into distinct libraries) is summarized in the Appendix Ta-ble. Regarding monomeric SSRs, the A/T motif was more common (22.57%) than the G/C one, which represented 4.22% abundance. Among dimeric SSRs, the AG/CT motif was by far the most common one (35.13%); AC/GT, AT/AT and CG/CG all together were represented at low
abundance (from 0.18 to 1.03% of the total). The most-frequent trimeric microsatellite motifs were CCG/CGG
(12.81%), AGG/CCT (7.01%), AAG/CTT (4.78%),
AGC/GCT (3.49%) and ACG/CGT (2.13%). In general, considering the low-abundant tetra, penta and hexa-nucleotide motifs (with abundance varying from 0.044 to 0.22%), the most frequent SSR motifs were AGGT/ACCT, AGCG/CGCT, AGGG/CCCT and AAGG/CCTT (tetra-meric), ACACG/CGTGT, AGAGG/CCTCT, AAACC/
GGTTT, AAGCC/GGCTT and AATCG/CGATT
(pentameric), AGGCCG/CGGCCT, AGAGGG/CCCTCT, AGCCCC/GGGGCT, AGCGGT/ACCGCT, AACGGC/ GCCGTT, AGCGGC/GCCGCT, AGGCGG/CCGCCT and AAGAGG/CCTCTT (hexameric).
Table 3 summarizes the occurrence of individual SSR motifs among the set of 343 microsatellites, which were found in the random sample of 1,217EucalyptusESTs. The results were rather similar to the ones observed when ana-lyzing the total database. Of the two monomeric SSRs de-tected, the A/T motif was much more common (27.11%) than the G/C one, which represented only 1.46% abun-dance. Among dimeric SSRs, the AG/CT motif was by far the most common (37.03%), whereas AC/GT, AT/AT and CG/CG all together were represented at low abundance (from 0.29 to 0.58% of the total). The most frequent trimeric microsatellite motifs were CCG/CGG (11.95%), AGG/CCT (6.71%), AGC/GCT (4.08%), AAG/CTT (3.50%), and ACG/CGT, ACC/GGT or AGT/ACT (vary-ing from 1.17 to 1.46%). Differences between the two datasets were observed considering the low-abundant tetra nucleotide (with abundance of 0.87%). The tetrameric SSR motifs detected (AAAG/CTTT, AAAT/ATTT, and AATC/ GATT) were not amongst the most common ones observed in the complete database. However, the hexameric SSRs detected (AGGCCG/CGGCCT, and AAGAGG/CCTCTT, AAGCCC/GGGCTT), were present with similar abun-dance in both datasets.
The distribution of the relative position (5’ to 3’ end) of microsatellites along a particular SSR containing se-quence was analyzed in the random sample of the
Eucalyp-tus EST database (Table 4). From a total of 343 SSRs,
approximately 160 (46.65%) of the microsatellites were found closest to the start of the EST sequence (between 0
594 Ceresiniet al.
Figure 2- Distribution of the number of repeats across the SSR motif cate-gories detected in the 20,530 microsatellites found in theEucalyptusEST FORESTs database.
Table 4- Distribution of the relative position (5’ to 3’ end) of microsatellites alongEucalyptusEST sequences containing SSRs in the random sampling of the database.
Relative position (in terms of proportion of the total EST sequence length)* Total number of SSR analyzed
0.00-0.15 0.151-0.35 0.351-0.65 0.651-0.85 0.851-1.00
I IM M ME E
Number of SSRs 160 80 57 18 28 343
% 46.65 23.32 16.62 5.25 8.16 100.00
and 15% of total sequence length, starting at the 5’ end), whereas 28 (8.16%) were located closest to the 3’ end (be-tween 85.1 to 100% of the total sequence length). The
re-maining 155 SSRs (45.19%) were distributed
intermediately along the EST sequences.
The random sample of 265 SSR-containing EST se-quences was characterized according to their gene function, considering previous information on automatic BLASTX homology comparisons, available at the FORESTs data-base. The information on gene ontology is available in Ta-ble 5. Fifty-two of the total SSR-containing EST sequences (19.62%) produced no hits with any known proteins se-quences, whereas 87 (32.83%) had homology with
hypo-thetical, putative, unknown or Arabidopsis thaliana
expressed proteins (but with unknown function). A total of 126 (47.55%) EST sequences containing microsatellites were homologous to proteins with known biological func-tion. From these, 47 (17.74%) were classified as involved in biological processes such as cell communication, embry-onic development, cellular physiological process, metabo-lism, pathogenesis, response to external stimulus, or of unknown physiological process. Of the biological function related proteins, which had homology withEucalyptusEST sequences bearing SSRs, the ones associated with metabo-lism were the most frequent within this category (a total of 32, or 12.08%). The metabolism proteins were associated with biosynthesis processes, with metabolism of carbohy-drate, nucleobase, nucleoside, nucleotide and nucleic acid, organic acid, oxygen and reactive oxygen species, phos-phorus, and protein, with catabolism, and electron trans-port.
The majority of the SSR-containing EST sequences (a total of 69, or 26.04%) were homologous with proteins of molecular functions, such as binding (30), catalytic (29), transporter (6), chaperone (1), enzyme regulator (1), signal transducer (1), and structural molecule (ribosome) activity (1). Of the binding activity category homologous proteins, the ones associated with nucleic acid binding (17) and metal ion binding (7) were the most frequent. In the cata-lytic proteins group, the following categories were de-tected: transferase (9), hydrolase (7), kinase (4), lyase (2), small protein activating enzyme (2), helicase (1), isomerase (1), and oxidoreductase (1) activity.
The last category of proteins homologous to EST se-quences containing SSRs were the cellular component ones (a total of 10, representing 3.77%), which were intracellular
(associated with the mitochondrion, or as
ribonucleoprotein complex), integral to membrane
(pro-ton-transporting two-sector ATPase complex), with
extracellular or unlocalized functions.
Discussion
Microsatellites or SSRs are considered preferred ge-netic markers in plants for several reasons, such as their rel-ative abundance and random distribution on the genome,
Eucalyptusmicrosatellites 595
596
Ceresini
et
al.
Gene ontology (GO), GO code, and correspondent number of sequences detected in a particular category*
electron transport (GO:0006118) 1
nucleobase, nucleoside, nucleotide and nucleic acid metabolism (GO:0006139)
9 DNA metabolism (GO:0006259) 2 DNA packaging (GO:0006323) 1
DNA repair (GO:0006281) 1
nucleobase metabolism (GO:0009112)
1 purine base metabolism (GO:0006144)
1
RNA metabolism (GO:0016070) 1 tRNA processing/ splicing (GO:0008033)
1
transcription (GO:0006350) 5 transcription, DNA-dependent (GO:0006351)
5
organic acid metabolism (GO:0006082)
2 carboxylic acid metabolism (GO:0019752)
2 amino acid metabolism (GO:0006520)
1
fatty acid metabolism (GO:0006631) 1
oxygen and reactive oxygen species metabolism (GO:0006800)
1 response to oxidative stress (GO:0006979)
1
phosphorus metabolism (GO:0006793)
3 phosphate metabolism (GO:0006796) 3 protein amino acid phosphorylation (GO:0006468)
2
polyphosphate metabolism (GO:0006797)
1
protein metabolism (GO:0019538) 3 protein modification (GO:0006464) 2 ubiquitin cycle (GO:0006512) 1
protein ubiquitination (GO:0016567) 1
protein targeting (GO:0006605) 1 protein-nucleus import (GO:0006606) 1
pathogenesis (GO:0009405) 3
response to stimulus (GO:0050896) 1 response to external stimulus (GO:0009605)
1 response to abiotic stimulus (GO:0009628)
1 response to water (GO:0009415) 1
unknown function 1
Cellular component (GO:0005575) 10 cell (GO:0005623) 8 intracellular (GO:0005622) 3 cytoplasm (GO:0005737) 2 mitochondrion (GO:0005739) 2
ribonucleoprotein complex (GO:0030529)
1
membrane (GO:0016020) 5 integral to membrane (GO:0016021) 4 proton-transporting two-sector ATPase complex (GO:0016469)
1
others 3
extracellular (GO:0005576) 1
unlocalized (GO:0005941) 1 beta-galactosidase complex (GO:0009341)
Molecular function (GO:0003674) 69 binding (GO:0005488) 30 metal ion binding (GO:0046872) 7 calcium ion binding (GO:0005509) 1
transition metal ion binding (GO:0046914)
5 zinc ion binding (GO:0008270) 5
zinc 1 zinc-finger. 1
nucleic acid binding (GO:0003676) 17 DNA binding (GO:0003677) 15 transcription factor activity (GO:0003700)
4
others 11
RNA binding (GO:0003723) 2
nucleotide binding (GO:0000166) 5 purine nucleotide binding (GO:0017076)
5 adenyl nucleotide binding (GO:0030554)
4 AT binding 4
guanyl nucleotide binding (GO:0019001)
1 GT binding 1
protein binding (GO:0005515) 1 cytoskeletal protein binding (GO:0008092)
1 actin binding (GO:0003779) 1
catalytic activity (GO:0003824) 29 helicase activity (GO:0004386) 1
hydrolase activity (GO:0016787) 7 hydrolase activity, acting on ester bonds (GO:0016788)
5 carboxylic ester hydrolase activity (GO:0016789)
Eucalyptus
microsatellites
597
Gene ontology (GO), GO code, and correspondent number of sequences detected in a particular category*
hydrolase activity, hydrolyzing O-glycosyl compounds (GO:0004553)
2
nuclease activity (GO:0004518) 1
phosphoric ester hydrolase activity (GO:0042578)
1
peptidase activity (GO:0008233) 2 endopeptidase activity (GO:0004175) 1
others 1
isomerase activity (GO:0016853) 1
kinase activity (GO:0016301) 4 nucleobase, nucleoside, nucleotide kinase activity (GO:0019205)
2 adenosine kinase activity (GO:0004001)
1
guanylate kinase activity (GO:0004385)
1
protein kinase activity (GO:0004672) 2 protein threonine/tyrosine kinase ac-tivity (GO:0004712)
1
transferase activity, transferring phos-phorus-containing groups (GO:0016772)
1
lyase activity (GO:0016829) 2 carbon-oxygen lyase activity (GO:0016835)
2 carbon-oxygen lyase activity, acting on phosphates (GO:0016838)
1
hydro-lyase activity (GO:0016836) 1
oxidoreductase activity (GO:0016491)
1 oxidoreductase activity, acting on CH-OH group of donors (GO:0016614)
1
small protein activating enzyme activ-ity (GO:0008641)
2 ubiquitin activating enzyme activity (GO:0004839)
2
transferase activity (GO:0016740) 11 transferase activity, transferring acyl groups (GO:0016746)
2
transferase activity, transferring glycosyl groups (GO:0016757)
3
transferase activity, transferring ni-trogenous groups (GO:0016769)
1
transferase activity, transferring sul-fur-containing groups (GO:0016782)
1
others 4
chaperone activity (GO:0003754) 1
enzyme regulator activity (GO:0030234)
1 enzyme inhibitor activity (GO:0004857)
1 protease inhibitor activity (GO:0030414)
1 cysteine protease inhibitor activity (GO:0004869)
1
signal transducer activity (GO:0004871)
1 receptor activity (GO:0004872) 1 transmembrane receptor activity (GO:0004888)
1 non-G-protein coupled 7TM receptor activity (GO:0004926)
1
structural molecule activity (GO:0005198)
1 structural constituent of ribosome (GO:0003735)
1
transporter activity (GO:0005215) 6 carrier activity (GO:0005386) 3 electrochemical potential-driven transporter activity (GO:0015290)
2 sugar porter activity (GO:0005351) 1
sulfate porter activity (GO:0008271) 1
electron transporter activity (GO:0005489)
2
physiological process (GO:0007582) 1 cell growth and/or maintenance (GO:0008151)
1 peptide transport (GO:0015833) 1
Expressed protein 26 9.81% Hypothetical protein 13 4.91%
Putative protein 21 7.92%
Unknown protein 27 10.19%
No hits found 52 19.62%
Total 265
high polymorphism (multiallelic nature), codominant in-heritance in a Mendelian fashion, somatic stability, selec-tive neutrality and simple detection by PCR using two unique primers flanking the microsatellites (Morgante and Olivieri, 1993; Powellet al., 1996). However, the use of SSR-markers is not as extensive or widespread as desired, considering that the standard methods for developing SSR-markers are time consuming and labor-intensive, re-quiring the creation of small-insert libraries, hybridization with tandemly repeated oligonucleotides and sequencing of candidate clones (Brondaniet al., 1998).
The development of EST-derived microsatellite markers has advantages over the traditional method as they can be considered freely obtained by-products from EST sequences databases, with minimal development costs. Thus, for reducing time and development costs, the main goal of our research was to search for SSRs in the
Eucalyp-tus EST FORESTs database (using software for mining
SSR-motifs). The other objective was to characterize and catalog theEucalyptusEST-derived SSR-motifs according to their abundance, information content, and genomic dis-tribution. With this objective, we created a database for
cat-aloging Eucalyptus EST-derived SSR, and developed a
bioinformatics tool, named Satellyptus, for finding and an-alyzing microsatellites in theEucalyptusEST database.
The frequency of occurrence of SSRs on expressed sequences is considered, in general, low due to an associ-ated lower polymorphism of coding regions in contrast to non-coding ones. The occurrence of particular micro-satellites motifs and repeats (especially the non-trimeric ones) could have implications on how the gene coding re-gion is transcribed, due to risks of frameshift mutations that may occur when other microsatellites classes alternate in size of one unit (Metzgaret al., 2000).
However, out of a total of 71,115EucalyptusEST se-quences analyzed, 20,530 microsatellites were detected. This resulted in the identification of one microsatellite for every four examined sequences or a total abundance of 29%, which is considered relatively high according to the literature available. For example, Thielet al.(2003) have detected a ratio of one microsatellite identified out of every
12 barley (Hordeum vulgare) EST sequences (abundance
of 8.2%). The SSR abundance detected on theEucalyptus
ESTs database is still in disagreement with that observed for other plant species, such as grapes and sugarcane, for which the frequency and abundance ratio varied from 3.1% (1:32) to 2.9% (1:34), respectively (Scott et al., 2000; Cordeiroet al., 2001)
Comparing the average distance (kb) between two
SSRs in theEucalyptusESTs with information of
micro-satellites on cDNA libraries from other plant species, the
frequency of SSR detected onEucalyptusESTs was found
to be very high. For example, while an Eucalyptus
EST-contained microsatellite was detected every 2.7 kb, the following higher distance values between two SSRs
were observed: 3.4 for rice, 6.3 for barley, 8.1 for corn, 7.4 for soybean, 11.1 for tomato, 13.8 forArabidopsis, and 20 for cotton (Cardleet al., 2000; Thielet al., 2003).
Despite the high frequency of microsatellites on Eu-calyptus ESTs, only approximately 45% (or 9,277 SSR-containing sequences) will be appropriate for the de-sign of flanking primers aiming the development of micro-satellite markers, since the remaining 54.8% of the EST sequences contained SSRs situated too close to either 5’ or 3’end of the sequences. Therefore, from a initial abundance ratio of 1:4, only one SSR every eight sequences could be effectively utilized for developing markers based on the amplification of the flanking region containing the SSR lo-cus.
Considering the average size of any SSR motif de-tected onEucalyptusESTs, 97% of the microsatellites were smaller than 20 bp, in concordance with that observed for other plant species (Thielet al., 2003).
Of the categories of SSR motifs detected on Eucalyp-tusESTs, the dimeric (37%) and trimeric ones (33%) pre-dominate. The AG/CT motif in particular was the most frequent one (35.15%) in the entire database, in agreement with the available literature onEucalyptusmicrosatellites (Brondaniet al., 2002). All the remaining dimeric motifs (AC/GT, AT/AT and CG/CG) were detected in low fre-quency/abundance. The number of motif repeats, however, interferes with the level of the marker’s polymorphism. The highest level of polymorphism onEucalyptus(22 alleles) was observed at a locus composed by a dinucleotide motif based on 15 AG repeats, whereas the lowest level (7 alleles) was detected with 18 AG repeats (Brondaniet al., 2002). Similar results have been reported forPinus (Echt et al., 1999), where longer repeats are associated with lower poly-morphism. Despite the low frequency of AC motif repeats in plant genome (Morgante and Olivieri, 1993), the levels of polymorphism were similar for both AC and AG motifs inEucalyptus(Brondaniet al., 2002).
Repetitive motif structure did not seem to be an indi-cator of polymorphism forEucalyptus. For eight imperfect and nine compound sequences characterized by Brondani
et al.(2002), the genetic information content was high and similar to that observed for perfect repeats. Compound microsatellites were also detected within the same se-quence of a particularEucalyptusEST (13.6% of the total SSR found), which is also reported for other plant species (Yaish and Pérez de la Vega, 2003).
Within the trimeric category, the CCG/CGG motif
(12.81%) was the most frequent detected on Eucalyptus
ESTs. Other trimerics detected with relative importance were the AGG/CCT (7.00%), AAG/CTT (4.78%), AGC/GCT (3.49%), and ACG/CGT (2.13%), with levels of abundance similar to those reported in the literature (Thielet al., 2003; Temnykhet al., 2000; Chin, 1996). The
AAT/ATT motif appeared less often inEucalyptusESTs
(0.11%), probably because TAA variants code for stop
codons, which could directly affect the protein synthesis (Chin, 1996).
In a unique initiative, we characterized a set of Euca-lyptusSSR-containing ESTs by function, searching for any pattern of association of SSRs with specific gene classes. However, no specific pattern of association was detected. Besides, 54% of the ESTs sequences containing SSRs had no homology with proteins of known function. In general,
the SSRs detected inEucalyptusESTs were homologous to
proteins involved with very distinct molecular functions (such as binding, catalytic, transporter, chaperone, enzyme regulator, signal transducer, and structural molecule (ribo-some) activities), biological processes (especially the ones related with metabolism) and cell; the high frequency of
SSR-containing sequences in theEucalyptusEST database
could somehow be interpreted as a paradox (Yaish and Pérez de la Vega, 2003). However, we postulated that these particular SSRs occupy certain positions in the coding re-gions that do not invalidate (or negatively affect) the activ-ity of these gene products, which were found most frequently associated with vital metabolic pathways, pro-cesses or cellular components.
The outcomes of this research, as presented, could be considered strictly theoretical and rather speculative in na-ture, thus requiring further validation studies to achieve its most important objective: the development of SSR-based markers forEucalyptus. Therefore, priority should be given to the next most important task of obtaining
microsatellite-based markers suitable for marker-assisted Eucalyptus
breeding programs.
The greatest obstacles for identification and compre-hension of quantitative traits variation inEucalyptusare the low throughput and the limited polymorphic information content of many molecular marker classes (such as RLFP) used for marker-assisted selection (Grattapaglia, 1999). Contrarily to such markers, the importance of micro-satellite loci forEucalyptusresides in the fact that they are extremely valuable for marker assisted breeding programs, as powerful tools in analyses of qualitative and quantitative trait loci. This is due to its highly polymorphic multiallelic nature. For example, from 50 microsatellite markers devel-oped forE. grandisandE. urophyla, 717 alleles were iden-tified in 32 individuals. The range of alleles per locus varied from 5 to 16 for E. urophyllaand 4 to 17 toE. grandis
(Brondaniet al., 2002). They are also extremely important for fingerprinting, quality control of controlled crossing, monitoring of inbreeding and assessment of gene flow and genetic differentiation among populations (Powell et al., 1996; Chenet al., 1997)
The mapping of important candidate genes for lignifi-cation, based on microsatellite markers with alleles segre-gating from both parents, would constitute another important approach to understanding the molecular basis of the quantitative variation (Gionet al., 2000; Kirstet al., 2001).
Furthermore, microsatellites are highly transferable from genome to genome within species and, frequently,
among species (Marques et al., 2002; Brondani et al.,
2002). For instance, all seventy of the SSR marker loci de-veloped forEucalyptuswere found fully transferable be-tweenE. grandis andE. urophyllaand highly genetically informative. On average, 45% of the alleles observed were shared between the two species (Brondani et al., 2002). These findings establish the basis for fundamental research such as evolutionary studies and the use of synteny in the
genetic analysis of the genus Eucalyptus as well.
Con-sidering that most of the Eucalyptus EST-consensus
se-quences were generated across libraries of distinct species (E. grandis, E. globosus, E. saligna and E. urophylla), enormous resources to test and implement related studies on genome synteny and evolution ofEucalyptusare avail-able.
To attain the goal of developing such valuable micro-satellite markers, our first initiative will be to improve the database by incorporating information on the design of flanking primers for codominant SSR loci. Validation stud-ies are urged to develop and characterize a collection of EST-derived SSR-markers in terms of information content, genomic distribution, and transferability to related Euca-lyptus species and to assess their potential for diversity analysis in a reference set ofE. grandiscultivars.
Acknowledgments
We would like to thank Centro Virtual Omega / PROPP-UNESP for facilitating the annotation tasks through financing the computer hardware needed. We would also like to thank the FORESTs Consortium, which provided us with access to its database.
References
Brondani RPV, Brondani C and Grattapaglia D (2002) Towards a genus-wide reference linkage map forEucalyptusbased ex-clusively on highly informative microsatellite markers. Mol Genet Genomics 267:338-347.
Brondani RPV, Brondani C, Tarchini R and Grattapaglia D (1998) Development, characterization and mapping of micro-satellite markers inEucalyptus grandisand E. urophylla. Theor Appl Genet 97:816-827.
Cardle L, Ramsay L, Milbourne D, Macaulay M, Marshall D and Waugh R (2000) Computational and experimental charac-terization of physically clustered simple sequence repeats in plants. Genetics 156:847-857.
Chen X, Temnykh S, Xu Y, Cho YG and McCouch SR (1997) De-velopment of a microsatellite framework map providing ge-nome wide coverage in rice (Oryza sativaL.). Theor Appl Genet 95:553-567.
Chin ECL (1996) Maize simple repetitive DNA sequences: Abun-dance and allele variation. Genome 39:866-873.
Cordeiro GM, Casu R, McIntyre CL, Manners JM and Henry RJ (2001) Microsatellite markers from sugarcane (Saccharum
spp.) ESTs cross transferable to erianthus and sorghum. Plant Sci 160:1115-1123.
Echt CS, Vendramim GG, Nelson CD and Marquardt P (1999) Microsatellite DNA as shared genetic markers among coni-fer species. Can J For Res 29:365-371.
Eujayl I, Sorrells ME, Baum M, Wolters P and Powell W (2002) Isolation of EST-derived microsatellite markers for geno-typing the A and B genomes of wheat. Theor Appl Genet 104:399-407.
Gion JM, Rech P, Grima-Pettenati J, Verhaegen D and Plomion C (2000) Mapping candidate genes inEucalyptuswith empha-sis on lignification genes. Mol Breed 6:441-449.
Grattapaglia D (1999) Molecular breeding ofEucalyptus- State of the art, operational applications and technical challenges. In: Jain SM (ed) Molecular Markers and Genome Mapping in Woody Plants. v 1. Kluwer Academic Publishers, Dor-drecht, pp 451-474.
Hackauf B and Wehling P (2002) Identification of microsatellite polymorphisms in an expressed portion of the rye genome. Plant Breed 121:17-25.
Huang X and Madan A (1999) CAP3: A DNA sequence assem-bling program. Genome Research 9:868-877.
Kirst M, Kirst EM, Gurgel G, Myburg AA and Whetten RW (2001) Gene discovery inEucalyptus grandisxylem. Plant and Animal Genome IX (San Diego) Abstract P502.
Marques CM, Brondani RPV, Grattapaglia D and Sederoff R (2002) Conservation and synteny of SSR loci and QTLs for vegetative propagation in fourEucalyptus species. Theor Appl Genet 105:474-478.
Metzgar D, Bytof J and Wills C (2000) Selection against frame-shift mutations limits microsatellite expansion in coding DNA. Genome Res 10:72-80.
Morgante M and Olivieri AM (1993) PCR-amplified micro-satellites as markers in plant genetics. Plant J 3:175-182. Powell W, Machray GC and Provan J (1996) Polymorphism
re-vealed by simple sequence repeats. Trends Plant Sci 1:215-222.
Ramsay L, Macaulay M, Ivanissevich DS, MacLean K, Cardle L, Fuller J, Edwards KJ, Tuvesson S, Morgante M, Massari A, Maestri E, Marmiroli N, Sjakste T, Ganal M, Powell W and Waugh R (2000) A simple sequence repeat-based linkage map of barley. Genetics 156:1997-2005.
Scott KD, Eggler P, Seaton G, Rossetto M, Ablett EM, Lee LS and Henry RJ (2000) Analysis of SSRs derived from grape ESTs. Theor Appl Genet 100:723-726.
Struss P and Plieske J (1998) The use of microsatellite markers for detection of genetic diversity in barley populations. Theor Appl Genet 97:308-315.
Temnykh S, Park WD, Ayres N, Cartinhour S, Hauck N, Lipovich L, Cho YG and McCouch SR (2000) Mapping and genome organization of microsatellite sequences in rice (Oriza sativaL.) Theor Appl Genet 100:692-712.
Thiel T, Michalek W, Varshney RK and Graner A (2003) Ex-ploiting EST databases for the development and character-ization of gene-derived SSR-markers in barley (Hordeum vulgareL.). Theor Appl Genet 106:411-422.
Yaish MWF and Pérez de la Vega M (2003) Isolation of (GA)n
microsatellite sequences and description of a predicted MADS-box sequence isolated from common bean (Phaseolus vulgaris). Genet Molec Biol 26:337-342.
Associate Editor: Marie Anne Van Sluys