Genetic relationships among American species of
Prosopis (Leguminosae)
based on enzyme markers
Cecilia Bessega
1,2, Beatriz Ofelia Saidman
3and Juan César Vilardi
3Facultad de Ciencias Exactas y Naturales, Departamento de Ecología, Genética y Evolución,
Buenos Aires, Argentina.
Abstract
In the present work, isoenzyme electrophoresis was used to analyze the variability and phenetic relationships among seven American species of genus Prosopis belonging to three different sections: P. argentina (Monilicarpa), P. glandulosa, P. velutina, P. flexuosa, P. ruscifolia, P. kuntzei (Algarobia), and P. reptans (Strombocarpa). The genetic variability inP. argentina, P. reptans, and P. kuntzei was significantly lower than in the rest of the species analyzed. The species belonging to different sections are highly differentiated, but the relationships retrieved among species belonging to the section Algarobia suggested that the series of this section are not natural groups.P. kuntzei is as differentiated from the remaining species of Algarobia as fromP. reptans or P. argentina, suggesting that this species might be included in a different section. The series within section Algarobia are not supported by the clusters retrieved in the phenogram based on isoenzymatic data. The results suggest that the two North American species (P. velutina and P. glandulosa) would have originated in different founder events.
Key words: Prosopis, isoenzymes, genetic variability, phenetic relationships. Received: April 26, 2004; Accepted: November 11, 2004.
Introduction
Prosopisis a primitive legume genus that includes shrubs and trees that exhibit a high economic and ecologi-cal potential in semiarid areas. They are a component of the climax community, but they also have the ability to colo-nize new habitats as pioneer species. Many of its species are used in numerous countries to recover arid and semiarid re-gions and are considered multipurpose trees because all of their biomass can be used. Pods have high carbohydrate and protein content and are used as forage and human food. These trees have wood of high quality and adapt well to silvopastoril and agroforestal production (Roig, 1993). Prosopisinvolves about 44 species grouped in five sec-tions: Prosopis and Anonychium, distributed in Africa and Asia; Strombocarpa and Algarobia, distributed in North and South America; and the monotypic section Monili-carpa, restricted to Argentina.
The section Strombocarpa includes nine species clearly differentiated morphologically from each other, and
interspecific hybridization is infrequent (Burkart, 1976). Isoenzymatic studies in five of them (P. torquata, P. pubescens,P. strombulifera, andP. reptans) showed low intraspecific variability and yielded many species-specific diagnostic loci (Saidmanet al., 1996).
Based on morphological grounds the section Algarobia has been divided into six series (Burkart, 1976), but the relationships among species of this section are un-der debate. Studies based on species of the series Pallidae, Ruscifoliae, and Chilenses indicated that natural hybrids frequently occur in zones of sympatry even between spe-cies belonging to different series (Hunzikeret al., 1986). However, no interserial hybrids have been recorded involv-ing species of the series Sericanthae. The information about hybridization involving species of the two remaining se-ries, Denudans and Humiles, is scarce.
The species of Ruscifoliae and Chilenses studied so far exhibit high levels of variability within populations, but low biochemical and genetical differentiation among spe-cies (Saidman and Vilardi, 1987, 1993; Saidman et al., 1997, 1998a,b). The relationships observed among species in isoenzymatic (Saidman and Vilardi, 1993; Bessegaet al., 2000a,b) and molecular (Ramírezet al., 1999; Saidmanet al., 1998a,b; Saidmanet al., 2000) analyses are not consis-tent with the series.
Previous works (Hunzikeret al., 1986; Saidman et al., 1996) indicated that the sections Algarobia and www.sbg.org.br
Send correspondence to Cecilia Bessega. Facultad de Ciencias Exactas y Naturales, Departamento de Ecología, Genética y Evo-lución, Buenos Aires, Argentina. E-mail: [email protected].
1
Present Address: Instituto de Biotecnología CICVyA - CNIA - INTA - CC 25 - 1712 – Castelar, Argentina.
2
Fellow of Consejo Nacional de Investigaciones Científicas y Tecnológicas (CONICET).
3
Member of CONICET.
Strombocarpa are highly differentiated. The speciation pro-cess in these groups as well as their adaptive strategies seem to be quite different.
The Section Monilicarpa is represented by only one isolated species,P. argentinaBurkart endemic to Argen-tina. According to Burkart (1937, 1976) its origin and affin-ities of either Algarobia or Strombocarpa are uncertain. Its preference for sand dunes is in marked contrast to that of the common species of section Algarobia, which prefer heavier soils, sometimes salty clay on lower plateaus and riverbanks (Burkart, 1976). There are only a few biochemi-cal (Burghardt and Palacios, 1997) and molecular (Ramirez et al., 1999) studies onP. argentinaand the population ge-netic variability has yet to be studied.
In the present work we analyzed, by means of isoenzyme electrophoresis, the variability and phenetic re-lationships amongP. argentinaand six species belonging to the remaining American sections of Prosopis: P. glandulosa(Torr) andP. velutina Wooton from USA,P. flexuosa DC, P. ruscifolia Gris., P. kuntzei Harms (Algarobia), andP. reptansBentham (Strombocarpa) from Argentina. Parameters of genetic variability and differenti-ation were estimated in populdifferenti-ations of these species. This information is discussed with reference to the expected re-lationships according to the available morphological evi-dence and geographical distribution.
Materials and Methods
Species, populations and sampling methods
The present work involved two populations ofP. ar-gentina(“algarobilla”), one ofP. reptans(“retortuño”), one ofP. kuntzei(“itín”), four ofP. ruscifolia(“vinal”), two of
P. flexuosa(“algarrobo amarillo”), four ofP. glandulosa (“honey mesquite”) and one ofP. velutina(“velvet mes-quite”) (Table 1, Figure 1).
The species and populations sampled cover a wide range of the distribution of the genusProsopisin America (Burkart, 1976). P. argentina (sect. Monilicarpa) is en-demic in Northwestern Argentina in the Andean provinces of Catamarca, La Rioja, San Juan and northern Mendoza
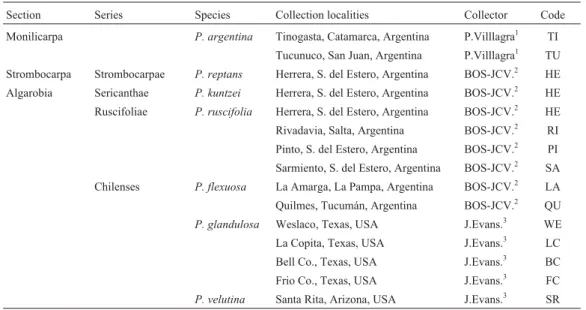
Table 1- List of the sections, series,Prosopisspecies and populations studied, collectors and codes used to identify populations in Figure 1.
Section Series Species Collection localities Collector Code Monilicarpa P. argentina Tinogasta, Catamarca, Argentina P.Villlagra1 TI
Tucunuco, San Juan, Argentina P.Villlagra1 TU
Strombocarpa Strombocarpae P. reptans Herrera, S. del Estero, Argentina BOS-JCV.2 HE
Algarobia Sericanthae P. kuntzei Herrera, S. del Estero, Argentina BOS-JCV.2 HE
Ruscifoliae P. ruscifolia Herrera, S. del Estero, Argentina BOS-JCV.2 HE
Rivadavia, Salta, Argentina BOS-JCV.2 RI
Pinto, S. del Estero, Argentina BOS-JCV.2 PI
Sarmiento, S. del Estero, Argentina BOS-JCV.2 SA
Chilenses P. flexuosa La Amarga, La Pampa, Argentina BOS-JCV.2 LA
Quilmes, Tucumán, Argentina BOS-JCV.2 QU
P. glandulosa Weslaco, Texas, USA J.Evans.3 WE
La Copita, Texas, USA J.Evans.3 LC
Bell Co., Texas, USA J.Evans.3 BC
Frio Co., Texas, USA J.Evans.3 FC
P. velutina Santa Rita, Arizona, USA J.Evans.3 SR
1IADIZA= Instituto Argentino de Investigaciones en Zonas Áridas (Mendoza Argentina).2UBA = Universidad de Buenos Aires (Buenos Aires,
Argen-tina).3GRS-USDA = Grassland Research Station USDA/ARS (USA).
(Argentina).P. reptansvar.reptans(Strombocarpa) grows in central Argentina and Peru. From the Algarobia section, P. glandulosaandP. velutinaranges involve southwestern United States and Mexico. The other three species are re-stricted to South America: P. flexuosa can be found in Prepuna and Monte regions (northwestern and central Argentina); P. ruscifolia occurs in the Chaqueña region (Santiago del Estero, Chaco and Formosa provinces, Ar-gentina); andP. kuntzeican be found in the Gran Chaco of northern Paraguay and eastern Bolivia to central Argentina. Sampling methods for all Argentinean populations, except forP. argentinaandP. reptanswere those described in previous works (Vilardiet al., 1988). At least ten mother plants were sampled in each population. The samples from United States were collected by Dr. J. C. Evans (Grassland Research Station USDA/ARS). They included five or six mother plants per population. In all cases (North and South American species) the sampled trees were separated at least 50 m from each other. This distance between sampled mother plants reduces the probability that they interbreed. About 50 pods were collected from each mother plant. The seeds from each tree were stored in different bags. Similar
numbers of seeds from different trees (bags) from each population were sampled for the isozyme analysis. Voucher specimens of each mother tree were taxonomi-cally identified and deposited in the Herbarium of the Laboratorio de Genética, Facultad de Ciencias Exactas y Naturales, Universidad de Buenos Aires, Argentina.P. ar-gentina (kindly donated by Dr. P. Villagra, IADIZA, Mendoza, Argentina) andP. reptans population samples involved pods from about 30 mother plants collected in a single bag and only one voucher specimen representative of the whole population was prepared. The rationale for this sampling method is that populations of these species form a continuum where individual shrubs can not be identified. The number of seeds analyzed for each population are listed in Table 2.
Isoenzymatic techniques
Nine systems were studied using horizontal electro-phoresis on polyacrylamide gels: esterase (EST), glutamate oxalacetate transaminase (GOT), amino peptidase (AMP), alcohol dehydrogenase (ADH), superoxide dismutase (SOD), 6-phosphogluconate dehydrogenase (6PGD),
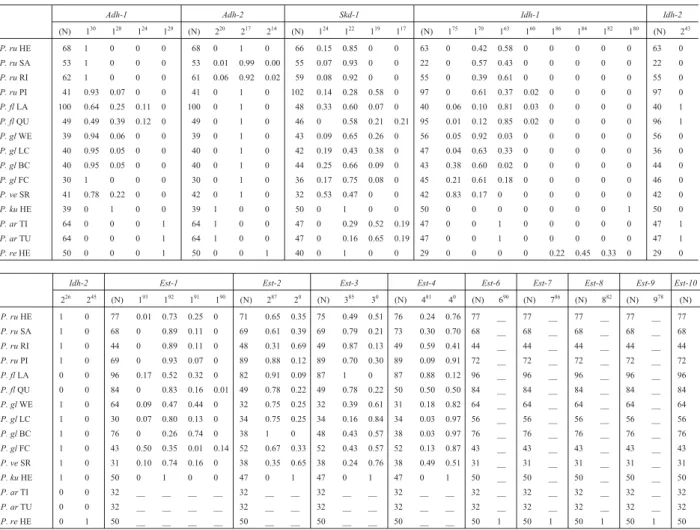
Table 2- Allelic frequencies and number of seeds analyzed (N) of loci showing variation either within or among populations in the studied species of
Prosopis. One additional loci.Amp-1,did not show variation and is not included in the list.
Adh-1 Adh-2 Skd-1 Idh-1 Idh-2
(N) 130 128 124 129 (N) 220 217 214 (N) 124 122 119 117 (N) 175 170 163 160 186 184 182 180 (N) 243
P. ruHE 68 1 0 0 0 68 0 1 0 66 0.15 0.85 0 0 63 0 0.42 0.58 0 0 0 0 0 63 0
P. ruSA 53 1 0 0 0 53 0.01 0.99 0.00 55 0.07 0.93 0 0 22 0 0.57 0.43 0 0 0 0 0 22 0
P. ruRI 62 1 0 0 0 61 0.06 0.92 0.02 59 0.08 0.92 0 0 55 0 0.39 0.61 0 0 0 0 0 55 0
P. ruPI 41 0.93 0.07 0 0 41 0 1 0 102 0.14 0.28 0.58 0 97 0 0.61 0.37 0.02 0 0 0 0 97 0
P. flLA 100 0.64 0.25 0.11 0 100 0 1 0 48 0.33 0.60 0.07 0 40 0.06 0.10 0.81 0.03 0 0 0 0 40 1
P. flQU 49 0.49 0.39 0.12 0 49 0 1 0 46 0 0.58 0.21 0.21 95 0.01 0.12 0.85 0.02 0 0 0 0 96 1
P. glWE 39 0.94 0.06 0 0 39 0 1 0 43 0.09 0.65 0.26 0 56 0.05 0.92 0.03 0 0 0 0 0 56 0
P. glLC 40 0.95 0.05 0 0 40 0 1 0 42 0.19 0.43 0.38 0 47 0.04 0.63 0.33 0 0 0 0 0 36 0
P. glBC 40 0.95 0.05 0 0 40 0 1 0 44 0.25 0.66 0.09 0 43 0.38 0.60 0.02 0 0 0 0 0 44 0
P. glFC 30 1 0 0 0 30 0 1 0 36 0.17 0.75 0.08 0 45 0.21 0.61 0.18 0 0 0 0 0 46 0
P. veSR 41 0.78 0.22 0 0 42 0 1 0 32 0.53 0.47 0 0 42 0.83 0.17 0 0 0 0 0 0 42 0
P. kuHE 39 0 1 0 0 39 1 0 0 50 0 1 0 0 50 0 0 0 0 0 0 0 1 50 0
P. arTI 64 0 0 0 1 64 1 0 0 47 0 0.29 0.52 0.19 47 0 0 1 0 0 0 0 0 47 1
P. arTU 64 0 0 0 1 64 1 0 0 47 0 0.16 0.65 0.19 47 0 0 1 0 0 0 0 0 47 1
P. reHE 50 0 0 0 1 50 0 0 1 40 0 1 0 0 29 0 0 0 0 0.22 0.45 0.33 0 29 0
Idh-2 Est-1 Est-2 Est-3 Est-4 Est-6 Est-7 Est-8 Est-9 Est-10
226 245 (N) 193 192 191 190 (N) 287 20 (N) 385 30 (N) 481 40 (N) 690 (N) 786 (N) 882 (N) 978 (N)
P. ruHE 1 0 77 0.01 0.73 0.25 0 71 0.65 0.35 75 0.49 0.51 76 0.24 0.76 77 __ 77 __ 77 __ 77 __ 77
P. ruSA 1 0 68 0 0.89 0.11 0 69 0.61 0.39 69 0.79 0.21 73 0.30 0.70 68 __ 68 __ 68 __ 68 __ 68
P. ruRI 1 0 44 0 0.89 0.11 0 48 0.31 0.69 49 0.87 0.13 49 0.59 0.41 44 __ 44 __ 44 __ 44 __ 44
P. ruPI 1 0 69 0 0.93 0.07 0 89 0.88 0.12 89 0.70 0.30 89 0.09 0.91 72 __ 72 __ 72 __ 72 __ 72
P. flLA 0 0 96 0.17 0.52 0.32 0 82 0.91 0.09 87 1 0 87 0.88 0.12 96 __ 96 __ 96 __ 96 __ 96
P. flQU 0 0 84 0 0.83 0.16 0.01 49 0.78 0.22 49 0.78 0.22 50 0.50 0.50 84 __ 84 __ 84 __ 84 __ 84
P. glWE 1 0 64 0.09 0.47 0.44 0 32 0.75 0.25 32 0.39 0.61 31 0.18 0.82 64 __ 64 __ 64 __ 64 __ 64
P. glLC 1 0 30 0.07 0.80 0.13 0 34 0.75 0.25 34 0.16 0.84 34 0.03 0.97 56 __ 56 __ 56 __ 56 __ 56
P. glBC 1 0 76 0 0.26 0.74 0 38 1 0 48 0.43 0.57 38 0.03 0.97 76 __ 76 __ 76 __ 76 __ 76
P. glFC 1 0 43 0.50 0.35 0.01 0.14 52 0.67 0.33 52 0.43 0.57 52 0.13 0.87 43 __ 43 __ 43 __ 43 __ 43
P. veSR 1 0 31 0.10 0.74 0.16 0 38 0.35 0.65 38 0.24 0.76 38 0.49 0.51 31 __ 31 __ 31 __ 31 __ 31
P. kuHE 1 0 50 0 1 0 0 47 0 1 47 0 1 47 0 1 50 __ 50 __ 50 __ 50 __ 50
P. arTI 0 0 32 __ __ __ __ 32 __ __ 32 __ __ 32 __ __ 32 __ 32 __ 32 __ 32 __ 32
P. arTU 0 0 32 __ __ __ __ 32 __ __ 32 __ __ 32 __ __ 32 __ 32 __ 32 __ 32 __ 32
Table 2 (cont.)
Idh-2 Est-1 Est-2 Est-3 Est-4 Est-6 Est-7 Est-8 Est-9 Est-10
226 245 (N) 193 192 191 190 (N) 287 20 (N) 385 30 (N) 481 40 (N) 690 (N) 786 (N) 882 (N) 978 (N)
P. ruHE 1 0 77 0.01 0.73 0.25 0 71 0.65 0.35 75 0.49 0.51 76 0.24 0.76 77 __ 77 __ 77 __ 77 __ 77
P. ruSA 1 0 68 0 0.89 0.11 0 69 0.61 0.39 69 0.79 0.21 73 0.30 0.70 68 __ 68 __ 68 __ 68 __ 68
P. ruRI 1 0 44 0 0.89 0.11 0 48 0.31 0.69 49 0.87 0.13 49 0.59 0.41 44 __ 44 __ 44 __ 44 __ 44
P. ruPI 1 0 69 0 0.93 0.07 0 89 0.88 0.12 89 0.70 0.30 89 0.09 0.91 72 __ 72 __ 72 __ 72 __ 72
P. flLA 0 0 96 0.17 0.52 0.32 0 82 0.91 0.09 87 1 0 87 0.88 0.12 96 __ 96 __ 96 __ 96 __ 96
P. flQU 0 0 84 0 0.83 0.16 0.01 49 0.78 0.22 49 0.78 0.22 50 0.50 0.50 84 __ 84 __ 84 __ 84 __ 84
P. glWE 1 0 64 0.09 0.47 0.44 0 32 0.75 0.25 32 0.39 0.61 31 0.18 0.82 64 __ 64 __ 64 __ 64 __ 64
P. glLC 1 0 30 0.07 0.80 0.13 0 34 0.75 0.25 34 0.16 0.84 34 0.03 0.97 56 __ 56 __ 56 __ 56 __ 56
P. glBC 1 0 76 0 0.26 0.74 0 38 1 0 48 0.43 0.57 38 0.03 0.97 76 __ 76 __ 76 __ 76 __ 76
P. glFC 1 0 43 0.50 0.35 0.01 0.14 52 0.67 0.33 52 0.43 0.57 52 0.13 0.87 43 __ 43 __ 43 __ 43 __ 43
P. veSR 1 0 31 0.10 0.74 0.16 0 38 0.35 0.65 38 0.24 0.76 38 0.49 0.51 31 __ 31 __ 31 __ 31 __ 31
P. kuHE 1 0 50 0 1 0 0 47 0 1 47 0 1 47 0 1 50 __ 50 __ 50 __ 50 __ 50
P. arTI 0 0 32 __ __ __ __ 32 __ __ 32 __ __ 32 __ __ 32 __ 32 __ 32 __ 32 __ 32
P. arTU 0 0 32 __ __ __ __ 32 __ __ 32 __ __ 32 __ __ 32 __ 32 __ 32 __ 32 __ 32
P. reHE 0 1 50 __ __ __ __ 50 __ __ 50 __ __ 50 __ __ 50 1 50 1 50 1 50 1 50
Est-10 Est-11 Est-12 Est-13 Est-14 Est-15 Amp-1 Amp-2 Amp-3 Sod-1 Sod-2
1057 (N) 1146 (N) 1240 (N) 1330 (N) 1420 (N) 1518 (N) 1100 (N) 288 276 270 (N) 377 374 371 (N) 191 (N) 283
P. ruHE __ 77 __ 77 __ 77 __ 77 __ 77 __ 41 1 41 0.48 0.40 0.12 41 __ __ __ 50 1 50 1
P. ruSA __ 68 __ 68 __ 68 __ 68 __ 68 __ 95 1 95 0.25 0.52 0.23 95 __ __ __ 50 1 50 1
P. ruRI __ 44 __ 44 __ 44 __ 44 __ 44 __ 62 1 62 0.39 0.41 0.20 62 __ __ __ 50 1 50 1
P. ruPI __ 72 __ 72 __ 72 __ 72 __ 72 __ 29 1 29 0.33 0.55 0.12 29 __ __ __ 50 1 50 1
P. flLA __ 96 __ 96 __ 96 __ 96 __ 96 __ 105 1 105 0.25 0.57 0.18 105 __ __ __ 50 1 50 1
P. flQU __ 84 __ 84 __ 84 __ 84 __ 84 __ 44 1 44 0.45 0.55 0 44 __ __ __ 50 1 50 1
P. glWE __ 64 __ 64 __ 64 __ 64 __ 64 __ 30 1 30 0.42 0.47 0.11 30 __ __ __ 50 1 50 1
P. glLC __ 56 __ 56 __ 56 __ 56 __ 56 __ 37 1 37 0.41 0.39 0.20 37 __ __ __ 50 1 50 1
P. glBC __ 76 __ 76 __ 76 __ 76 __ 76 __ 44 1 44 0.25 0.45 0.30 44 __ __ __ 50 1 50 1
P. glFC __ 43 __ 43 __ 43 __ 43 __ 43 __ 42 1 42 0.38 0.55 0.07 42 __ __ __ 50 1 50 1
P. veSR __ 31 __ 31 __ 31 __ 31 __ 31 __ 34 1 34 0.79 0.21 0 34 __ __ __ 40 1 40 1
P. kuHE __ 50 __ 50 __ 50 __ 50 __ 50 __ 30 1 30 0 0.72 0.28 30 __ __ __ 31 1 31 __
P. arTI __ 32 1 32 1 32 1 32 1 32 1 16 1 16 1 0 0 11 0 0.27 0.73 32 1 32 1
P. arTU __ 32 1 32 1 32 1 32 1 32 1 16 1 16 1 0 0 14 0.07 0.72 0.21 32 1 32 1
P. reHE 1 50 __ 50 __ 50 __ 50 __ 50 __ 80 1 80 1 0 0 80 0.24 0 0.76 50 1 50 1
Sod-3 Sod-4 Sod-5 Sod-6 Sod-7 Sod-8 Pgd-1 Pgd-2 Prx-1
(N) 375
(N) 472
(N) 550
(N) 670
(N) 760
(N) 895
(N) 130
126
123
10
(N) 233
221
20
(N) 136
10
P. ruHE 50 1 50 1 50 1 50 __ 50 __ 50 __ 101 0.60 0.40 0 0 100 0.30 0.16 0.54 49 0.10 0.90
P. ruSA 50 1 50 1 50 1 50 __ 50 __ 50 __ 62 0.40 0.60 0 0 62 0.21 0.23 0.56 44 0.07 0.93
P. ruRI 50 1 50 1 50 1 50 __ 50 __ 50 __ 74 0.63 0.37 0 0 84 0.26 0.16 0.58 40 0.06 0.94
P. ruPI 50 1 50 1 50 1 50 __ 50 __ 50 __ 78 0.14 0.86 0 0 79 0.19 0.20 0.61 40 0.42 0.58
P. flLA 50 1 50 1 50 1 50 __ 50 __ 50 __ 41 0.78 0.22 0 0 41 0.06 0 0.94 90 0.87 0.13
P. flQU 50 1 50 1 50 1 50 __ 50 __ 50 __ 102 0.01 0.99 0 0 68 0.12 0.20 0.68 41 0.32 0.68
P. glWE 50 1 50 1 50 1 50 __ 50 __ 50 __ 56 0 1 0 0 56 0 0 1 31 0.19 0.81
P. glLC 50 1 50 1 50 1 50 __ 50 __ 50 __ 36 0 1 0 0 36 0.03 0 0.97 26 0.52 0.48
P. glBC 50 1 50 1 50 1 50 __ 50 __ 50 __ 46 0 1 0 0 46 0.02 0 0.98 40 0.06 0.94
P. glFC 50 1 50 1 50 1 50 __ 50 __ 50 __ 32 0 1 0 0 32 0 0 1 38 0.07 0.93
P. veSR 40 1 40 1 40 1 40 __ 40 __ 40 __ 34 0 1 0 0 34 0 0 1 48 __ __
P. kuHE 31 1 31 1 31 __ 31 1 31 __ 31 __ 26 1 0 0 0 26 0 0 1 47 0.62 0.38
P. arTI 32 1 32 1 32 1 32 __ 32 1 32 1 47 0.94 0.02 0 0.04 47 1 0 0 37 0.84 0.16
P. arTU 32 1 32 1 32 1 32 __ 32 1 32 1 48 1 0 0 0 48 0.99 0 0.01 41 0.72 0.28
P. reHE 50 1 50 1 50 1 50 __ 50 __ 50 __ 50 1 0 0 0 50 0 0 1 50 __ __
Prx-2 Prx-3 Prx-4 Prx-5 Prx-6 Prx-7 Got-1
(N) 229
20
(N) 321
30
(N) 440
(N) 539
538
537
(N) 632
(N) 725
(N) 172
169
161
171
170
169,5
168,5
168
P. ruHE 49 0.89 0.11 33 0.74 0.26 33 __ 33 __ __ __ 33 __ 33 __ 86 0.05 0.95 0 0 0 0 0 0
P. ruSA 44 0.47 0.53 44 0.77 0.23 44 __ 44 __ __ __ 44 __ 44 __ 52 0.11 0.82 0.07 0 0 0 0 0
P. ruRI 40 0.72 0.28 40 0.38 0.62 40 __ 40 __ __ __ 40 __ 40 __ 49 0.05 0.95 0 0 0 0 0 0
P. ruPI 40 0.27 0.73 40 0.29 0.71 40 __ 40 __ __ __ 40 __ 40 __ 38 0.13 0.87 0 0 0 0 0 0
P. flLA 98 0.88 0.12 96 0.66 0.34 96 __ 96 __ __ __ 96 __ 96 __ 60 0.44 0.56 0 0 0 0 0 0
P. flQU 41 0.72 0.28 41 0.38 0.62 41 __ 41 __ __ __ 41 __ 41 __ 64 0.51 0.44 0.05 0 0 0 0 0
peroxidase (PRX), isocitrate dehydrogenase (IDH) and shikimic dehydrogenase (SKD). The methods employed for the former seven systems are described in Saidman (1985). For IDH and SKD the method was adapted from Verga (1995). The homogenates were made from five to seven day old cotyledons for all systems but ADH, for which 16-h-old seedlings were analyzed. Since ADH must be analyzed at a different life stage, it was not possible to study this system on the same individuals used for the as-says with all the other enzymes.
Statistical methods
The genetic interpretation of isozyme data inP. ar-gentinaandP. kuntzeiwas based on previous studies on other species of Prosopis (Saidman and Vilardi, 1987; Verga, 1995). Standard measures of genetic diversity were calculated for each population from allelic frequency data. The diversity parameters estimated included mean number of alleles per locus (Â), mean number of alleles per poly-morphic locus (ÂP), percentage of polymorphic loci (P$), and mean expected (H$
e) and observed (H$o)
heterozygo-sity. They were calculated using BIOSYS 1.7 (Swofford and Selander, 1981). Expected heterozygosity estimates were compared among species by Kruskall-Wallis analysis of variance, using the program Statistix ver. 1.0 (Analytical Software, 1996). Pair-wise comparisons of mean hetero-zygosities were performed by Wilcoxon test using the pro-gram Statistica (Statsoft, Inc., 1995). These test have the
advantage of having no assumptions about the distribution of the coefficients to be compared.
In order to discuss bias from Hardy-Weinberg ex-pected frequencies, Wright (1951) F$
is indices were
esti-mated.
Differentiation between populations were estimated by two methods. The first one was based on unbiased Nei’s (1978) genetic distances. This method might have some er-ror because the precise homology between genes in species of different sections are uncertain due to the absence of intersectional hybrids. The second approach employs a phenotypic criterion to assess band homologies and to esti-mate relative associations among species. The bands were considered present when their frequency in the population was equal to or higher than 0.05 and a 0-1 matrix (pres-ence-absence) was constructed. Manhattan distances were estimated from that matrix using the program RAPD (Black IV, 1996). Based on the genetic distances, two phenograms were obtained by UPGMA using the same program. In order to evaluate the reliability of the branches, 100 phenograms were obtained from bootstrapped pseudoreplicates of the respective matrices.
Results
Allelic frequencies
From all species, a total of 46 loci were detected. Some of them were invariant: Amp-1,Sod-1, Sod-3, and
Got-1 Got-2 Got-3 Got-4 Got-5 Got-6 Got-7
167 171,5 (N) 248 240 234 227 254 239 237 238 236 (N) 349 (N) 444 (N) 550 (N) 625 626 60 (N) 724 722
P. ruHE 0 0 61 0.59 0.27 0.08 0.06 0 0 0 0 0 86 __ 86 __ 86 __ 86 0 0 1 86 __ __
P. ruSA 0 0 47 0.80 0.20 0 0 0 0 0 0 0 52 __ 52 __ 52 __ 52 0 0 1 52 __ __
P. ruRI 0 0 44 0.59 0.41 0 0 0 0 0 0 0 49 __ 49 __ 49 __ 49 0 0 1 49 __ __
P. ruPI 0 0 34 0.54 0.40 0.06 0 0 0 0 0 0 38 __ 38 __ 38 __ 38 0 0 1 38 __ __
P. flLA 0 0 51 0.28 0.72 0 0 0 0 0 0 0 60 __ 60 __ 60 __ 60 0 0 1 60 __ __
P. flQU 0 0 51 0.31 0.64 0.05 0 0 0 0 0 0 51 __ 51 __ 64 __ 64 0 0 1 51 __ __
P. glWE 0 0 55 0.63 0.37 0 0 0 0 0 0 0 55 __ 55 __ 91 __ 91 0 0 1 55 __ __
P. glLC 0 0 53 0.82 0.18 0 0 0 0 0 0 0 53 __ 53 __ 56 __ 56 0 0 1 53 __ __
P. glBC 0 0 21 0.93 0.07 0 0 0 0 0 0 0 34 __ 34 __ 34 __ 34 0 0 1 34 __ __
P. glFC 0 0 36 0.90 0.10 0 0 0 0 0 0 0 39 __ 39 __ 39 __ 39 0 0 1 39 __ __
P. veSR 0 0 34 0 0 0 0 1 0 0 0 0 34 1 34 1 43 __ 43 0 0 1 34 __ __
P. kuHE 0 1 82 0 0 0 0 0 0.96 0.04 0 0 100 __ 10 0 __ 98 1 98 0.23 0.63 0.14 100 __ __
P. arTI 0 0 39 0.42 0 0.58 0 0 0 0 0 0 31 __ 31 __ 27 __ 27 0 0 1 31 0.84 0.16
P. arTU 0 0 39 0.81 0.04 0.15 0 0 0 0 0 0 31 __ 31 __ 30 __ 30 0 0 1 39 0.83 0.17
P. reHE 0.95 0.05 100 0 0 0 0 0 0 0 0.27 0.73 31 __ 31 __ 100 __ 100 0 0 1 31 __ __
Table 2 (cont.)
Prx-2 Prx-3 Prx-4 Prx-5 Prx-6 Prx-7 Got-1
(N) 229
20
(N) 321
30
(N) 440
(N) 539
538
537
(N) 632
(N) 725
(N) 172
169
161
171
170
169,5
168,5
168
P. glLC 26 0.67 0.33 26 0.19 0.81 26 __ 26 __ __ __ 26 __ 26 __ 56 0.09 0.46 0 0 0.45 0 0 0
P. glBC 40 0.84 0.16 40 0.28 0.72 40 __ 40 __ __ __ 40 __ 40 __ 34 0.25 0.54 0 0 0.21 0 0 0
P. glFC 38 0.72 0.28 35 0.11 0.89 35 __ 35 __ __ __ 35 __ 35 __ 39 0.20 0.35 0 0 0.45 0 0 0
P. veSR 48 __ __ 48 __ __ 48 __ 48 __ __ __ 48 1 48 1 43 0.12 0.08 0 0.80 0 0 0 0
P. kuHE 47 0.85 0.15 47 0.45 0.55 47 __ 47 __ __ __ 47 __ 47 __ 98 0 0 0 0 0 0 0 0
P. arTI 37 0.84 0.16 37 0.27 0.73 37 __ 37 __ __ __ 37 __ 37 __ 27 0 0 0 0 0 0.80 0.20 0
P. arTU 41 0.60 0.40 41 0.24 0.76 41 __ 41 __ __ __ 41 __ 41 __ 30 0 0 0 0 0 0.55 0.45 0
Sod-4. The remaining loci showed variation within or among populations (Table 2).
For every system, the loci were numbered according to the chronological order in which they were described in previous works. Alleles were named with a superscript in-dicating the relative mobility of the corresponding product. The superscript 0 refers to null alleles. Some loci were spe-cies-specific, showing no homology with loci present in other species (Table 2).
Genetic variability and endogamy estimates
Genetic variability and endogamy estimates are shown in Table 3. In all populationsH$
e was higher than
$
Ho, yielding positiveF$is estimates. This result indicates
that some endogamy occurs in all studied populations. There is no significant correlation between genetic variabil-ity and theF$
is coefficient (p = 0.45). For most variability
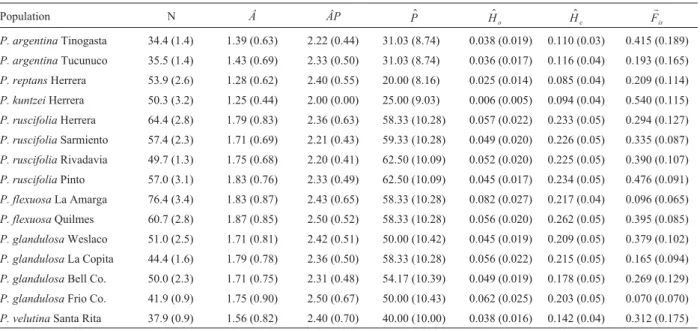
estimatesP. flexuosa(Quilmes) exhibited the highest val-ues, while P. kuntzei(Herrera) and P. reptans (Herrera) were the less variable populations.
The estimates of Â, ÂP, and H$
e were compared
among populations by Kruskall-Wallis statistics (KWS). Non-significant differences were detected for ÂP (KWS = 8.36; p = 0.87), but the differences among popula-tions were significant for bothÂ(KWS = 28.477, p = 0.012) andH$
e(KWS = 22.536, p = 0.047).
When only populations of the same species were in-cluded in the analyses ofÂandH$
e, the differences were not
significant in any case (KWS = 0.008-0.31, p = 0.93-0.96
and KWS = 0.026-0.43, p = 0.872-0.509 for  andH$
e,
re-spectively). All populations of each species were pooled and the comparisons were made at species level. The Kruskall-Wallis test indicated highly significant differ-ences for both  andH$
e (KWS = 27.89, p = 0.0001 and
KWS = 28.20, p = 0.0001 respectively). In general terms the species of section Algarobia resulted in more variation than the rest (A = 1.71, He = 0.20). However, when Algarobia species were compared to each other the differ-ences were significant (KWS = 12.64, p = 0.013 and KWS = 11.92, p = 0.018 forÂandH$
e respectively) as a
consequence of the low variability of P. kuntzei (Herrera). When this population was excluded, no significant differ-ences occurred among species of Algarobia (KWS = 2.98, p = 0.39 and KWS = 4.73, p = 0.19 forÂandH$
e,
respec-tively). When P. kuntzei (Herrera),P. argentina, and P. reptans(Herrera) were compared, the differences were not significant (KWS = 1.46, p = 0.50 and KWS = 0.84, p = 0.65 forÂandH$
e, respectively).
The proportion of polymorphic loci (P$) differed sig-nificantly among populations and among species (χ214= 28.84,P= 0.011 andχ26= 28.21, p < 0.0001). The
proportion of polymorphic loci was compared among the same population groups as described forÂandH$
e. The
spe-cies of Algarobia studied here exhibited significant differ-ences for P estimates (χ24= 11.92, p = 0.018), but these
differences became non-significant when P. kuntzei (Herrera) was excluded (χ23= 3.75, p = 0.29). TheP
esti-mates did not differ statistically among P. kuntzei
Table 3- Genetic variability and fixation index (FIS) coefficients estimated for each population. N = mean sample size per locus,Â= mean number of
alleles per locus,ÂP= mean number of alleles per polymorphic locus,P$ = % of polymorphic loci (5% criterion),H$
o = observed heterozygosity, $
He= unbiased heterozygosity expected under Hardy-Weinberg. Numbers in parenthesis indicate the standard error.
Population N Â ÂP P$ H$
o H$e
r
Fis
P. argentinaTinogasta 34.4 (1.4) 1.39 (0.63) 2.22 (0.44) 31.03 (8.74) 0.038 (0.019) 0.110 (0.03) 0.415 (0.189)
P. argentinaTucunuco 35.5 (1.4) 1.43 (0.69) 2.33 (0.50) 31.03 (8.74) 0.036 (0.017) 0.116 (0.04) 0.193 (0.165)
P. reptansHerrera 53.9 (2.6) 1.28 (0.62) 2.40 (0.55) 20.00 (8.16) 0.025 (0.014) 0.085 (0.04) 0.209 (0.114)
P. kuntzeiHerrera 50.3 (3.2) 1.25 (0.44) 2.00 (0.00) 25.00 (9.03) 0.006 (0.005) 0.094 (0.04) 0.540 (0.115)
P. ruscifoliaHerrera 64.4 (2.8) 1.79 (0.83) 2.36 (0.63) 58.33 (10.28) 0.057 (0.022) 0.233 (0.05) 0.294 (0.127)
P. ruscifoliaSarmiento 57.4 (2.3) 1.71 (0.69) 2.21 (0.43) 59.33 (10.28) 0.049 (0.020) 0.226 (0.05) 0.335 (0.087)
P. ruscifoliaRivadavia 49.7 (1.3) 1.75 (0.68) 2.20 (0.41) 62.50 (10.09) 0.052 (0.020) 0.225 (0.05) 0.390 (0.107)
P. ruscifoliaPinto 57.0 (3.1) 1.83 (0.76) 2.33 (0.49) 62.50 (10.09) 0.045 (0.017) 0.234 (0.05) 0.476 (0.091)
P. flexuosaLa Amarga 76.4 (3.4) 1.83 (0.87) 2.43 (0.65) 58.33 (10.28) 0.082 (0.027) 0.217 (0.04) 0.096 (0.065)
P. flexuosaQuilmes 60.7 (2.8) 1.87 (0.85) 2.50 (0.52) 58.33 (10.28) 0.056 (0.020) 0.262 (0.05) 0.395 (0.085)
P. glandulosaWeslaco 51.0 (2.5) 1.71 (0.81) 2.42 (0.51) 50.00 (10.42) 0.045 (0.019) 0.209 (0.05) 0.379 (0.102)
P. glandulosaLa Copita 44.4 (1.6) 1.79 (0.78) 2.36 (0.50) 58.33 (10.28) 0.056 (0.022) 0.215 (0.05) 0.165 (0.094)
P. glandulosaBell Co. 50.0 (2.3) 1.71 (0.75) 2.31 (0.48) 54.17 (10.39) 0.049 (0.019) 0.178 (0.05) 0.269 (0.129)
P. glandulosaFrio Co. 41.9 (0.9) 1.75 (0.90) 2.50 (0.67) 50.00 (10.43) 0.062 (0.025) 0.203 (0.05) 0.070 (0.070)
(Herrera),P. reptans(Herrera), andP. argentina popula-tions (χ22= 1.38, p = 0.50).
Genetic distances among populations
Two matrices of genetic distances (Table 4) were ob-tained respectively from Manhattan and Nei’s genetic dis-tances. They were highly consistent according to a Mantel test (r = 0.95; p = 0) based on 500 permutations. The corre-sponding trees are also highly consistent with minor differ-ences. The phenograms are rather consistent with morphology because the populations of each species cluster
together; species belonging to the section Algarobia are clustered in a single group; andP. kuntzei, which is morpho-logically very different from the remaining species studied of Algarobia, is the most phenetically distant species of this section. ExcludingP. kuntzei,P. velutina(Arizona, USA) is the most differentiated of Algarobia, and the cluster formed by the Argentinean speciesP. ruscifoliaandP. flexuosawith the North AmericanP. glandulosa(Figure 2).
The distance between the populations ofP. argentina andP. reptansHerrera was almost as high as that recorded among any of the Algarobia species.
Table 4- Nei (above diagonal) and Manhattan (below diagonal) genetic distance matrix.
P. ru
HE
P. ru
SA
P. ru
RI
P. ru
PI
P .fl
LA
P .fl
QU
P. gl
WE
P. gl
LC
P. gl
BC
P. gl
FC
P. ve
SR
P. ku
TA
P. ar
TI
P. ar
TU
P. re
He
P. ruHE 0.010 0.014 0.036 0.078 0.063 0.031 0.041 0.040 0.041 0.223 0.290 0.491 0.488 0.452
P. ruSA 4.00 0.013 0.025 0.086 0.061 0.036 0.043 0.042 0.038 0.212 0.306 0.541 0.526 0.462
P. ruRI 4.00 2.00 0.040 0.074 0.061 0.051 0.057 0.061 0.048 0.213 0.295 0.509 0.500 0.445
P. ruPI 4.00 4.00 4.00 0.095 0.055 0.038 0.021 0.040 0.037 0.197 0.328 0.532 0.515 0.476
P. flLA 12.00 10.00 10.00 8.00 0.037 0.104 0.112 0.118 0.119 0.301 0.351 0.500 0.504 0.534
P. flQU 12.00 10.00 10.00 8.00 8.00 0.068 0.068 0.078 0.072 0.233 0.342 0.482 0.479 0.485
P. glWE 12.00 10.00 10.00 8.00 8.00 12.00 0.016 0.013 0.015 0.206 0.307 0.543 0.570 0.473
P. glLC 11.00 9.00 9.00 7.00 9.00 11.00 3.00 0.022 0.015 0.189 0.296 0.503 0.492 0.453
P. glBC 13.00 11.00 11.00 9.00 11.00 13.00 3.00 4.00 0.015 0.199 0.330 0.565 0.553 0.472
P. glFC 12.00 10.00 10.00 10.00 10.00 14.00 4.00 5.00 7.00 0.181 0.313 0.537 0.524 0.438
P. veSR 22.00 20.00 20.00 20.00 20.00 22.00 14.00 17.00 17.00 18.00 0.478 0.760 0.743 0.561
P. kuTA 27.00 27.00 25.00 27.00 31.00 31.00 27.00 26.00 26.00 29.00 33.00 0.667 0.676 0.616
P. arTI 38.00 40.00 38.00 38.00 38.00 36.00 44.00 41.00 41.00 42.00 52.00 37.00 0.012 0.666
P. arTU 39.00 41.00 39.00 39.00 39.00 37.00 45.00 42.00 42.00 43.00 53.00 38.00 1.00 0.665
P. reHE 47.00 47.00 47.00 49.00 49.00 49.00 49.00 48.00 46.00 49.00 47.00 40.00 41.00 40.00
Discussion
According to the differences in genetic variability, two heterogeneous groups of species can be established. The first one, with high variability, involves all species studied of section Algarobia except forP. kuntzei. The sec-ond one, with low variability, is represented by the remain-ing species.
The causes for the differences in genetic variability may be related to the reproductive system, the adaptive strategies or the evolutionary history of these species. The species of Algarobia with high variability were largely con-sidered outcrosser, with self-incompatibility system (Solbrig and Bawa, 1975; Solbrig and Cantilo, 1975; Neff et al., 1977; Simpson, 1977; Simpsonet al., 1977; Hunziker et al., 1986). Recent studies on the mating system ofP. alba, P. nigra, P. flexuosa, P. glandulosa, P. velutina, P. ruscifolia, andP.chilensis(Bessegaet al., 2000b) indicated that they are mostly outcrosser, although about 15% selfing can occur. Besides, these species are widely distributed and able to grow in diverse soils (Burkart, 1976). Finally, Bessegaet al. (2000a) advanced the hypothesis that hybrid-ization may have played a role in the first steps of species diversification of this group promoting reticulate evolution and boosting invasiveness ability. Information about the mating system of the remaining species is lacking.P. ar-gentinais endemic and restricted to the western Argentin-ean provinces of Catamarca, La Rioja, and Mendoza, and, in contrast with most species of Algarobia,P. argentina shows a marked preference for soft and sandy soils (Burkart, 1976). Consequently, it can be considered a highly specialized species and its low variability a conse-quence of this high specialization. The low variability ofP. reptans, as well as other species of the section Strombocarpa, had been previously recorded by Saidmanet al., (1996). Selfing in species of Strombocarpa can not be ruled out because at least one species of this section,P. tamarugo, appears to self (Hunziker et al., 1986). P. reptanswas shown to be able to undergo vegetative repro-duction by means of underground runners (Burkart, 1976; Roig, 1993). The ability to reproduce vegetatively and the possibility of selfing allow the advancement of the hypoth-esis that the low variability inP. reptansmight be the result of founder effect associated with colonization and a certain degree of endogamy (Saidmanet al., 1996). However, the estimatedFISdoes not suggest a higher tendency to selfing
than the rest of the studied species ofProsopis.
Populations of P. kuntzei are usually dense and widely distributed. Therefore, low population sizes are not a likely explanation for its low variability. Its ability to col-onize is similar to that of other species of Algarobia, but un-like the others, P. kuntzei apparently is not involved in natural hybridization events. The evolutionary history of this species might be very different from that of the remain-ing species of the same section. If hybridization did not play a role in the early evolution of this species, its variability
might have been rapidly eroded. The actual cause for the low variability inP. kuntzeishould be addressed through deeper analyses of its mating system.
The analysis of isoenzymatic patterns indicated that P. argentina,P. reptans,P. kuntzei, andP. velutinacan be differentiated from each other and from the rest of the spe-cies studied here. The remaining spespe-cies, which belong to section Algarobia, exhibit, for most enzyme loci, transspecies polymorphisms (similar to those described for DNA sequences in Klein, 1980; Garrigan and Hedrick, 2003), differing from each other only in allelic frequencies. The similarities obtained from isozyme data agree with the expected relationships among the three sections based on morphological grounds (Burkart, 1976). P. argentina (Monilicarpa) andP. reptans(Strombocarpa) are clearly differentiated from each other and from species of Algarobia. This result is consistent with studies based on phenolic compounds (Carman, 1973) and seed proteins (Burghardt and Palacios, 1997). The high biochemical dif-ferentiation observed among species belonging to different sections supports the hypothesis that these groups are natu-ral and that the sections in the Burkart’s (1976) system might be elevated to subgenera as suggested by Hunzikeret al., (1986), Saidman et al., (1996), and Burghardt and Palacios (1997).
Among the species of Algarobia studied here P. kuntzeiwas the most differentiated isoenzymatically. This result is also consistent with morphological data because this species andP. sericanthaare subaphyllous and horrid trees or shrubs with all branchlets spiny, included in a sepa-rate series, Sericanthae. Besides, although natural hybrid-ization is very frequent between species of Algarobia belonging to different series (Palacios and Bravo, 1981; Hunzikeret al., 1986), no hybrids have been described in-volvingP. kuntzei. In the present paper,P. kuntzeishows private isoenzymatic patterns, genetic variability signifi-cantly lower than the remaining species of Algarobia, and the degree of genetic differentiation with respect to the maining species of Algarobia is almost as high as those re-corded for P. reptans (Strombocarpa) or P. argentina (Monilicarpa). This evidence suggests thatP. kuntzeimight be included in a section different from that involving the rest of Algarobia species studied here.
glandulosaandP. velutinawould have originated from two independent founder events.
Acknowledgments
We wish to express our gratitude to Ing. Hugo Cordo and Dr. J. C. Evans for his invaluable help in obtaining samples from the USA and to Prof. R. A. Palacios for taxonomic identification of Argentinean species. Special thanks to Dr. P. Villagra and Ing. M. Cony who generously provided the samples ofP. argentina. This work was carried out thanks to the financial support of the Universidad de Buenos Aires (PID Nº X086), Agencia Nacional de Promoción Científica y Tecnológica (PICT Nº 06628) and Consejo Nacional de Investigaciones Científicas y Técnicas (PIP 0722/98).
References
Analytical Software (1996) Statistix ver. 1.0: User’ s Manual. An-alytical Software. Tallahassee, FL.
Bessega C (2001) Estructura poblacional y relaciones filoge-néticas (distancia y parsimonia) en especies del género
Prosopis(Leguminosae). PhD Thesis, FCEyN. Universidad
de Buenos Aires, Buenos Aires, Argentina.
Bessega C, Ferreyra LI, Saidman BO and Vilardi JC (2000)a Un-expected low genetic differentiation among allopatric spe-cies of section Algarobia of Prosopis (Leguminosae). Genetica 109:255-266.
Bessega C, Ferreyra LI, Julio N, Montoya S, Saidman BO and Vilardi JC (2000)b Mating system parameters in species of genusProsopis(Leguminosae). Hereditas 132:19-27. Bessega C, Saidman BO and Vilardi JC (2000)c Isozyme and
RAPD studies in Prosopis glandulosa and P. velutina
(Leguminosae, Mimosoideae). Genetics and Molecular Bi-ology 23:1-5.
Black IV WC (1996) FORTRAN programs for the analysis of RAPD-PCR markers in populations. Colorado State Univer-sity, Ft. Collins, CO, USA.
Burghardt AD and Palacios RA (1997) Electrophoretic character-ization of the American sections of Prosopis L. (Leguminosae: Mimosoidae). Bull of the International Group for the study of Mimososidae 20:71-83.
Burkart A (1937) Una nueva especie deProsopisdel Monte occi-dental argentino. Revista Argentina de Agronomía 4:39-42. Burkart A (1976) A monograph of the genus Prosopis
(Leguminosae subfam. Mimosoidae). Journal Arnold Arbo-retum 57:219-525.
Carman NJ (1973) Systematic and ecological investigations in the genusProsopis(Mimosaeae) emphasizing the natural prod-ucts chemistry. PhD. Thesis, University of Texas, Austin, USA.
Garrigan D and Hedrick PW (2003). Perspective: Detecting adap-tive molecular polymorphism: lessons from the MHC. Evo-lution 57:1707-1722.
Hunziker JH, Naranjo CA, Palacios RA, Poggio L and Saidman BO (1986) Studies on the taxonomy, genetic variation and biochemistry of Argentine species ofProsopis. Forest Ecol-ogy and Management 16:301-315.
Klein J (1980) Generation of diversity at MHC loci: Implications for T-cell receptor repertoires. In: Fougereau M and Dausset J (eds) Immunology 80, Academic Press, London, pp 239-253.
Nei M (1978) Estimation of average heterozygosity and genetic distance from a small numbers of individuals. Genetics 89:583-590.
Neff JL, Simpson BB and Moldenke AR (1977) Flowers-flower visitor system. In: Orians GH and Solbrig OT (eds) Conver-gent Evolution in Warm Deserts. US/IBP Synthesis Series, Dowden Hutchinson and Ross, Stroudsburg, pp 204-223. Palacios RA and Bravo ID (1981) Hibridación natural enProsopis
(Leguminosae) en la Región Chaqueña Argentina. Eviden-cias morfológicas y cromatográficas. Darwiniana 23:3-35. Ramírez L, De La Vega A, Razkin N, Luna V and Harris PJC
(1999) Analysis of the relationships between species of the genusProsopisrevealed by the use of molecular markers. Agronomie 19:31-43.
Roig FA (1993) Aportes a la etnobotánica del géneroProsopis. In: Unidades de Botánica y Fisiología Vegetal, IADIZA (eds) Contribuciones Mendocinas a la Quinta Reunión Regional para América Latina y el Caribe de la Red de Forestación del CIID, pp 99-121.
Saidman BO (1985) Estudio de la variación alozímica en el géneroProsopis. PhD Thesis, FCEyN, Universidad de Bue-nos Aires, BueBue-nos Aires, Argentina.
Saidman BO and Vilardi JC (1987) Analysis of the genetic simi-larities among seven species ofProsopis (Leguminosae: Mimosoideae). Theoretical Applied Genetics 75:109-116. Saidman BO and Vilardi JC (1993) Genetic variability and
germplasm conservation in the genusProsopis. In: Puri S (ed) Nursery Technology of Forest Tree Species of Arid and Semiarid Regions. Winrock-Oxford & IBH Publishing Co. PVT. LTD., New Delhi, Bombay, Calcuta, pp 187-198. Saidman BO, Vilardi JC, Pocoví MI and Acreche N (1996)
Isozyme studies in Argentine species of the Section Strombocarpa, GenusProsopis(Leguminosae). J Genetics 75:139-149.
Saidman BO, Vilardi JC, Montoya S and Poggio L (1997) Genetic variability and ploidy level in species of Prosopis
(Leguminosae). Bol Soc Argent Bot 32:217-225.
Saidman BO, Bessega C, Ferreyra LI and Vilardi JC (1998)a Ran-dom amplified polymorphic DNA (RAPDS) variation in hy-brid swarms and pure populations of genusProsopis. In: Bruns S, Mantell S, Tragärdh C and Viana AV (eds) Recent Advances in Biotechnology for Tree Conservation and Man-agement International Foundation for Sciences. Stockholm, pp 122-134.
Saidman BO, Vilardi JC, Montoya S, Dieguez MJ and Hopp HE (1998)b Molecular markers: A tool for the understanding of the relationships among species ofProsopis(Leguminosae, Mimosoidae). In: Puri S (ed) Tree Improvement: Applied Research and Technology Transfer. Science Publishers Inc. USA, pp 311-324.
Saidman BO, Bessega C, Ferreyra LI, Julio N and Vilardi JC (2000) The use of genetic markers to assess population structure and relationships among species of genusProsopis
(Leguminosae). Bol Soc Argent Bot 35:315-324.
Simpson BB (1977) Breeding system of dominant perennial plants of two disjunct warm desert ecosystems. Oecologia 27:203-226.
Solbrig OT and Bawa KS (1975) Isoenzyme variation in species
of Prosopis (Leguminosae). Journal Arnold Arboretum
56:398-412.
Solbrig OT and Cantilo PD (1975) Reproductive adaptations in
Prosopis(Leguminosae, Mimosoisae). Journal Arnold
Ar-boretum 56:185-210.
StatSoft, Inc (1995) STATISTICA for Windows [Computer pro-gram manual]. Tulsa, OK: StatSoft, Inc., 2300 East 14th Street, Tulsa, OK, http://www.statsoftinc.com.
Swofford DL and Selander RB (1981) BIOSYS-1.7: A FORTRAN program for the comprehensive analysis of elec-trophoretic data in populations genetics and systematics. J Hered 72:281-283.
Verga AR (1995) Genetische untersuchungen an Prosopis
chilensis und Prosopis flexuosa (Mimosaceae) im
trockenen Chaco Argentiniens. PhD Thesis, Universität Göttingen.
Vilardi JC, Saidman BO and Palacios RA (1988) Muestreo según variabilidad. In:Prosopisen Argentina. Documento preli-minar elaborado para el I Taller Internacional sobre Recur-sos Genéticos y Conservación de Germoplasma en
Prosopis. FCA. UNC-FAO, PIRB, pp 119-124.
Wright S (1951) The genetical structure of populations. Annals eugenics 15:323-354.